An Analytics Approach to Problems in Health Care
by
Jerry Lai Kung
A.B., Harvard College (2011)
M.A.St., University of Cambridge (2012)
Submitted to the Sloan School of Management
in partial fulfillment of the requirements for the degree of
Doctor of Philosophy in Operations Research
at the
MASSACHUSETTS INSTITUTE OF TECHNOLOGY
June 2017
c
○ Massachusetts Institute of Technology 2017. All rights reserved.
Author . . . .
Sloan School of Management
May 15, 2017
Certified by . . . .
Dimitris Bertsimas
Boeing Professor of Operations Research
Co-director, Operations Research Center
Thesis Supervisor
Accepted by . . . .
Patrick Jaillet
Dugald C. Jackson Professor
Department of Electrical Engineering and Computer Science
Co-Director, Operations Research Center
An Analytics Approach to Problems in Health Care
by
Jerry Lai Kung
Submitted to the Sloan School of Management on May 15, 2017, in partial fulfillment of the
requirements for the degree of
Doctor of Philosophy in Operations Research
Abstract
Health care expenditures in the United States have been increasing at unsustainable rates for more than thirty years with no signs of abating. Decisions to accept or reject deceased-donor kidneys offered to patients on the kidney transplantation waitlist currently rely on physician experience and intuition. Scoring rules to determine which end-stage liver disease patients are in most dire need of immediate transplantation have been haphazardly designed and reactively modified in an attempt to decrease waitlist mortality and increase fairness for cancer patients.
For each of the above problem settings, we propose a framework that takes real-world data as input and draws upon modern data analytics methods ranging from mixed integer linear optimization to predictive machine learning to yield actionable insights that can add a significant edge over current practice.
We describe an approach that, given insurance claims data, leads conservatively to a 10% reduction in health care costs in a study involving a large private US employer. Using historical data for patients on the kidney waitlist and organ match runs, we build a model that achieves an out-of-sample AUC of 0.87 when predicting whether or not a patient will receive a kidney of a particular quality within three, six, or twelve months. Given historical data for patients on the liver waitlist, we create a unified model that is capable of averting an additional 25% of adverse events in simulation compared to current practice without disadvantaging cancer patients.
Thesis Supervisor: Dimitris Bertsimas
Title: Boeing Professor of Operations Research Co-director, Operations Research Center
Acknowledgments
I wish to acknowledge and thank my advisor, Dimitris Bertsimas, for all of his thought-ful and kind-hearted support over the last five years. He has been my number one advocate throughout my time at MIT, and it has been a tremendous privilege to be mentored by an individual with an unparalleled clarity of research vision and a singular devotion to improving the human condition through such novel research.
I would also like to thank the two other members of my thesis committee: Nikolaos Trichakis and Vivek Farias. In particular, Nikos has been extremely helpful in taking the time to lend valuable insights that were indispensable in the preparation of the second and third parts of this thesis. I am grateful to Vivek for also serving on my general examination committee and providing excellent feedback throughout.
I thank Laura Rose and Andrew Carvalho for their tireless efforts in making the ORC run smoothly day-to-day. I am also very thankful for the assistance of Stephen Sofoul and Benefits Science Technologies for making the data available for the first part of this thesis. I thank Parsia Vagefi and David Wojciechowski for all of the fruitful discussions regarding kidneys and livers.
I am especially grateful for all of the students at the ORC, of which there are too many to name, with whom I have had the immense pleasure of learning, collaborating, and socializing. Special mention goes to Martin Copenhaver and Iain Dunning for the many existential discussions over chicken and memes.
I thank David Parkes for his continued mentorship. My college friends have also been a consistent source of support since my undergraduate days. While I do not get to see them nearly enough, it is always a joy to know that we can always pick up exactly where we left off.
Of course, I am incredibly indebted to mom, dad, grandma, John, Wendy, Jimmy, Wanyi, Frank, Chris, Danny, and Timmy, for their boundless love and unwavering encouragement.
Contents
1 Introduction 15
1.1 Optimally Selecting Health Care Providers to Decrease Costs . . . 16
1.1.1 Problem of Interest . . . 16
1.1.2 Our Contributions . . . 16
1.2 Predicting Wait Time for Kidneys to Assist with Acceptance/Rejection Decisions for Waitlist Patients . . . 17
1.2.1 Problem of Interest . . . 17
1.2.2 Our Contributions . . . 17
1.3 Ranking Liver Patients by Disease Severity to Decrease Adverse Events on the Waitlist . . . 18
1.3.1 Problem of Interest . . . 18
1.3.2 Our Contributions . . . 18
2 Optimal Selection of Health Care Providers 21 2.1 Introduction . . . 21 2.1.1 Our Contributions . . . 23 2.1.2 Outline . . . 24 2.2 The Dataset . . . 24 2.2.1 Descriptive Analytics . . . 25 2.2.2 Problem of Interest . . . 28
2.2.3 Data Cleaning Procedures . . . 28
2.3 Model Formulation . . . 30
2.3.2 Notation . . . 33
2.3.3 Mixed Integer Linear Optimization Approach . . . 35
2.4 Insights from Computations . . . 37
2.4.1 Computations Conducted . . . 37
2.4.2 Computational Results and Sensitivity Analysis . . . 38
2.4.3 Understanding Effects on Individual Procedures . . . 45
2.5 Policy Implications . . . 50
2.6 Future Directions and Conclusion . . . 51
3 Accept or Decline? An Analytics-Based Decision Tool for Kidney Offer Evaluation 53 3.1 Introduction . . . 53
3.2 Data and Methods . . . 54
3.2.1 Data . . . 55
3.2.2 Methods for Wait time Prediction . . . 55
3.2.3 Observations and Independent Variables . . . 55
3.2.4 Performance Evaluation . . . 58
3.3 Results . . . 60
3.3.1 AUC . . . 60
3.3.2 Accuracy Within Clusters of Similar Patients . . . 61
3.3.3 Example of Intended Usage . . . 64
3.3.4 On the Adaptability of the Prediction Method . . . 66
3.4 Discussion . . . 67
4 Who Deserves Priority? Predicting Adverse Events on the Liver Transplant Waitlist 71 4.1 Introduction . . . 71
4.2 History and Current Practice: Model for End-Stage Liver Disease (MELD) . . . 72
4.2.1 The Pre-MELD Era . . . 73
4.2.3 Beyond MELD: An Integrated Model . . . 75
4.3 Data and Methods . . . 76
4.3.1 Data . . . 76
4.3.2 Methods for Predicting Benefit of Transplantation . . . 76
4.3.3 Observations and Independent Variables . . . 77
4.3.4 Performance Evaluation . . . 79
4.4 Results . . . 82
4.4.1 AUC . . . 82
4.4.2 Adverse Events Averted by Each Model . . . 82
4.5 Discussion . . . 85
5 Conclusion 91
List of Figures
2-1 Total costs paid out by insurance plan for procedures and drugs over
time . . . 26
2-2 Distribution of costs over patients for each of the four plan years . . . 27
2-3 Small counter-example against greedy consideration of neighbors . . . 32
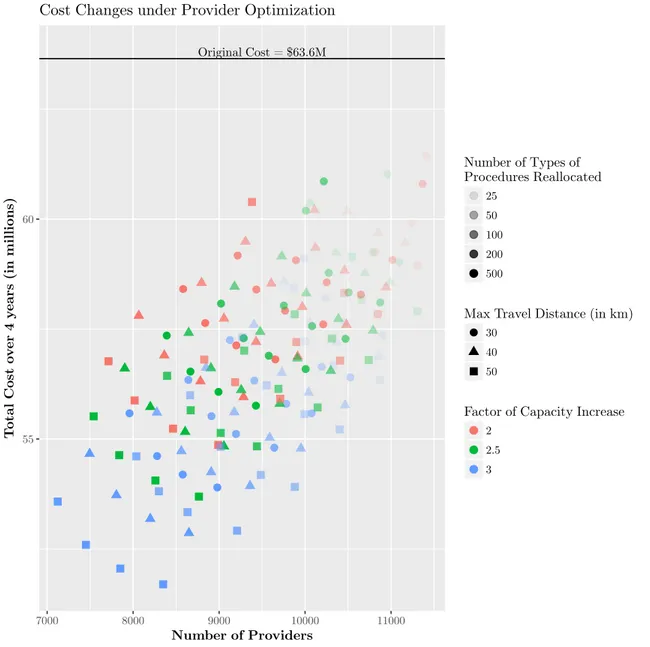
2-4 Cost changes under provider optimization . . . 39
2-5 Variation in total cost under different values of 𝛿 . . . 40
2-6 Variation in total cost under different values of 𝜑 . . . 41
2-7 Variation in total cost under different values of 𝜆 . . . 43
2-8 Variation in total cost under different values of 𝐷𝑘. . . 44
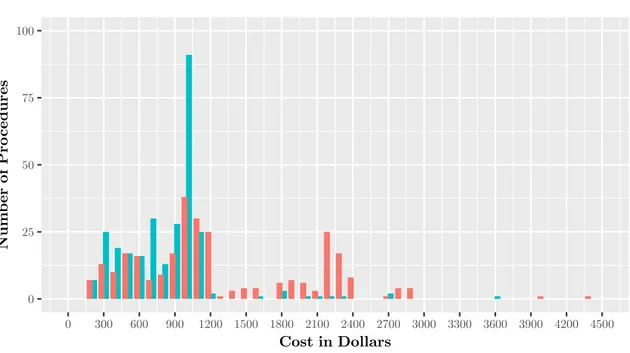
2-9 Histogram of Colonoscopy/Biopsy pricing in original dataset and in the solution to the provider optimization problem . . . 46
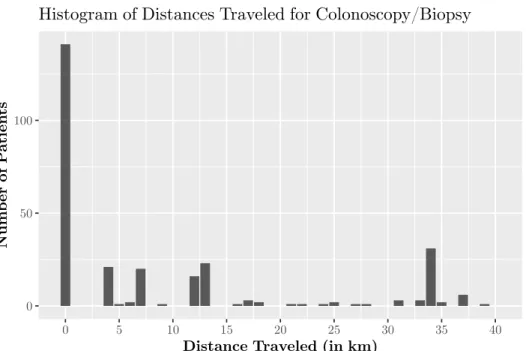
2-10 Histogram of distances traveled between original service location and new provider prescribed by the optimal solution . . . 47
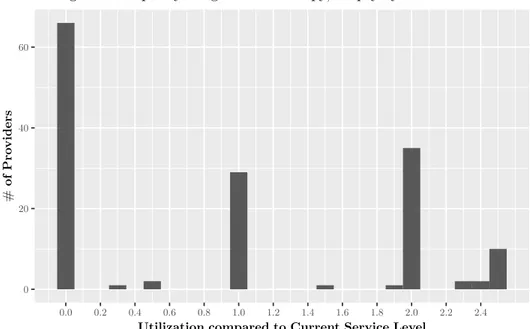
2-11 Histogram of capacity utilization levels at providers delivering Colonoscopy/ Biopsy by multiplicative factor of original service level . . . 49
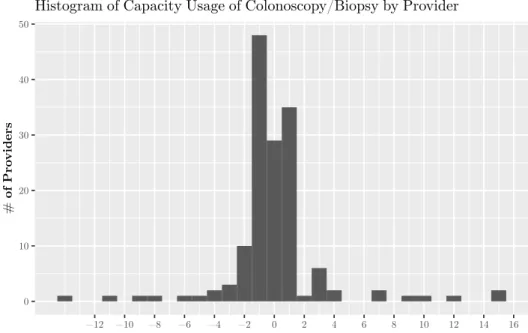
2-12 Histogram of capacity utilization levels at providers delivering Colonoscopy/ Biopsy by absolute change in number of procedures delivered . . . 50
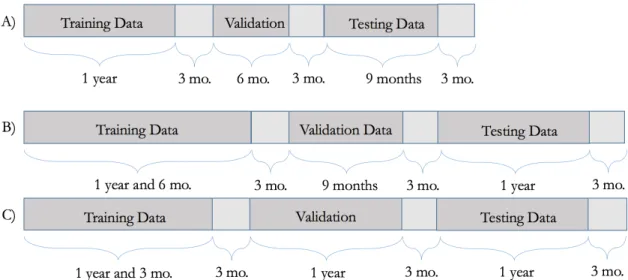
3-1 Visualization of different training/validation/testing splits . . . 60
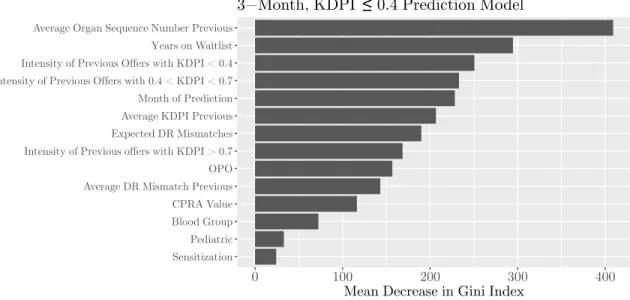
3-2 Variable importance plot for three-month, KDPI ≤ 0.4 specification . 61 3-3 Variable importance plot for six-month, KDPI≤ 0.4 specification . . 62
3-5 Predicted versus actual probabilities of a KDPI ≤ 0.4 offer within six
months for Type O in California (CAOP) . . . 63
3-6 Predicted versus actual probabilities of a KDPI ≤ 0.4 offer within six
months in California (CAOP) . . . 64
3-7 Predicted versus actual probabilities of a KDPI≤ 0.4 offer for patients
of blood group O in New York (NYRT) within six months, by DR
mismatches . . . 65
3-8 AUC value evolution over increasing amounts of data . . . 66
4-1 Variable importance plot for the 3-month adverse event prediction
ran-dom forest model . . . 83
4-2 Geography of service regions . . . 84
4-3 Mean number of adverse events averted by region in simulation by
random forest, unadjusted MELD, and HCC-adjusted MELD for organ
arrival sample paths from previous years . . . 86
4-4 Percentage increase in adverse events averted by random forest and
unadjusted MELD over HCC-adjusted MELD for all patients in each
region for organ arrival sample paths from previous years . . . 87
4-5 Percentage change in adverse events averted by random forest and
unadjusted MELD over HCC-adjusted MELD for cancer patients in
each region for organ arrival sample paths from previous years . . . . 87
A-1 Histogram of price changes for Upper GI Endoscopy Biopsy . . . 94
A-2 Histogram of travel distances for Upper GI Endoscopy Biopsy . . . . 94
A-3 Histogram of price changes for CT Scan of Abdomen and Pelvis . . . 95
A-4 Histogram of travel distances for CT Scan of Abdomen and Pelvis . . 95
A-5 Histogram of price changes for MRI of Brain . . . 96
A-6 Histogram of travel distances for MRI of Brain . . . 96
A-7 Histogram of price changes for Lesion Removal Colonoscopy . . . 97
List of Tables
2.1 Quintiles of patient costs by plan year in dollars . . . 26
3.1 Out-of-sample AUC values for the random forest model . . . 61
3.2 Predicted versus actual probabilities that patient J.S. will be offered a
kidney of KDPI≤ 0.4 within the next six months . . . . 65
3.3 Out-of-sample AUC values for random forest and classification tree . 70
3.4 Out-of-sample AUC values for random forest and logistic regression . 70
3.5 Predicted versus actual probabilities that patient J.S. will be offered
a kidney of KDPI≤ 0.4 within the next six months for random forest
and logistic regression . . . 70
4.1 Mean number of adverse events averted for all patients in simulation
by random forest, unadjusted MELD, and HCC-adjusted MELD for
organ arrival sample paths from previous years . . . 84
4.2 Mean number of adverse events averted for cancer patients in
simula-tion by random forest, unadjusted MELD, and HCC-adjusted MELD
Chapter 1
Introduction
This thesis addresses three pressing problems facing businesses, health care practi-tioners, and transplant patients in our nation today: the ballooning costs of providing health insurance for employees; the difficult decision of whether to accept or reject a current kidney offer in anticipation of a future higher-quality offer; and, the critical— and often life-or-death—decision of determining which patients should receive greater priority for liver transplantation. For each of these problems, the unifying element is the centrality and importance of data and data analytics as part of our approach. In the domains of insurance claims and organ transplantation, high-quality data has been collected for many years now, and, in each chapter of this thesis, we propose novel frameworks for how to harness the power of these existing datasets to arrive at actionable decisions that can add a significant edge over current practice. Our contributions have important implications in lowering health care costs for employers and improving patient outcomes in transplantation.
We provide a brief outline of each of these three problems, as well as our contri-butions, before expositing them in more detail in the subsequent chapters.
1.1
Optimally Selecting Health Care Providers to
Decrease Costs
1.1.1
Problem of Interest
Health care expenditures in the United States (US) have been increasing at unsustain-able rates for more than thirty years with no signs of abating. A significant proportion of increasing expenditures can be attributed to a lack of price transparency. We as-pire to address the problem of rising health care costs for self-insured employers with access to employees’ claims data by identifying lower cost providers in an optimal way.
1.1.2
Our Contributions
We propose an approach based on mixed integer linear optimization that utilizes the data to generate decisions on how to optimally select providers to minimize cost, while respecting convenience for employees. We demonstrate that our approach is tractable for large-scale datasets and present the computational results on a real health care claims dataset.
Our data-driven, optimization-based approach leads conservatively to a 10% re-duction of health care costs in a real-world study involving a large private US em-ployer with 14,000 dependents. This is achieved by reassigning patients to different providers for a small number of procedures with a relatively small degree of employee inconvenience (an average (maximum) increase of health care related travel of 18km (40km)). These cost reductions are robust to changes in a variety of parameters.
Our framework generates a list of low-cost providers capable of providing an as-sortment of procedures that adequately cover the existing patient population. This list could be used to suggest providers or inform potential partnerships for service contracts. Our data-driven framework for reducing costs underscores the potential of harnessing the power of large datasets and associated approaches towards alleviating one of the most serious issues facing the US today.
1.2
Predicting Wait Time for Kidneys to Assist with
Acceptance/Rejection Decisions for Waitlist
Pa-tients
1.2.1
Problem of Interest
When a deceased-donor kidney is offered to a candidate on the kidney transplantation waitlist, the decision to accept or decline the organ relies primarily upon a health care practitioner’s experience and intuition. Such decisions must achieve a delicate balance between estimating the immediate benefit of transplantation and the potential
for future higher-quality offers. However, the current experience-based paradigm
lacks scientific rigor and is subject to the inaccuracies that plague anecdotal decision-making. We aim to progress beyond this intuition-based decision-making process by providing data-driven support for practitioners who are responsible for these complex decisions. In this way, we aspire to significantly improve patient outcomes in kidney transplantation.
1.2.2
Our Contributions
We develop a data-driven analytics-based model to predict whether a patient will receive an offer for a deceased-donor kidney of varying quality thresholds at time frames of three, six, and twelve months. Our model accounts for the patient’s service region, blood group, wait time, antigen profile, and prior offer history to provide accurate and personalized predictions.
Using historical data from 2007 to 2013, we train our model and test it out of sample. Our model achieves an out-of-sample AUC of approximately 0.87 for all of the kidney quality thresholds and time frames that we consider for the ten most populous service regions. We investigate the adaptability of our model given increasing amounts of data and observe that as additional data becomes available, AUC values increase before subsequently leveling off.
Our data-driven analytics-based model may assist transplant practitioners and candidates during the complex decision of whether to accept or forgo a current kidney offer in anticipation of a future high-quality offer. In summary, our approach holds promise as a means to facilitate timely transplantation and optimize the efficiency of the allocation overall.
1.3
Ranking Liver Patients by Disease Severity to
Decrease Adverse Events on the Waitlist
1.3.1
Problem of Interest
When a deceased-donor liver is procured, health care practitioners must make a de-termination as to which patients deserve the greatest priority for transplantation. Unlike kidney transplant candidates for whom the option for dialysis significantly reduces the risk of demise while waiting for the “next” offer, liver transplant candi-dates face a more immediate “life-or-death” situation whereby disease severity cannot be reliably controlled in the absence of a liver transplant. Current practice relies on ranking patients by their model for end-stage liver disease (MELD) score, which has been haphazardly tweaked and adjusted to compensate for deficiencies in overall waitlist mortality rate and fairness for particular patient subpopulations that have been observed ex-post. We aspire to introduce a unified model that accounts for all patient characteristics to decrease adverse events on the waitlist and enable a more equitable organ allocation policy.
1.3.2
Our Contributions
Given historical data on the liver transplantation waitlist dating back almost two decades, we train a predictive model for the problem of determining the probability with which patients will suffer an adverse event of either death or unsuitability for liver transplant within the next three months. Our model not only greatly outperforms the MELD score and its variants in out-of-sample AUC for this particular prediction
problem, but it also addresses the shortcomings of MELD and its variants when making accurate predictions for cancer patients.
We conduct a simulation experiment comparing the number of adverse events averted when ranking waitlist patients by the currently implemented MELD policy and our model, and we observe that our model increases the number of adverse events averted over the current MELD score by approximately 25% over the entire patient population while also maintaining fairness for cancer patients.
Chapter 2
Optimal Selection of Health Care
Providers
2.1
Introduction
For more than thirty years, the cost of health care in the United States (US) has been increasing at a rate far greater than in other industrialized countries around the world [Squires, 2012]. In 1980, total health care expenditures accounted for approximately 9% of the total gross domestic product (GDP) of the US. By 2009, it accounted for 17.4% of total GDP. In contrast, the country with the second-highest health spending as a percentage of GDP in 2009 was the Netherlands, at 12% of total GDP. The ballooning of health care costs in the US is likely to continue its upward trajectory; unless action is taken, spending on health care is projected to reach a quarter of total US GDP by 2037 [Squires, 2012].
Per capita spending on health care (after adjusting for purchasing power par-ity) in the US was almost 80% higher than in Norway, the next highest country [Squires, 2012]. The greater expense of health care costs in the US has been at-tributed to higher prices than in other OECD countries. However, these higher prices have not translated to better quality. For instance, US hospitals are about aver-age when measured by in-hospital mortality rates for heart attacks and stroke, and far below average for largely preventable deaths due to complications from asthma
and diabetic amputations [Squires, 2012]. Additionally, the five-year survival rate for breast cancer, cervical cancer, and colorectal cancer is no higher in the US than in other OECD countries [Squires, 2012].
One of the main drivers of higher prices in the US health care industry is the lack of transparency of how much a procedure costs [Beck, 2014]. The amount paid for a particular procedure is highly dependent on who is paying the bill and can differ, in some instances, by several orders of magnitude. For example, Medicare would reimburse $335 for an MRI at a hospital in Dearborn, Michigan, while some private insurance companies would pay up to $1,990 for the same procedure at the same hospital [Beck, 2014]. Some of these large pricing differentials are a result of the asymmetry of market power between private health insurance companies and larger regional hospitals. Many experts also argue that prices vary as a result of different accounting methods that allow hospitals to recoup losses from more costly services, although this does not explain high costs for office visits [Beck, 2014].
In addition to the opaque nature of price setting for medical procedures, many large-scale providers have implemented non-competitive contracting policies that lead to unjustified price differentials [Commonwealth, 2011]. These providers, often spread out across large geographical areas, force payers to negotiate on a single price for all locations, even if payers only wish to utilize one location. This leads to higher prices in locations where geographic differences do not warrant them and exacerbates the problem of large variations in price within a small area.
Many experts in the medical community have started calling for full transparency of pricing for medical procedures [Emanuel et al., 2012, Sinaiko and Rosenthal, 2011]. While some states such as California, Massachusetts, and New Jersey have started reporting basic summary statistics regarding charges for common procedures in hos-pitals in an effort to empower patients as they decide where to seek treatment, some have argued this transparency in and of itself does not lead to decreased costs [Sinaiko and Rosenthal, 2011]. In fact, since most patients are insured and thus im-munized against much of the price variation above their deductibles, it is possible for such transparency to lead to increased costs on the part of the insurer, as the
incentives for seeking cheaper care are severely reduced.
Many insurance companies have begun to develop reference prices for particular procedures; once reference prices are set, they will only cover costs up to the reference price. Patients are free to select their medical provider, but are responsible for any charges incurred above the reference price. The potential implications of data-driven pricing cannot be understated. Using reference pricing on hip and knee replacements alone, WellPoint, a large insurance company, was able to decrease prices in more expensive hospitals by up to one-third between 2008 and 2012 [Reinhardt, 2013]. With the advent of more plentiful electronic data, the time is ripe for employers to utilize data-driven decision-making to tackle the unsustainable explosion in health care costs in the US.
2.1.1
Our Contributions
In this paper, we propose a framework through which employers who self-insure can identify lower-cost medical providers that are convenient for their employees. Our framework utilizes historical electronic claims data to determine providers that are already charging reasonable prices and that are in close geographical proximity to the patient population. We discuss how to process general electronic claims datasets to extract the relevant information necessary to conduct this analysis.
Our main contributions are two-fold. First, we propose an approach based on mixed integer linear optimization that can be practically solved to optimality for large-scale datasets. We then demonstrate that the computational results returned by this approach can yield significant reductions in overall costs for medical proce-dures. We consider the sensitivity of our results to changes in a variety of our initial assumptions and observe that the cost savings are robust to these changes. Our mod-eling framework naturally lends itself to providing actionable decisions, thus bridging the gap between descriptive and prescriptive analytics. We also provide a discussion of how these prescriptions for optimally selecting medical providers can be realized in practice, so that these cost savings can be achieved.
2.1.2
Outline
In the next section, we discuss our dataset in more detail and provide some descrip-tive data analytics. We also formally define our problem of interest and detail our data cleaning procedures. In Section 3, we present a tractable mixed integer linear optimization approach that solves our problem of interest. In Section 4, we discuss our computational results and analyze the sensitivity of the results to different pa-rameter settings. We also consider how the changes prescribed by our approach affect the prices paid for medical procedures, the number of procedures delivered by medi-cal providers, and the distances that patients must travel. Section 5 delves into the policy implications of our work and addresses ways to implement changes in health insurance to achieve cost reductions for medical procedures. Section 6 concludes.
2.2
The Dataset
We obtained a dataset consisting of all health care claims paid out between 1 January 2011 and 1 July 2015 by a large self-insuring private employer based in the southern United States. Our dataset is 1.13GB in size, with 108 columns and approximately 1.55 million rows. Each row contains information about an insurance claim that was filed for a procedure delivered to an employee or dependent, which is described using the variables encoded in the columns. For the purposes of our analysis, we restrict attention to the following columns:
∙ ClaimType, a factor variable that denotes either medical procedure or prescrip-tion;
∙ LocationType, the type of facility where the procedure was provided (e.g., office, inpatient hospital);
∙ PersonId, a unique ID number for each individual patient; ∙ DOSStart, the start date of the medical procedure;
∙ ICD9, Name, Category, descriptions of the International Classification of Dis-eases (ICD9) code for the diagnosis;
∙ CPTCode, CPTName, descriptions of the Current Procedural Terminology (CPT) code for the procedure;
∙ ProcedureName, the name of the medical procedure;
∙ ProviderName, the name of the provider who delivered the procedure; ∙ ProviderNPI, the provider’s unique National Provider Identifier (NPI); ∙ AmtPaid, the total amount paid for the procedure.
2.2.1
Descriptive Analytics
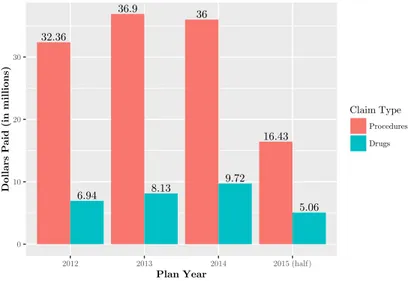
The dataset contains 1.55 million claims from more than 14,000 patients nationwide. These claims amounted to a total expenditure of more than $151 million, of which approximately $121 million were for medical procedures, and $30 million were for prescription drugs. Approximately 30,000 providers and 4,792 medical procedures appear in the dataset. Figure 2-1 breaks down the costs of procedures and drugs by plan year. Note that costs from plan year 2015 are lower than preceding years because our dataset only includes claims from the first half of the year. Furthermore, note that the plan year of a claim may not correspond to the actual year in which the procedure occurred or prescription was filled, due to delays in billing.
The mean total cost (for procedures and prescription drugs) per patient in plan year 2012 was $4032, increasing approximately 10% to $4473 in plan year 2013. Al-though there was a slight decrease in mean cost per patient in plan year 2014, halfway through plan year 2015, the mean total cost is $2415 per patient. This suggests that once all claims for 2015 are processed, there will be an increase in mean cost per patient by about 10% over that of plan year 2014. On the other hand, median cost per patient in plan year 2012 was $1011, with slight year-to-year decreases. Median cost per patient in plan year 2014 was $915. These summary statistics suggest that the distribution of patient costs is highly skewed.
32.36 6.94 36.9 8.13 36 9.72 16.43 5.06 0 10 20 30 2012 2013 2014 2015 (half) Plan Year Dollars P
aid (in millions)
Claim Type
Procedures Drugs
Figure 2-1: Total costs paid out by the insurance plan for procedures and drugs over time. Note that our dataset ends in June 2015, so the visualization only captures half of Plan Year 2015.
We can take a deeper look into how costs per patient are distributed over the patient population by looking at the quintiles of the amount paid per patient over each plan year in Table 2.1.
Percentile of Patient
Plan Year 20 40 60 80 Max
2012 $4,000 10,000 23,000 59,000 466,000
2013 5,000 13,000 30,000 88,000 521,000
2014 5,000 13,000 33,000 85,000 567,000
2015 (*) 3,000 8,000 20,000 45,000 283,000
Table 2.1: Quintiles of patient costs by plan year in dollars. Most patients incur relatively low cost, while a small percentage of the patients account for a large portion of total expenditures. (*) Data available only for the first half of 2015.
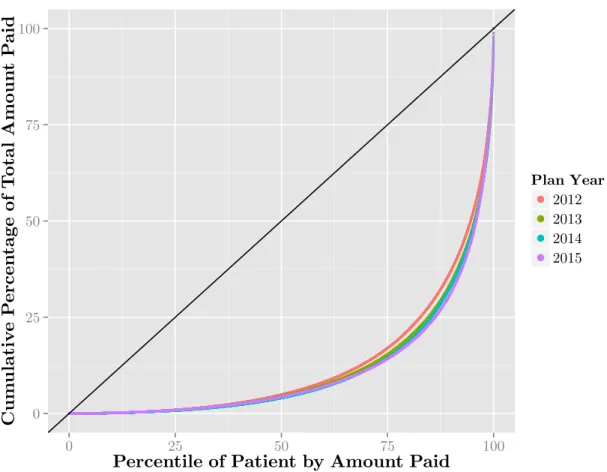
Figure 2-2 shows the cumulative contribution to the total amount paid in each plan year after sorting all of the patients by their costs. For instance, we can see that in each of the plan years, the lowest 50% of all patients contribute only about 5% of the overall cost for that particular year. The top 10% of the most expensive patients contribute approximately 60% of all of the costs. The black line in the figure is a reference for perfectly equal distribution of costs over all of the patients. Overall, from this figure, we can see that the distribution of costs over the patients is highly