CERN-EP-2019-178 19 August 2019
c
2019 CERN for the benefit of the ALICE Collaboration.
Reproduction of this article or parts of it is allowed as specified in the CC-BY-4.0 license.
Measurement of Λ(1520) production in pp collisions at
√
s
= 7 TeV and
p–Pb collisions at
√
s
NN= 5.02 TeV
ALICE Collaboration
Abstract
The production of the Λ(1520) baryonic resonance has been measured at midrapidity in inelastic pp collisions at√s= 7 TeV and in p–Pb collisions at√sNN= 5.02 TeV for non-single diffractive
events and in multiplicity classes. The resonance is reconstructed through its hadronic decay channel Λ(1520) → pK−and the charge conjugate with the ALICE detector. The integrated yields and mean transverse momenta are calculated from the measured transverse momentum distributions in pp and p–Pb collisions. The mean transverse momenta follow mass ordering as previously observed for other hyperons in the same collision systems. A Blast-Wave function constrained by other light hadrons (π, K, K0
S, p, Λ) describes the shape of the Λ(1520) transverse momentum distribution up
to 3.5 GeV/c in p–Pb collisions. In the framework of this model, this observation suggests that the Λ(1520) resonance participates in the same collective radial flow as other light hadrons. The ratio of the yield of Λ(1520) to the yield of the ground state particle Λ remains constant as a function of charged-particle multiplicity, suggesting that there is no net effect of the hadronic phase in p–Pb collisions on the Λ(1520) yield.
1 Introduction
High-energy heavy-ion (A–A) collisions offer a unique possibility to study nuclear matter under extreme temperature and density, in particular the properties of the deconfined quark–gluon plasma (QGP) [1–7], which was predicted by quantum chromodynamics (QCD) [8–12]. The interpretation of the heavy-ion results depends crucially on the comparison with results from small collision systems such as proton– proton (pp) or proton–nucleus (p–A). Measurements in pp collisions establish a reference for larger sys-tems and are used to test perturbative QCD models. The p–A collisions, which are intermediate between pp and A–A collisions in terms of system size and number of produced particles [13–15], are traditionally used to separate initial and final-state effects [16, 17]. However, at the LHC the pseudorapidity density (dNch/dη) of final-state charged particles in pp and p–A collisions can reach values comparable to those
achieved in semi-peripheral Au–Au [18] and Pb–Pb collisions [19] at the top energies of RHIC and the LHC, respectively. Therefore, there exists a possibility of final-state effects due to the formation of dense matter even in p–A collisions.
During the evolution of the systems formed in A–A or p–A collisions, the yields of short-lived resonances may be influenced by interactions in the late hadronic phase. The re-scattering of the decay products in the medium may prevent the detection of a fraction of the resonances, whereas pseudo-elastic hadron scattering can regenerate them. The strengths of the re-scattering and regeneration effects depend on the scattering cross sections of the decay products, the particle density of the produced medium, the lifetimes of the resonances and the lifetime of the hadronic phase. The latter can be studied by comparing yields of short-lived resonances with different lifetimes to yields of long-lived particles [20–23]. ALICE has observed that in the most central p–Pb and Pb–Pb collisions [21, 22, 24] the K∗0/K ratio is significantly suppressed with respect to peripheral collisions, pp collisions, and predictions of statistical hadronization models [25, 26]. A similar suppression is also observed for ρ0/π ratio in central Pb–Pb collisions with respect to peripheral Pb–Pb collisions, pp collisions, and predictions of statistical hadronization models [27]. No suppression is observed for the φ /K ratio, as the φ meson lives ten times longer than the K∗0. To provide more insight into the properties of the hadronic phase, other resonances whose lifetimes are in between those of the K∗0 (τK∗0 = 4.17 ± 0.04 fm/c [28]) and φ (τφ = 46.4 ± 0.14
fm/c [28]) should be studied. The Λ(1520) resonance is a strongly decaying particle having τΛ(1520) = 12.6 ± 0.8 fm/c [28]. This makes the study of the Λ(1520) resonance important for understanding the evolution of the system. Previously, the STAR experiment at RHIC measured Λ(1520) production in pp, d–Au and Au–Au collisions at a center-of-mass energy per nucleon pair (√sNN) of 200 GeV [23, 29]
and showed a hint of suppression of the Λ(1520)/Λ yield ratio in central Au–Au collisions compared to the values observed in pp and d–Au collisions. A measurement of the Λ(1520) in Pb–Pb collisions at √
sNN= 2.76 TeV was reported in [30]. The Λ(1520)/Λ yield ratio is found to be suppressed in central
(0–20%) Pb–Pb collisions relative to peripheral (50–80%) Pb–Pb collisions. The suppression factor is found to be 0.54±0.08(stat)±0.12(sys). The EPOS3 [31–33] event generator, which incorporates the UrQMD model [34] to simulate the hadronic phase, predicts a significant suppression of the Λ(1520)/Λ yield ratio in central Pb–Pb collisions at√sNN = 2.76 TeV [35]. However, the corresponding Pb–Pb
measurements show a stronger suppression than predicted by EPOS3. This motivates the study of the Λ(1520) resonance in different collision systems at the LHC in order to better understand the properties of the hadronic phase. The pp and p–Pb data studied in this paper thus provide important baseline measurements for the corresponding results in Pb–Pb collisions.
In addition, several measurements [36–38] in p–A collisions indicate that these systems cannot be ex-plained as an incoherent superposition of pp collisions, rather suggesting [39, 40] the presence of collec-tive effects. In p–Pb collisions, a significant increase of the average transverse momentum as a function of charged particle density has been observed [41] and this is reminiscent of the effect observed in Pb–Pb collisions, where it is interpreted as a consequence of radial flow. The measurement of the pT spectra
properties of the collective radial expansion.
Recently, the ALICE Collaboration reported measurements of multi-strange particles in p–Pb colli-sions [42]. The hyperon-to-pion ratios increase with multiplicity in p–Pb collicolli-sions, and range from the values measured in pp to the those in Pb–Pb collisions. The rate of the increase is more pronounced for particles with higher strangeness content. Therefore, it will be interesting to study the production of excited strange hadrons, like Λ(1520), Ξ(1530), as a function of multiplicity. Doing so in p–Pb collisions would help bridge the gap between the pp and Pb–Pb collision systems.
Throughout this paper, the Λ(1520) resonance will be referred as Λ∗. The invariant mass of Λ∗ is re-constructed through its hadronic decay channel Λ∗→ pK−, with a branching ratio of BR = (22.5 ± 1)% [28]. The invariant mass distributions of the pK− and pK+ were combined to reduce the statistical uncertainties. Therefore in this paper, unless specified, Λ∗denotes Λ∗+Λ∗. The paper is organized as fol-lows. The experimental setup is briefly presented in Section 2. Section 3 describes the data samples and event selection. Section 4 illustrates the analysis procedure as well the determination of the systematic uncertainties. The results are discussed in Section 5, and a summary is provided in Section 6.
2 Experimental setup
The ALICE [43, 44] detector is specifically designed to study a variety of observables in the high-multiplicity environment achieved in central A–A collisions at LHC energies. The detector is optimized to reconstruct and identify particles produced in the collisions over a wide momentum range.
In this analysis, only the central barrel sub-detectors were used for track reconstruction. These detectors have a common pseudorapidity coverage in the laboratory frame of |ηlab| < 0.9, and are placed in a
solenoidal 0.5 T magnetic field directed along the beam axis. The Inner Tracking System (ITS) [45] provides high resolution tracking points close to the beam line. The ITS is composed of six cylindrical layers of silicon detectors, located at radial distances between 3.9 and 43 cm from the beam axis. The two innermost layers are Silicon Pixel Detectors (SPD), the two intermediate ones are Silicon Drift Detectors (SDD), and the two outermost ones are Silicon Strip Detectors (SSD). The Time Projection Chamber (TPC) [46] is the main tracking detector of the central barrel. The TPC is a cylindrical drift chamber, and covers the radial distance 85 < r < 247 cm. In addition to tracking, the TPC is used for the identification of particles via their specific ionization energy loss dE/dx as they pass through the active gas region of the TPC. The separation power of particle identification in the TPC defined in terms of standard deviations as a function of particle momentum is discussed in [44]. This analysis uses charged tracks, which are reconstructed using tracking information, both in the ITS and in the TPC. The Time-Of-Flight (TOF) detector [47] is an array of Multi-gap Resistive Plate Chambers (MRPC). The time resolution of TOF is about 85 ps, increasing to about 120 ps due to a worse start-time (collision-time) resolution in the case of low multiplicity events [44]. The TOF is located at a radial distance of 370 < r < 399 cm from the beam axis. The purpose of this detector is to identify particles using the time-of-flight, together with the momentum and path length measured with the ITS and the TPC. The TOF can separate pions from kaons and protons by twice its resolution, for momenta up to 2.5 and 4 GeV/c, respectively.
Forward detectors, such as the V0, T0, and Zero-Degree Calorimeters (ZDC) [48–50], are used for triggering and event characterization. The V0 consists of two arrays of 32 scintillator detectors. They cover the full azimuthal angle in the pseudorapidity regions 2.8 < ηlab< 5.1 (V0A) and −3.7 < ηlab<
−1.7 (V0C). The V0 can be used to define the event multiplicity interval. The T0 consists of two arrays of quartz Cherenkov counters, T0A (4.6 < η < 4.9) and T0C (−3.3 < η < −3.0), and provides the time and the longitudinal position of the interaction. The ZDC is a hadronic calorimeter consisting of two W-quartz neutron and two brass-quartz proton calorimeters, placed symmetrically at a distance of 113 m on both sides of the interaction point. In this analysis the ZDC is used for background rejection.
3 Data sample and event selection
The data samples analysed in this paper were recorded during the LHC pp run in 2010, and the p–Pb run in 2013. For pp collisions, the center-of-mass energy is 7 TeV and the analysis is carried out within the rapidity range −0.5 < y < 0.5. The instantaneous luminosity at the ALICE interaction point was in the range 0.6–1.2×1029cm−2s−1. This limited the collision pile-up probability to an average rate of 2.5% [51]. For p–Pb collisions at√sNN= 5.02 TeV, the beam energies are 4 TeV for protons, and 1.577 TeV for Pb. For the analyzed data set, the Pb beam was circulated towards the positive rapidity direction (labelled as ALICE “A” side); conversely, the proton beam was circulated towards negative rapidity direction (labelled as ALICE “C” side). The asymmetry in the energies of the proton and Pb beam shifts the nucleon–nucleon centre-of-mass system, relative to the laboratory frame, by 0.465 units of rapidity along the proton beam direction. In the following, the variables ylab(ηlab) are used to indicate the rapidity
(pseudorapidity) in the laboratory reference frame, whereas y (η) denotes the same in the center-of-mass frame. The analysis presented in this paper was performed in the rapidity window −0.5 < y < 0. The peak luminosity during data taking was about 1029 cm−2s−1 with a probability of multiple interactions below 3% [52]. The small fraction of pile-up events from the same bunch crossing was removed by rejecting events with multiple vertices using the SPD. Pile-up of collisions from different bunch crossings is negligible due to the bunch-crossing spacing (200 ns) being larger than the integration time of the ZDC. The pp collision data were collected using a minimum-bias (MB) trigger. This trigger required a signal in the SPD or in any one of the V0 scintillator arrays in coincidence with a bunch crossing. With this configuration about 85% of all inelastic events were triggered [53]. The V0 detector measures the event time with a resolution of about 1 ns. Using the timing information from the V0 detector, the contamination due to beam-induced background is removed offline. Selected events are further required to have a reconstructed primary vertex within ± 10 cm from the center of the ALICE detector, along the beam axis to ensure a symmetric rapidity coverage of the barrel detectors, and to reduce the remaining beam-gas contamination. The data analysis is carried out using a sample of ∼125 million minimum-bias pp collisions.
In the p–Pb data sample, the events were selected using the trigger condition requiring a logical AND between signals in V0A and V0C. This reduces the contamination from single-diffractive and electro-magnetic interactions. These non-single-diffractive (NSD) events include double-diffractive interactions, where both colliding nucleons break up by producing particles separated by a large rapidity gap. The trigger and event selection efficiency for NSD events is εNSD= 99.2% as described in Ref. [13, 14]. The
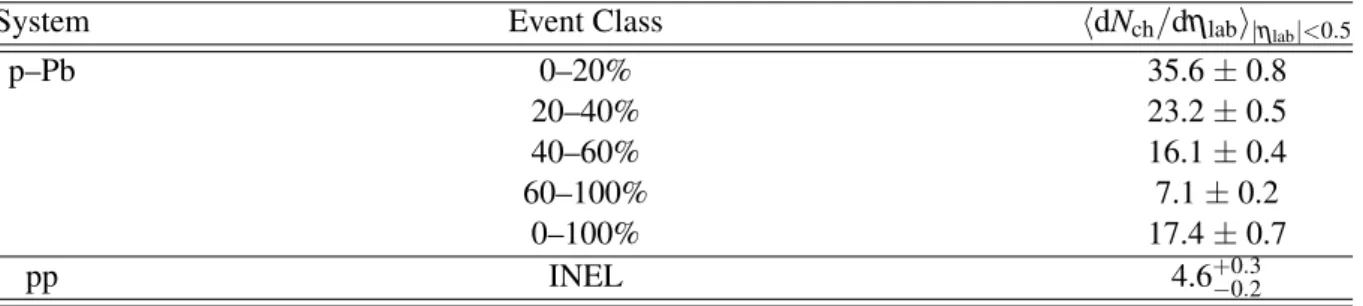
beam induced background was further reduced offline using timing cuts on the signals from the V0 and ZDC detectors [44]. The same procedure as in pp collisions was used to reconstruct the primary vertex. The event sample amounts to a total of about 100 million accepted events. The NSD events were further divided into four multiplicity intervals according to the charge deposited in the forward V0A detector, positioned along the direction of the Pb beam [14]. The multiplicity intervals and their corresponding mean charged-particle density (hdNch/dηlabi) measured at midrapidity (|ηlab| < 0.5) are given in Table 1.
4 Analysis details
4.1 Track cuts and particle identification
This analysis uses tracks reconstructed in the TPC and ITS. Each track is required to have at least one hit in one of the two layers of the SPD. The criteria for selecting a reconstructed track in the TPC are the following: the track is required to cross at least 70, out of the maximum 159, horizontal readout segments (or “rows”) along the transverse plane of the TPC; and the ratio of crossed rows over findable clusters in the TPC has to be greater than 0.8. In addition to this, standard ALICE track quality cuts have been applied [24]. These selections limit the contamination from secondary and fake tracks, while ensuring a high efficiency, and good dE/dx resolution. Tracks with transverse momentum pT< 0.15 GeV/c and
Table 1: Average charged-particle multiplicity density measured at midrapidity in the used event multiplicity intervals in p–Pb collisions at √sNN = 5.02 TeV [14] and in inelastic pp collisions at √
s= 7 TeV [53].
System Event Class hdNch/dηlabi|ηlab|<0.5
p–Pb 0–20% 35.6 ± 0.8 20–40% 23.2 ± 0.5 40–60% 16.1 ± 0.4 60–100% 7.1 ± 0.2 0–100% 17.4 ± 0.7 pp INEL 4.6+0.3−0.2
|ηlab| > 0.8 are rejected to suppress boundary effects. Due to the small lifetime of Λ∗, the daughter
particles should be reconstructed as primary tracks originating from the event vertex. For this purpose, we used distance of closest approach (DCA) cuts, along the transverse and z directions of 7σDCA(pT)
and 2 cm, respectively. Here, σDCA is pT-dependent and parameterized as 0.0015 + 0.005/p1.1T [44],
where pT is measured in units of GeV/c. The methods used for charged particle identification (PID) in
pp and p–Pb collisions are as follows. In pp collisions, low momentum protons (p < 1.1 GeV/c) and K (p < 0.6 GeV/c) are selected using the TPC with a 3σTPCPID cut on the measured dE/dx distribution.
Higher momentum tracks are identified by requiring that the measured time-of-flight and dE/dx do not deviate from their expected values for each given mass hypothesis by more than 3σTOF and 5σTPC,
respectively (see [51, 54] for a discussion of the particle identification using TPC and TOF). For p–Pb collisions, tracks of any momentum that have a hit in the active TOF region are identified with a 3σTOF
and 5σTPC cut, on the measured time-of-flight and dE/dx values. If there is no hit in the active TOF
region, the dE/dx of low momentum (defined earlier) tracks are required to be within 3σTPC of their
expected values for each given mass hypothesis. This PID selection reduces the misidentification of particles over a large momentum region, hence reducing the combinatorial background under the signal peak. The rapidity cuts for pK pairs in pp and p–Pb collisions are |y| < 0.5 and −0.5 < y < 0, respectively. 4.2 Invariant mass reconstruction
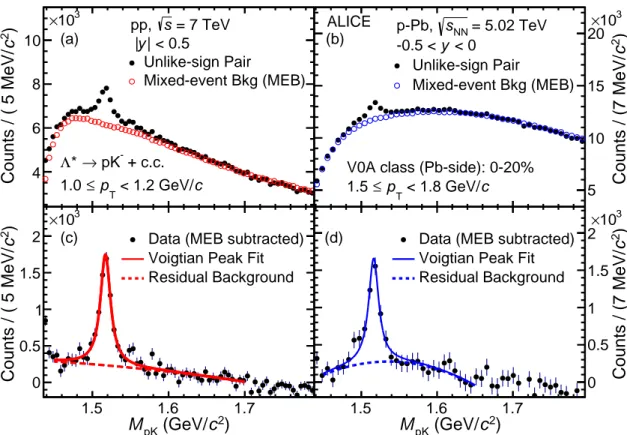
Invariant mass distributions are reconstructed by combining pairs of oppositely charged pK pairs in the same event. Examples of pK invariant-mass distributions are presented in the panels (a) and (b) of Fig. 1 for pp and p–Pb collisions, respectively. Clear peaks of Λ∗ can be observed in the figures, which sit on top of combinatorial backgrounds. The uncorrelated background is estimated using the mixed-event technique (ME). However at low momentum, pT< 1 GeV/c ( 1.2 GeV/c) for pp (p–Pb) collisions, the
like-sign technique (LS) was used since it better described the background shape. In the ME approach, each proton track in an event was combined with kaon tracks from 10 different events. In order to minimize distortions, and to ensure a similar event structure, events with vertex position differences within 1 cm in the z direction and charged-particle multiplicity differences within 10 have been chosen for mixing. For the LS method, the background is constructed by combining like-charged pairs of pK (pK+ and pK−) from the same event to get the geometrical mean of the two distributions, 2pNpK+× NpK−
in each invariant mass bin. These background distributions are normalized in the mass region 1.7 < MpK < 1.85 GeV/c2 well outside the signal peak. The background-subtracted distributions are shown in the panels (c) and (d) of Fig. 1 for MB pp collisions, and the 0–20% multiplicity interval of p–Pb collisions, respectively. These distributions exhibit characteristic peaks on top of residual backgrounds. These leftover backgrounds are mainly due to correlated pairs from jets, multi-body decays of heavier particles or correlated pairs from real resonance decays, misidentified as p or K during PID selection. A study of Monte Carlo simulations was performed to ensure that the shape of the correlated background is a smooth function of mass which can be well described with a second order polynomial in the fitting range. Each signal peak has been fitted with a Voigtian function (convolution of a Breit-Wigner and a
) 2 c (GeV/ pK M 1.5 1.6 1.7 ) 2 c Counts / ( 5 MeV/ 4 6 8 10 3 10 × pp, s = 7 TeV | < 0.5 y | Unlike-sign Pair Mixed-event Bkg (MEB) + c.c. pK → * Λ c < 1.2 GeV/ T p ≤ 1.0 (a) ) 2 c (GeV/ pK M 1.5 1.6 1.7 ) 2 c Counts / ( 5 MeV/ 0 0.5 1 1.5 2 3 10 ×
Data (MEB subtracted) Voigtian Peak Fit Residual Background (c) MpK (GeV/c2) 1.5 1.6 1.7 ) 2 c Counts / (7 MeV/ 5 10 15 20 3 10 × = 5.02 TeV NN s p-Pb, < 0 y -0.5 < Unlike-sign Pair Mixed-event Bkg (MEB) ALICE (b)
V0A class (Pb-side): 0-20%
c < 1.8 GeV/ T p ≤ 1.5 ) 2 c (GeV/ pK M 1.5 1.6 1.7 ) 2 c Counts / (7 MeV/ 0 0.5 1 1.5 2 3 10 ×
Data (MEB subtracted) Voigtian Peak Fit Residual Background (d)
Figure 1: Invariant-mass distributions of pK pairs for MB pp collisions at√s= 7 TeV (left panels) and for p–Pb collisions in the 0–20% multiplicity interval at√sNN= 5.02 TeV (right panels) for the
momen-tum interval 1.0 ≤ pT< 1.2 GeV/c and 1.5 ≤ pT< 1.8 GeV/c, respectively. Panels (a) and (b) show
the unlike-sign pK invariant-mass distribution from the same event and normalized combinatorial back-ground for pp and p–Pb collisions, respectively. Panels (c) and (d) show the invariant-mass distribution after subtraction of the combinatorial background. The solid curve represents the Voigtian fit, while the dashed line describes the residual background. The statistical uncertainties are shown as bars.
Gaussian) on top of a second order polynomial in invariant mass as in [55]. This is shown in the lower panels of Fig. 1. The polynomial is used to describe the residual background and the Voigtian function gives the resonance mass, width and yield. The Gaussian component of the Voigtian function accounts for the mass resolution of the experimental setup. A study of Monte Carlo simulations was done to estimate this mass resolution.
The mass resolution was found to depend on pT. At low pT it shows a decreasing trend and reaches its
lowest value of 1 MeV/c2at pT= 1 GeV/c, then monotonically increases to a value of 1.6 MeV/c2at pT
= 6 GeV/c. It is important to note that the mass resolution has very limited effect on the reconstructed peak shape due to large intrinsic width of the Λ∗ resonance (Γ = 15.73 MeV/c2) [28]. The raw yield is calculated by integrating the invariant mass distribution after the subtraction of the combinatorial background and subtracting the integral of the residual background function in the range (M − 2Γ, M + 2Γ), where M is the mass peak position that comes from the Voigtian fit and Γ is the PDG accepted value for the width of Λ∗. The fractions of the yields in the tails on both sides of the peak are calculated from the fit function and applied as corrections to the measured yields.
4.3 Detector acceptance and efficiency
In order to evaluate the detector acceptance and reconstruction efficiency (A × ε), Monte Carlo pp and p–Pb events were simulated using the PYTHIA Perugia 2011 [56] and DPMJET 3.05 [57] event
genera-tors, respectively. The detector geometry and material budget were modeled by GEANT3 [58], which is also used for the propagation of particles through detector material. The acceptance and efficiency cor-rections were determined as the fractions of generated resonances that were reconstructed in the rapidity interval |y| < 0.5 for pp events and −0.5 < y < 0 for p–Pb events. The selected primary p and K tracks have to pass the same kinematic, track selection, and PID cuts as applied in the real data. Since the gen-erated Λ∗ pT spectrum has a different shape than the measured pT spectrum, it is therefore necessary to
weight the generated pTspectrum so that it has the shape of the measured spectrum. The A × ε obtained
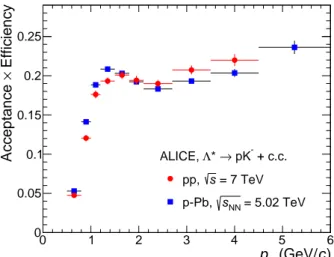
after applying this re-weighting procedure is used to correct the raw pTspectrum. Fig. 2 shows the A × ε
as a function of pT for minimum bias events in pp and in p–Pb collisions. The drop in efficiency is
seen at intermediate pT that arises due to the rejection of protons above p > 1.1 GeV/c and kaons above
p> 0.6 GeV/c when PID information is only available from the TPC. Since no significant variation of A× ε with event multiplicity was observed in p–Pb collisions, the A × ε obtained in MB events was used for all multiplicity intervals to have a better statistical precision.
) c (GeV/ T p 0 1 2 3 4 5 6 Efficiency × Acceptance 0 0.05 0.1 0.15 0.2 0.25 + c.c. pK → * Λ ALICE, = 7 TeV s pp, = 5.02 TeV NN s p-Pb,
Figure 2: The geometrical acceptances times reconstruction efficiency (A × ε) for Λ∗in minimum bias pp and p–Pb events. Uncertainties (bars) are statistical only.
4.4 Correction and normalization
The final pTspectra were calculated from the raw yields as
1 Nevt d2N dydpT = 1 Nevttrig Nraw(pT) ∆y ∆ pT εtrig A× ε(pT) BR εvert εsig εG/F(pT) . (1)
The raw yields (Nraw) were corrected for A × ε of the detectors, branching ratio (BR) of the decay channel, the trigger efficiency (εtrig), GEANT3/FLUKA correction (εG/F), signal loss correction (εsig)
and event loss correction due to the vertex reconstruction inefficiency (εvert). A GEANT3-based [58]
simulation of the ALICE detector response was used to correct the yields for both collision systems. The GEANT3 version used for correcting the yields from pp data overestimates the interactions of p and K− with the material, especially at low pT. Therefore the efficiency is scaled by a factor εG/F,
estimated with a dedicated FLUKA simulation [59, 60]. In pp collisions, the yields are normalized to the number of inelastic collisions by applying a trigger efficiency correction (εtrig) of 0.85+0.06−0.03[53] to the
total number of triggered events (Nevttrig). The correction due to vertex reconstruction inefficiency (εvert)
in pp collision is negligible (∼0.1%) and hence not applied. For MB p–Pb collisions, the yields are normalized to the number of non-single diffractive (NSD) events after applying the correction factors of εtrigfor event selection and εvertdue to the primary vertex reconstruction inefficiency, resulting in a total
scaling factor of 0.964 [24]. For the multiplicity dependent study of Λ∗, the yields are normalized to the number of events in the respective V0A multiplicity event class. Only events with a reconstructed primary vertex were considered in the computation of A × ε. Therefore, a correction for the vertex reconstruction inefficiency (εvert) has to be applied in each V0A multiplicity event class. The correction
is about 0.95 for the 60–100% multiplicity interval and is unity for other multiplicity intervals. The signal loss correction, εsigis measured as a function of pTand it corresponds to the resonances that are
not reconstructed in the events missing due to the trigger selection. This correction is significant (of the order of few %) at low pT (< 2 GeV/c) in the lowest multiplicity interval for p–Pb collisions and in pp
collisions. The values of εsig(pT) are negligible for other multiplicity intervals in p–Pb collisions.
4.5 Sources of systematic uncertainties
The systematic uncertainties of the Λ∗yields are summarized in Table 2. The main sources of systematic uncertainty are signal extraction, track selection cuts, PID selection cuts, global tracking efficiency, the material thickness traversed by the particles (material budget) and the hadronic interaction cross-section in the detector material. No event multiplicity dependence of systematic effects was observed in p–Pb data, thus the uncertainties estimated for minimum bias collisions were used for all multiplicity intervals. One of the main sources of systematic uncertainties is the raw yield extraction procedure. This contri-bution is labelled as “Signal extraction” and accounts for uncertainties mainly due to the choice of the background normalization region, the fitting range, the residual background shape and variation of the mass resolution in the fitting function. The normalization ranges have been varied between 1.7 GeV/c2 and 2.2 GeV/c2. The lower mass limit of the fitting range was varied within ±20 MeV/c2 while the higher mass limit was varied within ±100 MeV/c2about the default fitting range of 1.45–1.65 GeV/c2. A second order polynomial is used as the default function to describe the residual background and a third order polynomial is used to estimate the systematic uncertainty. The mass resolution was varied within the range of uncertainties observed in the simulation. Track selection uncertainties were estimated to be 2% for a single charged track in [13, 51] and therefore correspond to a 4% uncertainty for Λ∗ decay-ing into two daughter particles. In order to study the effect of the PID selection on signal extraction, the cuts on the TPC dE/dx and TOF time-of-flight values were varied by 1σ . This results in average uncertainties in the yields of 1.8% and 2.1% for pp and p–Pb collisions, respectively. The uncertainty on the determination of the global tracking efficiency (ITS-TPC matching uncertainty) is independent of pT and was evaluated to be 3% for a single charged particle [13, 51], which results in a 6% uncertainty
when two tracks are combined in the invariant-mass analysis. The systematic uncertainties in the Λ∗ Table 2: Sources of systematic uncertainties for Λ∗ yields (d2N/(dydpT)). For each source the average
relative uncertainties are listed.
Source p–Pb,√sNN= 5.02 TeV pp,
√
s= 7 TeV
Signal extraction 5.0% 4.0%
Track selection cuts 4.0% 4.0%
Particle identification 1.8% 2.1%
Global tracking efficiency 6.0% 6.0%
Material budget 1.5% (pT< 3.5 GeV/c) 1.4% (pT< 3.5 GeV/c)
Hadronic interaction 3.3% (pT< 3.5 GeV/c) 3.0% (pT< 3.5 GeV/c)
Total 9.7% 9.1%
yield due to the material budget and hadronic interaction cross section in the detector material have been found to be constant up to pT= 3.5 GeV/c and negligible at higher pT. The uncertainties due to signal
extraction and PID are uncorrelated with pT, whereas the global tracking, track cuts, material budget
and hadronic cross-section uncertainties are correlated with pT. These pT-correlated uncertainties cancel
5 Results and discussion
This section presents the results obtained for the Λ∗, which include the pT-differential spectra, integrated
yields (dN/dy) and mean transverse momentum (hpTi) values in MB pp collisions at
√
s= 7 TeV and p–Pb collisions at√sNN = 5.02 TeV in the NSD event class and different multiplicity intervals. This
section also describes a study of the radial flow effect in p–Pb collisions for the Λ∗ pT-spectra. The
results are also used to study strangeness enhancement as a function of the charged-particle multiplicity at mid-pseudorapidity.
5.1 Transverse momentum spectra
The pTspectra of Λ∗measured in the rapidity range |y| < 0.5 in inelastic pp collisions and −0.5 < y < 0
in p–Pb collisions for various event classes are shown in Fig. 3. The Lévy-Tsallis parameterization [61]
)
c
(GeV/
Tp
0 1 2 3 4 5 6 7]
-1)
c
) [(GeV/
Tp
d
y
/(d
N
2) d
evtN
(1/
5 − 10 4 − 10 3 − 10 2 − 10 1 − 10 1 10Uncertainties: stat. (bar), syst. (box) ALICE (1520) Λ < 0 y = 5.02 TeV, -0.5 < NN s p-Pb, NSD (x8) 0-20% (x1) 20-40% (x1/2) 40-60% (x1/4) 60-100% (x1/8) | < 0.5 y = 7 TeV, | s pp, pp (INEL) (x1/16) vy-Tsallis fit e L
Figure 3: (Color online) pT spectra of Λ∗ measured with ALICE in the rapidity range |y| < 0.5 in pp
collisions at√s= 7 TeV and in the rapidity range −0.5 < y < 0 in p–Pb collisions at√sNN= 5.02 TeV for minimum bias and different multiplicity intervals (V0A estimator). The multiplicity-dependent spec-tra are normalized to the visible cross-section, whereas the minimum bias spectrum is normalized to the fraction of NSD events. The minimum bias spectrum in pp collisions is normalized to the number of in-elastic events. Statistical and systematic uncertainties (pT-uncorrelated) are indicated as bars and boxes,
respectively. Dashed lines represent Lévy-Tsallis fits.
is used to fit the pT-differential spectra, d2N/(dpTdy). The function provides a good description of the
measured points over the whole pTrange with a χ2/ndf less than 1. The fits are used to extrapolate the
spectra down to zero pT and to high pT (up to 10 GeV/c). The dN/dy and hpTi are obtained from the
spectra in the measured ranges and from the fits at lower and higher momenta. The pT-correlated
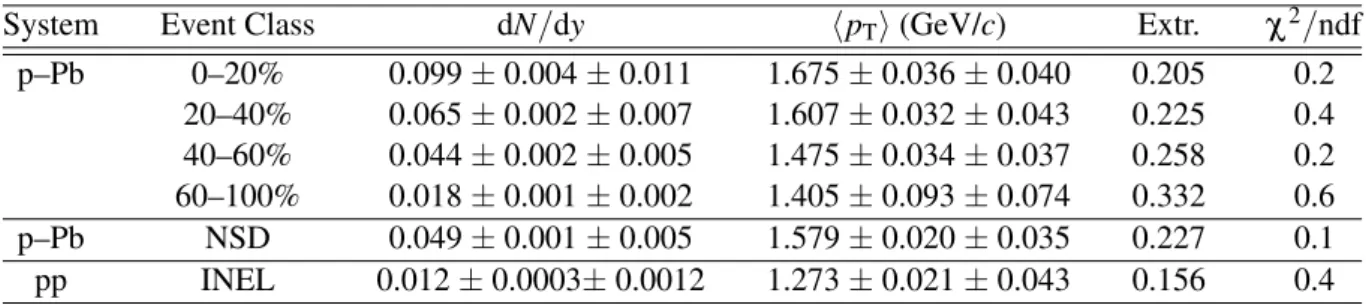
uncer-tainties are not considered for fitting, but propagated separately to the final results. Table 3 reports dN/dy and hpTi for Λ∗along with the extrapolation fraction and χ2/ndf values obtained from the fits. The first
uncertainty is statistical and the second one is the total systematic uncertainty. The extrapolation fraction in p–Pb collisions varies from 20% in the 0–20% multiplicity interval to 33% in the 60–100% multi-plicity interval; in pp collisions it is below 16%. The systematic uncertainties on dN/dy are dominated
Table 3: dN/dy and hpTi along with the extrapolation fraction (Extr.) and χ2/ndf from the fit to the pT
distribution. The values included in the table correspond to four multiplicity intervals (V0 estimator) and NSD events of p–Pb collisions at√sNN= 5.02 TeV and inelastic pp collisions at
√
s= 7 TeV. The first uncertainty is the statistical and the second one is the total systematic uncertainty.
System Event Class dN/dy hpTi (GeV/c) Extr. χ2/ndf
p–Pb 0–20% 0.099 ± 0.004 ± 0.011 1.675 ± 0.036 ± 0.040 0.205 0.2 20–40% 0.065 ± 0.002 ± 0.007 1.607 ± 0.032 ± 0.043 0.225 0.4 40–60% 0.044 ± 0.002 ± 0.005 1.475 ± 0.034 ± 0.037 0.258 0.2 60–100% 0.018 ± 0.001 ± 0.002 1.405 ± 0.093 ± 0.074 0.332 0.6 p–Pb NSD 0.049 ± 0.001 ± 0.005 1.579 ± 0.020 ± 0.035 0.227 0.1 pp INEL 0.012 ± 0.0003± 0.0012 1.273 ± 0.021 ± 0.043 0.156 0.4
by the pT-uncorrelated uncertainties of the measured spectra (about 7.6% in p–Pb and 6.4% in pp), the
pT-correlated contributions from the global tracking efficiency (6% both in pp and p–Pb) [13, 51] and the
extrapolation of the yield (2.1–2.9% in p–Pb and 2.0% in pp). The uncertainties due to the extrapolation of the yields are calculated using different functions: Blast-Wave [62], mT-exponential, Boltzmann and
Fermi-Dirac functions [63] and the standard deviation of the dN/dy values calculated using these func-tions is used as the systematic uncertainty. Similarly, the major contributors to the systematic uncertainty of hpTi are the pT-uncorrelated systematic uncertainties on the measured pT-differential yields (about
2.6% in p–Pb and 2.3% in pp) and the standard deviation of the hpTi values calculated using the different
extrapolation functions. The pT-correlated uncertainties are not included in the hpTi as the correlated
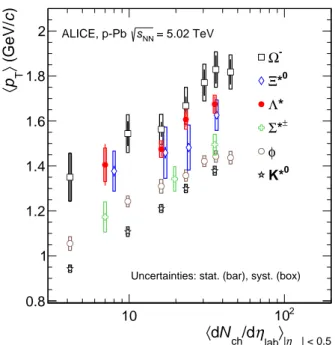
uncertainties act as the normalization constant and do not affect the spectral shape. 5.2 Average transverse momentum and mass ordering
In high-energy heavy-ion collisions, the expansion velocity of the medium drives the spectral shapes of final-state particles. If an increase in hpTi with the mean charged-particle multiplicity density is observed
for different particles, then it may suggest collective (hydrodynamic) behavior of the system [41, 59]. Figure 4 shows the hpTi of different particle species as a function of the mean charged-particle
mul-tiplicity density hdNch/dηlabi within |ηlab| < 0.5. The values for the Λ∗ are compared with those of
other hyperons and mesons observed in p–Pb collisions at√sNN= 5.02 TeV; such as K∗0, φ , Σ∗±, Ξ∗0,
Ω− [24, 42, 64]. An increasing trend of hpTi from low to high multiplicity is observed for all
parti-cles. This enhancement in hpTi of the Λ∗is consistent, within uncertainties, with that observed for other
hadrons as shown in the figure. The change of the hpTi for the K∗0meson is the largest, which may be due
to the suppression of low pTparticles due to re-scattering in the hadronic medium for the higher
multi-plicity intervals. A mass ordering of hpTi is observed among light-flavor baryons, including the Λ∗. This
mass hierarchy including other light flavored hadrons is shown in Fig. 5. The figure shows the hpTi of
several hadron species as a function of mass for inelastic pp collisions at√s= 7 TeV [51, 55, 65] and for the 0–20% multiplicity interval of p–Pb collisions at√sNN= 5.02 TeV [41, 42, 64]. The hpTi increases
with increasing mass in both collision systems. The baryonic resonance Λ∗follows the same trend as the other baryons. We observe two different trends in the hpTi for mesons and baryons. These results reflect
the violation of mass ordering in the hpTi of the produced particles in pp and p–Pb collisions.
5.3 Collective radial expansion
In heavy-ion collisions, the flattening of transverse momentum distributions of hadrons and their hpTi
ordering with mass is explained by the collective radial expansion of the system [66]. Previously, the Blast-Wave formalism [62] successfully described simultaneously the π±, K±, K0S, p(p) and Λ(Λ) spectra in different multiplicity intervals of p–Pb collisions [41]. The pT ranges for the simultaneous fit of π±,
| < 0.5 lab η | 〉 lab η /d ch N d 〈 10 102 ) c (GeV/ 〉 T p 〈 0.8 1 1.2 1.4 1.6 1.8 2 -Ω 0 * Ξ * Λ ± * Σ φ 0 K* = 5.02 TeV NN s ALICE, p-Pb
Uncertainties: stat. (bar), syst. (box)
Figure 4: (Color online) The hpTi of Λ∗ compared with previously measured hpTi values of K∗0, φ ,
Σ∗±, Ξ∗0 and Ω− in p–Pb collisions at √sNN = 5.02 TeV as a function of the mean charged-particle
multiplicity density hdNch/dηlabi, measured in the pseudorapidity range |ηlab| < 0.5 [24, 42, 64]. The
Ξ∗0points are slightly displaced along the abscissa for clarity. Statistical uncertainties are represented as bars, whereas boxes indicate systematic uncertainties.
) 2 c (GeV/ M 0 0.2 0.4 0.6 0.8 1 1.2 1.4 1.6 1.8 ) c (GeV/ 〉 T p 〈 0 0.2 0.4 0.6 0.8 1 1.2 1.4 1.6 1.8 2 p-Pb 5.02 TeV (0-20%) pp 7 TeV (INEL) ± π K±S 0 K 0 K* p Λ φ -Ξ ± * Σ * Λ 0 * Ξ -Ω
Uncertainties: stat.(bar), syst.(square bracket)
ALICE
Figure 5: Mass dependence of the hpTi of identified particles measured in inelastic pp collisions at
√
s= 7 TeV [51, 55, 65] and in p–Pb collisions at√sNN = 5.02 TeV for the 0–20% multiplicity
inter-vals [41, 42, 64]. Statistical uncertainties are represented as bars, square brackets indicate total systematic uncertainties.
respectively. The Blast-Wave model is not expected to be valid at high pT. Here we have used the same
Blast-Wave parameters as extracted in Ref. [41] to obtain a prediction for the pT spectra of the Λ∗.
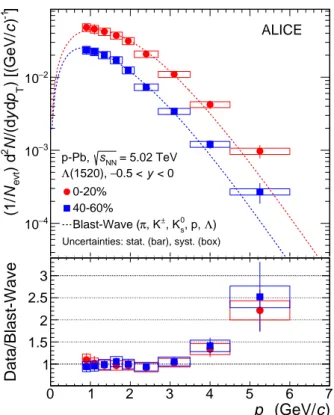
The parameters are listed in Table 4. The predicted Blast-Wave shapes are normalized to the data in a momentum range up to 3 GeV/c in the 0–20% and 40–60% multiplicity intervals. The results are shown in the upper panel of Fig. 6. The lower panel of the same figure shows the ratio of the measured data points and the corresponding values from the functions. This shows that the Blast-Wave function describes the shape of the Λ∗ spectra well up to pT = 3.5 GeV/c. Although the Blast-Wave function
) c (GeV/ T p 0 1 2 3 4 5 6 7 ] -1 ) c ) [(GeV/ T p d y /(d N 2 ) d evt N (1/ 4 − 10 3 − 10 2 − 10 0-20% 40-60% ) Λ , p, 0 s , K ± , K π Blast-Wave ( < 0 y 0.5 < − (1520), Λ = 5.02 TeV NN s p-Pb, ALICE
Uncertainties: stat. (bar), syst. (box)
) c (GeV/ T p 0 1 2 3 4 5 6 7 Data/Blast-Wave 1 1.5 2 2.5 3
Figure 6: (Color online) The upper panel shows the pT distribution of Λ∗ in p–Pb collisions at
√
sNN= 5.02 TeV in the 0–20% (red) and 40–60% (blue) multiplicity intervals. The dashed curves
represent predictions from the Blast-Wave model [41], where the parameters are obtained from simul-taneous fits to π±, K±, K0S, p(p) and Λ(Λ) pT spectra and the shapes are normalized to the data. The
lower panel shows the ratios of the measured distributions to the values from the respective Blast-Wave functions. The statistical uncertainties are shown as bars and the systematic uncertainties are shown as boxes.
Table 4: Blast wave parameters from fits to π±, K±, K0S, p(p) and Λ(Λ) pTspectra in p–Pb collisions at
√
sNN= 5.02 TeV [41].
Centrality Tkin(GeV) βs n
0–20% 0.147 ± 0.005 0.833 ± 0.0095 1.16 ± 0.035
40–60% 0.164 ± 0.004 0.435 ± 0.011 1.73 ± 0.07
underpredicts the pT-differential yields at high pT, the ratio of the measurement to the function is found
to be independent of event multiplicity in the measured region. This suggests that (1) the Λ∗ pTspectra
agree with the Blast-Wave shape constrained by other light hadrons (at least in the pT range where the
Blast-Wave model is expected to work); and (2) the Λ∗ participates in the same collective radial flow as the other light hadrons. The measurements for the Λ∗are also consistent with an increase of radial flow with multiplicity. It may be noted that the Λ∗ spectral shape and hpTi were also found to be consistent
with a hydrodynamic evolution in Pb–Pb collisions at√sNN= 2.76 TeV [30].
5.4 Ratios of integrated yields
The ratios of the yields of particles with varying strangeness content, mass and lifetime are key observ-ables in the study of particle production mechanisms. Short-lived particles such as Λ∗, Ξ∗0, K∗0 and φ are used to extract information on the lifetime of the hadronic phase in heavy-ion collisions and on mech-anisms, such as re-scattering and regeneration, which affect resonance yields before kinetic freeze-out
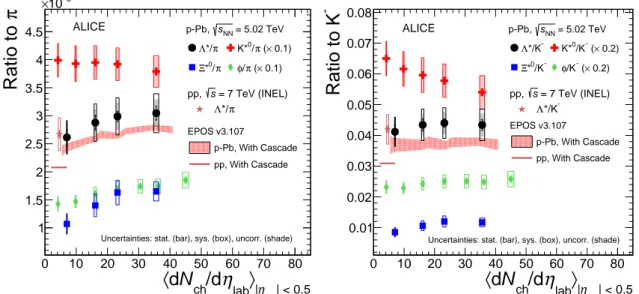
(when the constituents of the system cease to interact elastically). In Fig. 7, the yield ratios of resonances | < 0.5 lab η |
〉
labη
/d
chN
d
〈
0 10 20 30 40 50 60 70 80π
Ratio to
1 1.5 2 2.5 3 3.5 4 4.5 3 − 10 × EPOS v3.107 p-Pb, With Cascade pp, With Cascade = 5.02 TeV NN s p-Pb, π */ Λ K*0/π (× 0.1) π / 0 * Ξ φ/π (× 0.1) = 7 TeV (INEL) s pp, π */ ΛUncertainties: stat. (bar), sys. (box), uncorr. (shade)
ALICE | < 0.5 lab η |
〉
labη
/d
chN
d
〈
0 10 20 30 40 50 60 70 80-Ratio to K
0.01 0.02 0.03 0.04 0.05 0.06 0.07 0.08 EPOS v3.107 p-Pb, With Cascade pp, With Cascade = 5.02 TeV NN s p-Pb, -*/K Λ K*0/K- (× 0.2) -/K 0 * Ξ φ/K- (× 0.2) = 7 TeV (INEL) s pp, -*/K ΛUncertainties: stat. (bar), sys. (box), uncorr. (shade)
ALICE
Figure 7: (Color online) Ratio of Λ∗, K∗0, Ξ∗0and φ to charged π (left) and K−(right) in p–Pb collisions at √sNN = 5.02 TeV as a function of the average charged-particle density hdNch/dηlabi measured at
midrapidity [24, 64]. Statistical uncertainties (bars) are shown together with total (hollow boxes) and multiplicity-uncorrelated (shaded boxes) systematic uncertainties. The EPOS3 model predictions [31– 35] with statistical uncertainties are shown as horizontal bars (pp collisions at√s= 7 TeV) and shaded bands (p–Pb collisions at√sNN= 5.02 TeV).
to charged π and K− are compared. The yield ratios of strange resonances to the non-strange π show a rise from low to high multiplicities (except for K∗0/π). The Λ∗/π ratio shows a hint of an increase with increasing charged-particle multiplicity, but due to the large uncertainties a strong conclusion can-not be drawn. This enhancement is more prominent for the Ξ∗0/π (the ratio of a doubly strange particle to a non-strange particle) and φ /π ratios. This yield enhancement is typically attributed to a reduced canonical suppression of strangeness production in larger freeze-out volumes [67] or to an enhanced strangeness production in a quark–gluon plasma [68]. In contrast, the K∗0/π ratio shows no enhance-ment. This is connected to the negative slope of the K∗0/K− ratio (see the right panel of Fig. 7) which may hint at the suppression of K∗0 yields due to re-scattering effects in the hadronic medium in p–Pb collisions [24]. The Λ∗/K−ratio shows no change with increasing charged-particle multiplicity and the ratio is consistent with the value measured in pp collisions. Similar behaviour is seen for the φ /K− ratio. The measured ratios are compared with the results from the EPOS3 model (version v3.107) with a hadronic cascade phase (EPOS3 + UrQMD). The EPOS3 event generator is based on a 3+1D viscous hydrodynamical evolution [31–33]. The initial conditions are described by the Gribov-Regge multiple scattering framework. The reaction volume consists of two parts: “core” and “corona”. The core part constitutes the bulk matter simulated using 3+1D viscous hydrodynamics which thermalizes, flows and hadronizes. The corona part constitutes the hadrons from the string decays. These hadrons from core and corona part are fed into UrQMD [34], which includes the rescattering and regeneration effects. For pp collisions, EPOS3 under-predicts the data (horizontal bars), however for p–Pb collisions, EPOS3 agrees with the data (red shaded band) within uncertainties. EPOS3 also predicts a rise in the Λ∗/π ratio with increasing charged-particle multiplicity.
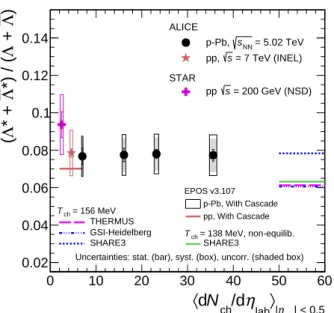
Figure 8 shows the yield ratio of the Λ∗ to the ground state Λ as a function of the average charged-particle density, hdNch/dηlabi, measured at midrapidity. The figure shows the ratio for inelastic pp
collisions at √s = 7 TeV and √s = 200 GeV (STAR Collaboration [23, 69]) and for p–Pb colli-sions at√sNN= 5.02 TeV [41] as a function of charged particle multiplicity. The STAR measurement
in-| < 0.5 lab η | 〉 lab η /d ch N d 〈 0 10 20 30 40 50 60 ) Λ + Λ *) / ( Λ * + Λ ( 0.02 0.04 0.06 0.08 0.1 0.12 0.14 EPOS v3.107 p-Pb, With Cascade pp, With Cascade = 138 MeV, non-equilib. ch T SHARE3 = 156 MeV ch T THERMUS GSI-Heidelberg SHARE3 ALICE = 5.02 TeV NN s p-Pb, = 7 TeV (INEL) s pp, STAR = 200 GeV (NSD) s pp
Uncertainties: stat. (bar), syst. (box), uncorr. (shaded box)
Figure 8: (Color online) Ratio of Λ∗ to Λ in inelastic pp collisions at√s = 7 TeV, p–Pb collisions at √
sNN= 5.02 TeV [41] and in NSD pp collisions at
√
s = 200 GeV [23, 69]. Statistical uncertainties (bars) are shown together with total (hollow boxes) and multiplicity-uncorrelated (shaded boxes) sys-tematic uncertainties. The results are compared with several model calculations (see text for details).
creasing charged-particle multiplicity. This is in contrast to the measurements in Pb–Pb collisions at √
sNN= 2.76 TeV [30] where the Λ∗/Λ ratio is observed to be suppressed in central (0–20%) relative to
peripheral (50–80%) Pb–Pb collisions. The constant behavior of the Λ∗/Λ ratios presented here along with those for Σ∗±/Λ and Ξ∗0/Ξ− ratios reported in [64] as a function of hdNch/dηlabi indicates that
the strangeness enhancement observed in p–Pb collisions depends predominantly on the strangeness content, rather than on the hyperon mass. The Λ∗/Λ ratios in pp and p–Pb collisions reported here are about a factor 2 higher than those measured in central Pb–Pb collisions. THERMUS [70], GSI-Heidelberg [71] and SHARE3 [72] model calculations are able to describe the value of the ratio within 1.5 times the experimental uncertainty. The predictions of the three thermal models are for Pb–Pb col-lisions at the chemical freeze-out temperature (when the constituents of the system cease to interact inelastically) Tch= 156 MeV and zero baryochemical potential. Among these models, SHARE3
(equi-librium) at Tch= 156 MeV provides the best agreement with the data. EPOS3 with UrQMD agrees with
the data qualitatively and indicates that the Λ∗/Λ ratio is independent of the average charged-particle den-sity in p–Pb collisions. This is in contrary to the observation that in central Pb–Pb collisions the Λ∗/Λ ratio is suppressed compared to pp, p–Pb, peripheral (50–80%) Pb–Pb collisions and thermal model cal-culations. The suppression of the Λ∗/Λ ratio is consistent with the formation of a dense hadronic phase and re-scattering effects in central Pb–Pb collisions.
6 Summary and conclusions
The transverse momentum spectra of the Λ∗ in pp collisions at√s= 7 TeV and in p–Pb collisions at √
sNN= 5.02 TeV have been measured using the ALICE detector in the rapidity ranges |y| < 0.5 and −0.5 < y < 0, respectively. The hpTi of this baryonic resonance increases with the mean
charged-particle multiplicity measured at mid-pseudorapidity (|ηlab| < 0.5) and exhibits mass ordering when
compared with other baryons (Σ∗±, Ξ∗0, Ω−etc.). The Λ∗/π ratio may exhibit an enhancement consistent with that observed for other strange hadrons [19]. The Λ∗ pTspectra agree with the Blast-Wave shape
constrained using other light hadrons, which, in the context of this particular model, can be interpreted as the Λ∗ participating in the same collective radial flow as the other light hadrons. The ratio of the Λ∗
to the ground-state Λ shows no change with increasing charged-particle multiplicity in p–Pb collisions. This ratio is consistent with the measurement in pp collisions at √s = 7 TeV and 200 GeV within uncertainties. This measurement may indicate that the cumulative effect from the hadronic phase in p–Pb collisions is not enough to have significant influence on the Λ∗yield.
The current measurements represent a useful baseline for the results in Pb–Pb collisions [30]. The mea-surements of the Λ∗/Λ ratio in pp, p–Pb, and peripheral Pb–Pb collisions indicate that the re-scattering effect plays an important role in central Pb–Pb collisions at√sNN = 2.76 TeV. A complete set of such measurements for many resonances with different lifetimes will allow the properties of the hadronic phase to be studied in more detail.
Acknowledgements
The ALICE Collaboration would like to thank all its engineers and technicians for their invaluable con-tributions to the construction of the experiment and the CERN accelerator teams for the outstanding performance of the LHC complex. The ALICE Collaboration gratefully acknowledges the resources and support provided by all Grid centres and the Worldwide LHC Computing Grid (WLCG) collaboration. The ALICE Collaboration acknowledges the following funding agencies for their support in building and running the ALICE detector: A. I. Alikhanyan National Science Laboratory (Yerevan Physics In-stitute) Foundation (ANSL), State Committee of Science and World Federation of Scientists (WFS), Armenia; Austrian Academy of Sciences, Austrian Science Fund (FWF): [M 2467-N36] and National-stiftung für Forschung, Technologie und Entwicklung, Austria; Ministry of Communications and High Technologies, National Nuclear Research Center, Azerbaijan; Conselho Nacional de Desenvolvimento Científico e Tecnológico (CNPq), Financiadora de Estudos e Projetos (Finep), Fundação de Amparo à Pesquisa do Estado de São Paulo (FAPESP) and Universidade Federal do Rio Grande do Sul (UFRGS), Brazil; Ministry of Education of China (MOEC) , Ministry of Science & Technology of China (MSTC) and National Natural Science Foundation of China (NSFC), China; Ministry of Science and Education and Croatian Science Foundation, Croatia; Centro de Aplicaciones Tecnológicas y Desarrollo Nuclear (CEADEN), Cubaenergía, Cuba; Ministry of Education, Youth and Sports of the Czech Republic, Czech Republic; The Danish Council for Independent Research | Natural Sciences, the Carlsberg Foundation and Danish National Research Foundation (DNRF), Denmark; Helsinki Institute of Physics (HIP), Fin-land; Commissariat à l’Energie Atomique (CEA), Institut National de Physique Nucléaire et de Physique des Particules (IN2P3) and Centre National de la Recherche Scientifique (CNRS) and Région des Pays de la Loire, France; Bundesministerium für Bildung und Forschung (BMBF) and GSI Helmholtzzentrum für Schwerionenforschung GmbH, Germany; General Secretariat for Research and Technology, Ministry of Education, Research and Religions, Greece; National Research, Development and Innovation Office, Hungary; Department of Atomic Energy Government of India (DAE), Department of Science and Tech-nology, Government of India (DST), University Grants Commission, Government of India (UGC) and Council of Scientific and Industrial Research (CSIR), India; Indonesian Institute of Science, Indonesia; Centro Fermi - Museo Storico della Fisica e Centro Studi e Ricerche Enrico Fermi and Istituto Nazionale di Fisica Nucleare (INFN), Italy; Institute for Innovative Science and Technology , Nagasaki Institute of Applied Science (IIST), Japanese Ministry of Education, Culture, Sports, Science and Technology (MEXT) and Japan Society for the Promotion of Science (JSPS) KAKENHI, Japan; Consejo Nacional de Ciencia (CONACYT) y Tecnología, through Fondo de Cooperación Internacional en Ciencia y Tec-nología (FONCICYT) and Dirección General de Asuntos del Personal Academico (DGAPA), Mexico; Nederlandse Organisatie voor Wetenschappelijk Onderzoek (NWO), Netherlands; The Research Coun-cil of Norway, Norway; Commission on Science and Technology for Sustainable Development in the South (COMSATS), Pakistan; Pontificia Universidad Católica del Perú, Peru; Ministry of Science and Higher Education and National Science Centre, Poland; Korea Institute of Science and Technology In-formation and National Research Foundation of Korea (NRF), Republic of Korea; Ministry of Education
and Scientific Research, Institute of Atomic Physics and Ministry of Research and Innovation and Insti-tute of Atomic Physics, Romania; Joint InstiInsti-tute for Nuclear Research (JINR), Ministry of Education and Science of the Russian Federation, National Research Centre Kurchatov Institute, Russian Science Foun-dation and Russian FounFoun-dation for Basic Research, Russia; Ministry of Education, Science, Research and Sport of the Slovak Republic, Slovakia; National Research Foundation of South Africa, South Africa; Swedish Research Council (VR) and Knut & Alice Wallenberg Foundation (KAW), Sweden; European Organization for Nuclear Research, Switzerland; Suranaree University of Technology (SUT), National Science and Technology Development Agency (NSDTA) and Office of the Higher Education Commis-sion under NRU project of Thailand, Thailand; Turkish Atomic Energy Agency (TAEK), Turkey; Na-tional Academy of Sciences of Ukraine, Ukraine; Science and Technology Facilities Council (STFC), United Kingdom; National Science Foundation of the United States of America (NSF) and United States Department of Energy, Office of Nuclear Physics (DOE NP), United States of America.
References
[1] STAR Collaboration, J. Adams et al., “Experimental and theoretical challenges in the search for the quark gluon plasma: The STAR Collaboration’s critical assessment of the evidence from RHIC collisions”, Nucl. Phys. A757 (2005) 102–183, arXiv:nucl-ex/0501009 [nucl-ex].
[2] PHENIX Collaboration, K. Adcox et al., “Formation of dense partonic matter in relativistic nucleus-nucleus collisions at RHIC: Experimental evaluation by the PHENIX collaboration”, Nucl. Phys.A757 (2005) 184–283, arXiv:nucl-ex/0410003 [nucl-ex].
[3] BRAHMS Collaboration, I. Arsene et al., “Quark gluon plasma and color glass condensate at RHIC? The Perspective from the BRAHMS experiment”, Nucl. Phys. A757 (2005) 1–27, arXiv:nucl-ex/0410020 [nucl-ex].
[4] PHOBOS Collaboration, B. B. Back et al., “The PHOBOS perspective on discoveries at RHIC”, Nucl. Phys.A757 (2005) 28–101, arXiv:nucl-ex/0410022 [nucl-ex].
[5] ALICE Collaboration, K. Aamodt et al., “Elliptic flow of charged particles in Pb–Pb collisions at 2.76 TeV”, Phys. Rev. Lett. 105 (2010) 252302, arXiv:1011.3914 [nucl-ex].
[6] ALICE Collaboration, K. Aamodt et al., “Suppression of Charged Particle Production at Large Transverse Momentum in Central Pb–Pb Collisions at√sNN= 2.76 TeV”, Phys. Lett. B696
(2011) 30–39, arXiv:1012.1004 [nucl-ex].
[7] ALICE Collaboration, J. Schukraft, “Heavy Ion physics with the ALICE experiment at the CERN LHC”, Phil. Trans. Roy. Soc. Lond. A370 (2012) 917–932, arXiv:1109.4291 [hep-ex]. [8] N. Cabibbo and G. Parisi, “Exponential Hadronic Spectrum and Quark Liberation”, Phys. Lett.
59B (1975) 67–69.
[9] E. V. Shuryak, “Quark-Gluon Plasma and Hadronic Production of Leptons, Photons and Psions”, Phys. Lett.78B (1978) 150. [Yad. Fiz.28,796(1978)].
[10] E. Laermann and O. Philipsen, “The Status of lattice QCD at finite temperature”, Ann. Rev. Nucl. Part. Sci.53 (2003) 163–198, arXiv:hep-ph/0303042 [hep-ph].
[11] Y. Aoki, G. Endrodi, Z. Fodor, S. D. Katz, and K. K. Szabo, “The Order of the quantum chromodynamics transition predicted by the standard model of particle physics”, Nature 443 (2006) 675–678, arXiv:hep-lat/0611014 [hep-lat].
[12] S. Gupta, X. Luo, B. Mohanty, H. G. Ritter, and N. Xu, “Scale for the Phase Diagram of Quantum Chromodynamics”, Science 332 (2011) 1525–1528, arXiv:1105.3934 [hep-ph].
[13] ALICE Collaboration, B. Abelev et al., “Pseudorapidity density of charged particles in p + Pb collisions at√sNN= 5.02 TeV”, Phys. Rev. Lett. 110 no. 3, (2013) 032301, arXiv:1210.3615
[nucl-ex].
[14] ALICE Collaboration, J. Adam et al., “Centrality dependence of particle production in p–Pb collisions at√sNN= 5.02 TeV”, Phys. Rev. C91 no. 6, (2015) 064905, arXiv:1412.6828
[nucl-ex].
[15] ALICE Collaboration, K. Aamodt et al., “Centrality dependence of the charged-particle
multiplicity density at mid-rapidity in Pb–Pb collisions at√sNN= 2.76 TeV”, Phys. Rev. Lett. 106
(2011) 032301, arXiv:1012.1657 [nucl-ex].
[16] M. Arneodo, “Nuclear effects in structure functions”, Phys. Rept. 240 (1994) 301–393.
[17] ALICE Collaboration, B. Abelev et al., “Measurement of prompt D-meson production in p–Pb collisions at√sNN= 5.02 TeV”, Phys. Rev. Lett. 113 no. 23, (2014) 232301, arXiv:1405.3452
[nucl-ex].
[18] PHOBOS Collaboration, B. Alver et al., “Phobos results on charged particle multiplicity and pseudorapidity distributions in Au+Au, Cu+Cu, d+Au, and p+p collisions at ultra-relativistic energies”, Phys. Rev. C83 (2011) 024913, arXiv:1011.1940 [nucl-ex].
[19] ALICE Collaboration, J. Adam et al., “Enhanced production of multi-strange hadrons in
high-multiplicity proton-proton collisions”, Nature Phys. 13 (2017) 535–539, arXiv:1606.07424 [nucl-ex].
[20] STAR Collaboration, M. M. Aggarwal et al., “K∗0production in Cu+Cu and Au+Au collisions at √
sNN = 62.4 GeV and 200 GeV”, Phys. Rev. C84 (2011) 034909, arXiv:1006.1961
[nucl-ex].
[21] ALICE Collaboration, B. Abelev et al., “K√ ∗(892)0and φ (1020) production in Pb–Pb collisions at sNN = 2.76 TeV”, Phys. Rev. C91 (2015) 024609, arXiv:1404.0495 [nucl-ex].
[22] ALICE Collaboration, J. Adam et al., “K∗(892)0and φ (1020) meson production at high transverse momentum in pp and Pb–Pb collisions at√sNN= 2.76 TeV”, Phys. Rev. C95 no. 6, (2017) 064606, arXiv:1702.00555 [nucl-ex].
[23] STAR Collaboration, B. I. Abelev et al., “Strange baryon resonance production in √
sNN = 200 GeV p+p and Au+Au collisions”, Phys. Rev. Lett. 97 (2006) 132301,
arXiv:nucl-ex/0604019 [nucl-ex].
[24] ALICE Collaboration, J. Adam et al., “Production of K∗(892)0and φ (1020) in pâ ˘A ¸SPb collisions at√sNN= 5.02 TeV”, Eur. Phys. J. C76 no. 5, (2016) 245, arXiv:1601.07868 [nucl-ex]. [25] J. Stachel, A. Andronic, P. Braun-Munzinger, and K. Redlich, “Confronting LHC data with the
statistical hadronization model”, J. Phys. Conf. Ser. 509 (2014) 012019, arXiv:1311.4662 [nucl-th].
[26] V. Vovchenko, B. DÃ˝unigus, and H. Stoecker, “Canonical statistical model analysis of p-p, p-Pb, and Pb-Pb collisions at the LHC”, arXiv:1906.03145 [hep-ph].
[27] ALICE Collaboration, S. Acharya et al., “Production of the ρ(770)0meson in pp and Pb–Pb
collisions at√sNN= 2.76 TeV”, Phys. Rev. C99 no. 6, (2019) 064901, arXiv:1805.04365
[28] Particle Data Group Collaboration, M. Tanabashi et al., “Review of Particle Physics”, Phys. Rev. D98 no. 3, (2018) 030001.
[29] STAR Collaboration, B. I. Abelev et al., “Hadronic resonance production in d+Au collisions at √
sNN = 200 GeV at RHIC”, Phys. Rev. C78 (2008) 044906, arXiv:0801.0450 [nucl-ex].
[30] ALICE Collaboration, S. Acharya et al., “Suppression of Λ(1520) resonance production in central Pb–Pb collisions at√sNN= 2.76 TeV”, Phys. Rev. C99 (2019) 024905,
arXiv:1805.04361 [nucl-ex].
[31] H. J. Drescher, M. Hladik, S. Ostapchenko, T. Pierog, and K. Werner, “Parton based Gribov-Regge theory”, Phys. Rept. 350 (2001) 93–289, arXiv:hep-ph/0007198 [hep-ph].
[32] K. Werner, I. Karpenko, T. Pierog, M. Bleicher, and K. Mikhailov, “Event-by-Event Simulation of the Three-Dimensional Hydrodynamic Evolution from Flux Tube Initial Conditions in
Ultrarelativistic Heavy Ion Collisions”, Phys. Rev. C82 (2010) 044904, arXiv:1004.0805 [nucl-th].
[33] K. Werner, B. Guiot, I. Karpenko, and T. Pierog, “Analysing radial flow features in p–Pb and pp collisions at several TeV by studying identified particle production in EPOS3”, Phys. Rev. C89 no. 6, (2014) 064903, arXiv:1312.1233 [nucl-th].
[34] S. A. Bass et al., “Microscopic models for ultrarelativistic heavy ion collisions”, Prog. Part. Nucl. Phys.41 (1998) 255–369, arXiv:nucl-th/9803035 [nucl-th]. [Prog. Part. Nucl.
Phys.41,225(1998)].
[35] A. G. Knospe, C. Markert, K. Werner, J. Steinheimer, and M. Bleicher, “Hadronic resonance production and interaction in partonic and hadronic matter in the EPOS3 model with and without the hadronic afterburner UrQMD”, Phys. Rev. C93 no. 1, (2016) 014911, arXiv:1509.07895 [nucl-th].
[36] ALICE Collaboration, B. Abelev et al., “Long-range angular correlations on the near and away side in p-Pb collisions at√sNN= 5.02 TeV”, Phys. Lett. B719 (2013) 29–41, arXiv:1212.2001
[nucl-ex].
[37] ALICE Collaboration, B. Abelev et al., “Long-range angular correlations of π, K and p in p–Pb collisions at√sNN= 5.02 TeV”, Phys. Lett. B726 (2013) 164–177, arXiv:1307.3237
[nucl-ex].
[38] ALICE Collaboration, B. Abelev et al., “Multiparticle azimuthal correlations in p–Pb and Pb–Pb collisions at the CERN Large Hadron Collider”, Phys. Rev. C90 no. 5, (2014) 054901,
arXiv:1406.2474 [nucl-ex].
[39] P. Bozek, “Collective flow in p–Pb and d–Pd collisions at TeV energies”, Phys. Rev. C85 (2012) 014911, arXiv:1112.0915 [hep-ph].
[40] P. Bozek and W. Broniowski, “Correlations from hydrodynamic flow in p–Pb collisions”, Phys. Lett.B718 (2013) 1557–1561, arXiv:1211.0845 [nucl-th].
[41] ALICE Collaboration, B. Abelev et al., “Multiplicity Dependence of Pion, Kaon, Proton and Lambda Production in p–Pb Collisions at√sNN= 5.02 TeV”, Phys. Lett. B728 (2014) 25–38,
arXiv:1307.6796 [nucl-ex].
[42] ALICE Collaboration, J. Adam et al., “Multi-strange baryon production in p–Pb collisions at √
[43] ALICE Collaboration, K. Aamodt et al., “The ALICE experiment at the CERN LHC”, JINST 3 (2008) S08002.
[44] ALICE Collaboration, B. Abelev et al., “Performance of the ALICE Experiment at the CERN LHC”, Int. J. Mod. Phys. A29 (2014) 1430044, arXiv:1402.4476 [nucl-ex].
[45] ALICE Collaboration, K. Aamodt et al., “Alignment of the ALICE Inner Tracking System with cosmic-ray tracks”, JINST 5 (2010) P03003, arXiv:1001.0502 [physics.ins-det].
[46] J. Alme et al., “The ALICE TPC, a large 3-dimensional tracking device with fast readout for ultra-high multiplicity events”, Nucl. Instrum. Meth. A622 (2010) 316–367, arXiv:1001.1950 [physics.ins-det].
[47] A. Akindinov et al., “Performance of the ALICE Time-Of-Flight detector at the LHC”, Eur. Phys. J. Plus128 (2013) 44.
[48] ALICE Collaboration, E. Abbas et al., “Performance of the ALICE VZERO system”, JINST 8 (2013) P10016, arXiv:1306.3130 [nucl-ex].
[49] ALICE Collaboration, P. Cortese et al., ALICE forward detectors: FMD, TO and VO: Technical Design Report. Technical Design Report ALICE. CERN, Geneva, 2004.
http://cds.cern.ch/record/781854. Submitted on 10 Sep 2004.
[50] ALICE Collaboration, M. Gallio, W. Klempt, L. Leistam, J. De Groot, and J. SchÃijkraft, ALICE Zero-Degree Calorimeter (ZDC): Technical Design Report. Technical Design Report ALICE. CERN, Geneva, 1999. https://cds.cern.ch/record/381433.
[51] ALICE Collaboration, J. Adam et al., “Measurement of pion, kaon and proton production in proton-proton collisions at√s= 7 TeV”, Eur. Phys. J. C75 no. 5, (2015) 226,
arXiv:1504.00024 [nucl-ex].
[52] ALICE Collaboration, B. Abelev et al., “Production of inclusive ϒ(1S) and ϒ(2S) in p–Pb collisions at√sNN= 5.02 TeV”, Phys. Lett. B740 (2015) 105–117, arXiv:1410.2234
[nucl-ex].
[53] ALICE Collaboration, J. Adam et al., “Charged-particle multiplicities in proton-proton collisions at√s= 0.9 to 8 TeV”, Eur. Phys. J. C77 no. 1, (2017) 33, arXiv:1509.07541 [nucl-ex]. [54] ALICE Collaboration, K. Aamodt et al., “Production of pions, kaons and protons in pp collisions
at√s= 900 GeV with ALICE at the LHC”, Eur. Phys. J. C71 (2011) 1655, arXiv:1101.4110 [hep-ex].
[55] ALICE Collaboration, B. Abelev et al., “Production of K√ ∗(892)0and φ (1020) in pp collisions at s= 7 TeV”, Eur. Phys. J. C72 (2012) 2183, arXiv:1208.5717 [hep-ex].
[56] P. Z. Skands, “Tuning Monte Carlo Generators: The Perugia Tunes”, Phys. Rev. D82 (2010) 074018, arXiv:1005.3457 [hep-ph].
[57] S. Roesler, R. Engel, and J. Ranft, “The Monte Carlo event generator DPMJET-III”, in Advanced Monte Carlo for radiation physics, particle transport simulation and applications. Proceedings, Conference, MC2000, Lisbon, Portugal, October 23-26, 2000, pp. 1033–1038. 2000.
arXiv:hep-ph/0012252 [hep-ph]. http://www-public.slac.stanford.edu/sciDoc/ docMeta.aspx?slacPubNumber=SLAC-PUB-8740.
[58] R. Brun, F. Bruyant, F. Carminati, S. Giani, M. Maire, A. McPherson, G. Patrick, and L. Urban, “GEANT Detector Description and Simulation Tool”,.
[59] ALICE Collaboration, B. Abelev et al., “Centrality dependence of π, K, p production in Pb–Pb collisions at√sNN= 2.76 TeV”, Phys. Rev. C88 (2013) 044910, arXiv:1303.0737 [hep-ex].
[60] G. Battistoni, S. Muraro, P. R. Sala, F. Cerutti, A. Ferrari, S. Roesler, A. Fasso, and J. Ranft, “The FLUKA code: Description and benchmarking”, AIP Conf. Proc. 896 no. 1, (2007) 31–49.
[61] C. Tsallis, “Possible Generalization of Boltzmann-Gibbs Statistics”, J. Statist. Phys. 52 (1988) 479–487.
[62] E. Schnedermann, J. Sollfrank, and U. W. Heinz, “Thermal phenomenology of hadrons from 200 A/GeV S+S collisions”, Phys. Rev. C48 (1993) 2462–2475, arXiv:nucl-th/9307020 [nucl-th].
[63] STAR Collaboration, B. I. Abelev et al., “Systematic Measurements of Identified Particle Spectra in pp, d+Au and Au+Au Collisions from STAR”, Phys. Rev. C79 (2009) 034909,
arXiv:0808.2041 [nucl-ex].
[64] ALICE Collaboration, D. Adamova et al., “Production of Σ(1385)±and Ξ(1530)0in p–Pb collisions at√sNN= 5.02 TeV”, Eur. Phys. J. C77 no. 6, (2017) 389, arXiv:1701.07797
[nucl-ex].
[65] ALICE Collaboration, B. Abelev et al., “Production of Σ(1385)± and Ξ(1530)0in proton-proton collisions at√s= 7 TeV”, Eur. Phys. J. C75 no. 1, (2015) 1, arXiv:1406.3206 [nucl-ex]. [66] U. W. Heinz, “Concepts of heavy ion physics”, in 2002 European School of high-energy physics,
Pylos, Greece, 25 Aug-7 Sep 2002: Proceedings, pp. 165–238. 2004. arXiv:hep-ph/0407360 [hep-ph]. http://doc.cern.ch/yellowrep/CERN-2004-001.
[67] J. Sollfrank, F. Becattini, K. Redlich, and H. Satz, “Canonical strangeness enhancement”, Nucl. Phys.A638 (1998) 399C–402C, arXiv:nucl-th/9802046 [nucl-th].
[68] J. Letessier and J. Rafelski, “Strangeness chemical equilibration in QGP at RHIC and CERN LHC”, Phys. Rev. C75 (2007) 014905, arXiv:nucl-th/0602047 [nucl-th].
[69] STAR Collaboration, B. I. Abelev et al., “Strange particle production in p+p collisions at√ s= 200 GeV”, Phys. Rev. C75 (2007) 064901, arXiv:nucl-ex/0607033 [nucl-ex].
[70] S. Wheaton and J. Cleymans, “Statistical-thermal model calculations using THERMUS”, J. Phys. G31 (2005) S1069–S1074, arXiv:hep-ph/0412031 [hep-ph].
[71] A. Andronic, P. Braun-Munzinger, and J. Stachel, “Hadron production in central nucleus-nucleus collisions at chemical freeze-out”, Nucl. Phys. A772 (2006) 167–199, arXiv:nucl-th/0511071 [nucl-th].
[72] M. Petran, J. Letessier, J. Rafelski, and G. Torrieri, “SHARE with CHARM”, Comput. Phys. Commun.185 (2014) 2056–2079, arXiv:1310.5108 [hep-ph].