SSEPs of self-paced vs synchronization finger tapping Supplementary Material
(De Pretto, Deiber, and James) 1
Introduction
Tables S1 and S2 report the results of Task (2) x Tempo (3) ANOVAs at F0 comparing SMS versus SP prior to subtracting the LO signal from SMS. Figures S1, S2, and S3 compare the results of both synchronization versus self-paced finger tapping analyses: without subtraction of LO (SMS vs SP) and with subtraction of LO (SMS-LO vs SP).
Table S1 – Results for the global frequency indices comparing SMS versus SP
GPS GMD
F df p-val ηp2 ε* p-val Task 26.73 1,13 0.000 0.67 - 0.116 Task x Tempo 1.03 2,12 0.386 0.15 - 0.057 * Greenhouse-Geisser Epsilon reported for effects violating sphericity assumption and corrected using Greenhouse-Geisser estimates of sphericity
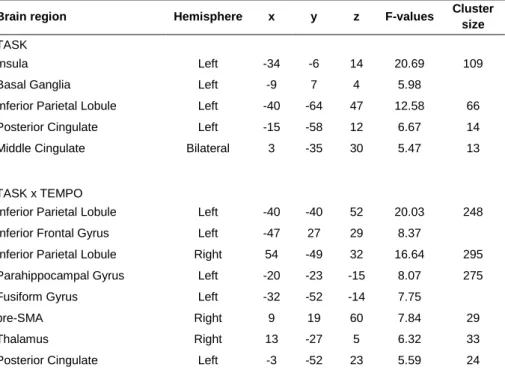
Table S2 – Main Brain Region Activations for the 2 Task x 3 Tempo ANOVA on current density for SMS versus SP
Brain region Hemisphere x y z F-values Cluster
size TASK
Insula Left -34 -6 14 20.69 109
Basal Ganglia Left -9 7 4 5.98
Inferior Parietal Lobule Left -40 -64 47 12.58 66 Posterior Cingulate Left -15 -58 12 6.67 14 Middle Cingulate Bilateral 3 -35 30 5.47 13
TASK x TEMPO
Inferior Parietal Lobule Left -40 -40 52 20.03 248 Inferior Frontal Gyrus Left -47 27 29 8.37
Inferior Parietal Lobule Right 54 -49 32 16.64 295 Parahippocampal Gyrus Left -20 -23 -15 8.07 275 Fusiform Gyrus Left -32 -52 -14 7.75
pre-SMA Right 9 19 60 7.84 29
Thalamus Right 13 -27 5 6.32 33
Posterior Cingulate Left -3 -52 23 5.59 24
Note. Talairach x y z coordinates of local maxima for each significant cluster at p < .05. Minimal
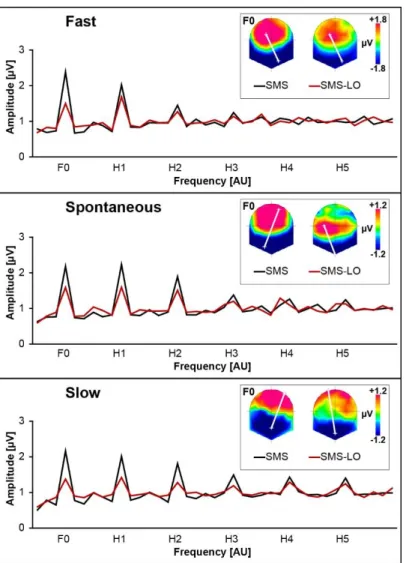
Figure S1 – SSEPs for each tempo of the synchronization conditions before (SMS) and after (SMS-LO) subtraction of the LO signal. Statistical analysis at F0 yielded a main effect of task on GPS (p < 0.001), indicating higher GPS values before subtraction. Spatial voltage configurations were similar for SMS and SMS-LO responses (all GMD p-values > 0.6).
SSEPs of self-paced vs synchronization finger tapping Supplementary Material
(De Pretto, Deiber, and James) 3
Figure S2 – Solution points showing significant main effect of Task (A), and the corresponding current density (CD) difference maps (B). In the case of CD, the intensity of the color depends on the scale and is independent of whether the difference was significant or not (same scale for both analyses). Green-to-red colors indicate stronger activation in the SMS/SMS-LO conditions. Blue-to-purple colors indicate stronger activation in the SP conditions.
Figure S3 – Solution points showing significant interaction effect of Task x Tempo (A), and the corresponding current density (CD) difference maps (B). Same color conventions as in Figure S2.
SSEPs of self-paced vs synchronization finger tapping Supplementary Material
(De Pretto, Deiber, and James) 5
Discussion
These results with or without subtracting the LO condition are very similar. Comparing both analyses, the absence of GMD effect suggests comparable underlying brain sources, as confirmed by source analyses (Figures S2 and S3). Indeed, by physical laws, only modifications of scalp voltage
topographies may indicate a change in the constellation of the underlying sources (James, Oechslin, Michel, & De Pretto, 2017; Michel & Murray, 2012; Vaughan, 1982). The higher GPS values before versus after subtraction reflect the removal of brain activity associated with the metronome (Figure S1).
The comparison between the two analyses shows that the differences observed in SMS-LO vs SP were already present before removing the LO signal, indicating that the subtraction removed brain signal associated with the metronome sounds without modifying the direction of the differences (Figures S2.B, S3.B).
The similar results are best explained by the fact that the SMS vs SP analyses were time-locked to the finger taps and not to the metronome sounds, decreasing the influence of the metronome on the overall signal. However, even though SSEPs where computed from averaged epochs time-locked to the finger taps, the strict metronome IOI will have prevented complete cancellation of metronome-related brain signal.
Furthermore, the between-subject variability of the tapping asynchrony with the metronome beats will have modulated the influence of the metronome for each subject and tempo, thus increasing
between-subject variability of the EEG signal. This second point is supported by the absence of GMD main effect of Task and the marginal interaction effect in the analysis without subtraction of LO. In conclusion, the subtraction has the advantage of removing within-subject metronome-induced signal and reducing between-subject variability. The results with subtraction are thus more accurate.
References
James, C. E., Oechslin, M. S., Michel, C. M., & De Pretto, M. (2017). Electrical neuroimaging of music processing reveals mid-latency changes with level of musical expertise. Frontiers in
Neuroscience, 11. https://doi.org/10.3389/fnins.2017.00613
Michel, C. M., & Murray, M. M. (2012). Towards the utilization of EEG as a brain imaging tool.
NeuroImage, 61(2), 371–385. https://doi.org/10.1016/j.neuroimage.2011.12.039
Vaughan, H. G. (1982). The neural origins of human event-related potentials. Annals of the New York