Publisher’s version / Version de l'éditeur:
Journal of Applied Physics, 98, 3, pp. 033104-1-033104-7, 2005-08-01
READ THESE TERMS AND CONDITIONS CAREFULLY BEFORE USING THIS WEBSITE. https://nrc-publications.canada.ca/eng/copyright
Vous avez des questions? Nous pouvons vous aider. Pour communiquer directement avec un auteur, consultez la première page de la revue dans laquelle son article a été publié afin de trouver ses coordonnées. Si vous n’arrivez pas à les repérer, communiquez avec nous à PublicationsArchive-ArchivesPublications@nrc-cnrc.gc.ca.
Questions? Contact the NRC Publications Archive team at
PublicationsArchive-ArchivesPublications@nrc-cnrc.gc.ca. If you wish to email the authors directly, please see the first page of the publication for their contact information.
NRC Publications Archive
Archives des publications du CNRC
This publication could be one of several versions: author’s original, accepted manuscript or the publisher’s version. / La version de cette publication peut être l’une des suivantes : la version prépublication de l’auteur, la version acceptée du manuscrit ou la version de l’éditeur.
For the publisher’s version, please access the DOI link below./ Pour consulter la version de l’éditeur, utilisez le lien DOI ci-dessous.
https://doi.org/10.1063/1.1999827
Access and use of this website and the material on it are subject to the Terms and Conditions set forth at
Ultrasound Generated by a Femtoscond and a Picosecond Laser Pulse
Near the Ablation Threshold
Hebert, H.; Vidal, F.; Martin, F.; Kieffer, J.-C.; Nadeau, A.; Johnston, T. W.;
Blouin, A.; Moreau, A.; Monchalin, J. -P.
https://publications-cnrc.canada.ca/fra/droits
L’accès à ce site Web et l’utilisation de son contenu sont assujettis aux conditions présentées dans le site LISEZ CES CONDITIONS ATTENTIVEMENT AVANT D’UTILISER CE SITE WEB.
NRC Publications Record / Notice d'Archives des publications de CNRC:
https://nrc-publications.canada.ca/eng/view/object/?id=3987b953-5be4-4683-bc01-cb17afdb4a44 https://publications-cnrc.canada.ca/fra/voir/objet/?id=3987b953-5be4-4683-bc01-cb17afdb4a44Ultrasound generated by a femtosecond and a picosecond laser pulse near
the ablation threshold
H. Hébert, F. Vidal,a兲F. Martin, J.-C. Kieffer, A. Nadeau, and T. W. Johnston
Institut National de la Recherche Scientifique-Énergie, Matériaux et Télécommunications, Université du Québec, 1650 boul. Lionel-Boulet, Varennes, Québec, J3X 1S2, Canada
A. Blouin, A. Moreau, and J.-P. Monchalin
Industrial Materials Institute, National Research Council of Canada, 75 boul. de Mortagne, Boucherville, Québec, J4B 6Y4, Canada
共Received 3 May 2005; accepted 16 June 2005; published online 11 August 2005兲
We have investigated high-frequency ultrasound generated by single laser pulses in thin 共50m兲 aluminum foils as a function of the laser fluence. Laser-pulse durations of 80 fs and 270 ps were used to compare the ultrasound generated in two very different regimes: thermoelastic and ablation. The measured rear-surface displacement induced by the ultrasound pulse is similar after 50-m propagation through the foils for the two laser-pulse durations in the fluence range of 0.1– 0.7 J / cm2. For fluences greater than the ablation threshold 共0.25 and 0.63 J / cm2 for the 80 -fs and 270-ps pulses, respectively兲, the ultrasound amplitude generated by the 270-ps laser pulse is increased significantly due to absorption of laser energy by the ablating plasma. This is not observed for the 80-fs laser pulse since ablation is produced well after the laser-pulse irradiation of the target. The measured surface displacement as a function of laser fluence is compared to the calculations of a one-dimensional fluid code for both laser-pulse durations. The model calculations agree in many ways with the experimental results, but some discrepancies are observed. © 2005 American Institute of Physics. 关DOI: 10.1063/1.1999827兴
I. INTRODUCTION
Because of its simplicity, low cost, and accuracy, high-frequency ultrasound find important industrial applications in the measurement of thickness of thin coatings. Although there are many ways to generate high-frequency ultrasound 共acoustic microscopes, surface acoustic wave devices, thin piezoelectric film transducers兲, none of these technologies offer the unique combination of advantages of laser ultrason-ics: noncontact with large standoff distances, ability to work on hot or moving parts, ability to work on parts with com-plex shapes, and ultrawide bandwidth.1
Early models and experiments reviewed in Refs. 2–4 showed that there are two main regimes for laser generation of ultrasound in a solid: the thermoelastic and ablative re-gimes. The thermoelastic regime is characterized by surface heating due to laser absorption with an ensuing rapid local thermal expansion, which launches the ultrasound wave. The ablative regime occurs at fluences above some threshold 共called the ablation threshold兲 for which partial ablation of the sample surface is achieved. The acoustic pulse is pro-duced partly by thermal expansion and partly by momentum transfer from the ejected matter 共a plasma兲 to the sample surface.
The thermoelastic and ablative regimes have been exten-sively studied both experimentally and theoretically by means of models involving various assumptions. As a result, in the thermoelastic regime, the relationship between the la-ser pulse and the acoustic pulse is now well understood. In that regime, the ultrasound amplitude is proportional to the
absorbed thermal energy, and the high-frequency limit de-pends on the light penetration depth and the Fourier trans-form of the light pulse.5 In the ablation regime, however, experimental and modeling efforts have been more recent.6–15 Although it is well known that the ablation mechanisms depend strongly on the laser-pulse duration 共see, for example, Refs. 16 and 17兲, the investigations on ultra-sound generation in the ablative regime essentially deal with long laser pulses 共typically in the nanosecond range兲. For long laser pulses, the end of the pulse interacts with the matter ablated by the front of the pulse. This induces plasma heating, which increases the amplitude of the ultrasound launched inside the solid as a consequence of the additional pressure applied on the material’s surface. On the contrary, sufficiently short laser pulses 共typically in the subpicosecond range兲 do not have enough time to build up a plasma that interacts with the light pulse. Moreover, since less thermal energy is dissipated in the target, ablation is more efficient for short laser pulses at a given fluence. Therefore, one ex-pects significant differences in the ultrasound generated by ablation with long and short laser pulses in the ablative re-gime.
The main goal of this paper is to investigate, by means of experiments and modeling, the influence of the ablation threshold on the ultrasound amplitude in two regimes of laser-pulse duration for which the ablation mechanisms are expected to be different. For that purpose we present a com-parison of ultrasound amplitudes as a function of laser flu-ence generated with a 共relatively兲 long laser pulse of 270 ps and with an ultrashort laser pulse of 80 fs in 50-m-thick aluminum samples. It is worth pointing out that our previous investigations clearly indicate that all the features of ablation
a兲
Author to whom correspondence should be addressed; electronic mail: vidal@emt.inrs.ca
that characterize long pulses should hold for a 270-ps pulse since the long-pulse regimes start to be effective for pulse durations near 10 ps in the case of aluminum targets.16,17
In our experiments the ablation thresholds were deter-mined by measuring the broadband white light emission pro-duced at the sample surface by the ablated matter. Ultra-sound amplitudes were characterized by the surface displacements of the foil’s rear side, measured by means of a high-frequency interferometry technique.18–20This technique presents the considerable advantage over the more usual and higher-frequency pump-probe piezoreflectance detection technique21–26 that the time dependence of the rear surface displacement can be measured with a single laser shot. Op-positely, the pump-probe piezoreflectance technique requires as many laser shots as there are measured times. Multiple laser shots induce particular difficulties in ensuring the re-producibility of the measurements in the ablation regime. Moreover, estimations indicate that interferometry should be more sensitive for ultrasound measurements below about 10 GHz,27 which is well beyond the limit of 800 MHz for the optimal response of the Fabry-Perot interferometer used in our experiments.20
Measured ultrasound amplitudes were compared to the predictions of a one-dimensional fluid code to help deter-mine the specific nature of ultrasound generation in these two regimes of laser-pulse duration. This code, used in pre-vious work,17,28–30 provides a consistent description of the absorption of the laser energy in the target and in the plasma, of the ablation process, and of the generation of acoustic pulses in the solid.
This article is structured as follows: In Sec. II, we present the experimental configurations for the measure-ments of the ablation 共plasma formation兲 threshold and of the surface displacement associated with the laser-generated ul-trasound wave. The experimental measurements and their in-terpretation are presented in Sec. III. Section IV presents a comparison of these measurements with the calculations of surface displacement performed using a numerical model. Finally, a summary of the main results is presented in the Summary and Conclusion.
II. EXPERIMENTAL DETAILS
The ultrasound generation laser pulses were produced using the INRS-EMT 10-TW Ti:sapphire laser system at a wavelength of 800 nm. This laser system can produce pulses from 60 fs to 3 ps in duration at energies of up to 600 mJ as well as uncompressed pulses of 270 ps of up to 1 J of en-ergy. Pulse durations of 80 fs and 270 ps with energies of up to 30 mJ were used for these experiments. One notes that the energy of the prepulse 共i.e., a longer low-energy pulse occur-ring before the main short laser pulse兲 is more than 106times smaller than the energy of the main pulse, and thus plays a negligible role in our experiments. Each measurement re-ported here was performed using a single laser pulse on a clean and fresh target surface because it was observed that successive pulses at the same location did not produce repeti-tive results. The energy of each pulse was measured with a microjoulemeter.
The Al foil used for these measurements has 99.99% purity and was cleaned with methanol. The foil is approxi-mately 50-m thick and mounted on a 3-in. diameter ring such that the only mechanical constraints are at the edges. Samples from the same roll were used for the ablation threshold and surface displacement measurements. The dull side faced the ablation laser, while the more reflective side was used to increase the amount of light entering the surface displacement measurement system. This system was made of a continuous infrared laser and a 1-m confocal Fabry-Perot interferometer.18
A. Measurement of the ablation thresholds
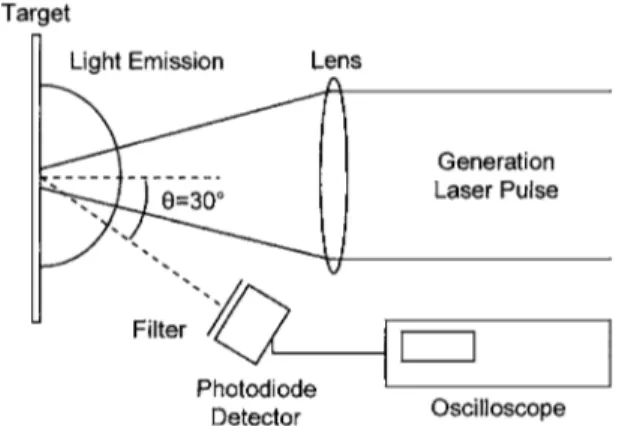
As mentioned above, experiments performed with long 共nanosecond兲 pulses indicate that there are two main regimes for ultrasound generation: the thermoelastic and ablation re-gimes. The transition between these two regimes occurs at the ablation threshold, which is usually defined in terms of fluence, i.e., the incident laser energy divided by the surface containing this energy.3,4This threshold varies as a function of the laser-pulse duration.31 The ablation thresholds of Al samples used in the present ultrasound experiments were de-termined by measuring the broadband white light emitted from the sample surface, indicative of plasma generation and significant ejection of matter. The experimental layout for these measurements is shown in Fig. 1. The light emitted after laser impact from the sample surface was detected by a DET 110 Si PIN 关ThorLabs兴 that has a spectral response of 320– 1100 nm. A BG-39 blue filter 共2-mm thick兲 was used to block the generation laser wavelength. This filter attenuates the 800-nm laser wavelength by a factor in excess of 104and transmits with better than 80% efficiency in the 350– 650 -nm range. The detector was positioned at an approximate angle of 30° to the normal of the sample surface and 150 mm away from the generation spot. The intensity of light emis-sion was acquired with an oscilloscope.
In these measurements, it is important to evaluate the fluence of laser pulses characterized by a Gaussian-like in-tensity profile in time and space. The value that is usually used is the average fluence, defined as the total laser energy divided by the area corresponding to the full width at half maximum 共FWHM兲 diameter of the beam. This definition of fluence is acceptable when the plasma is produced over a
FIG. 1. Schematic of the experimental setup used for ablation threshold measurements.
relatively large fraction of the beam diameter, but is not very meaningful for determining the ablation threshold since, for increasing values of energy, plasma formation begins at the center 共peak兲 of the pulse where the fluence is maximum. Thus, to determine the ablation threshold, it is more appro-priate to use the fluence near the peak of the spatial distribu-tion. The definition of fluence adopted here is 90% of the maximum fluence. To this value corresponds a small circular region around the center of the pulse, which will be referred to as the “flat-top” region. For a Gaussian profile, this defi-nition of fluence corresponds to 66% of the average fluence. 共That the average fluence is higher than that at the center results from the fact that all the laser energy is considered in the average fluence.兲 To evaluate this fluence, the size of the pulse was determined by fitting the measured beam spatial distribution to a Gaussian profile. The spatial energy profile of the laser beam was acquired with a Spiricon camera and
LBA PC 32software. The generation laser pulse used for these experiments was focused on the sample surface using a 2 -m focal-length lens. The corresponding radius of the flat-top region used for defining the fluence is 152± 7m.
B. Generation and detection of ultrasound
As mentioned above, the irradiation of a sample surface by a laser beam induces a localized compression 共positive stress兲 wave front that propagates into the sample. This com-pression wave is attenuated during propagation through the sample and reflected at the sample’s free surface, returning as a rarefaction wave 共negative longitudinal stress or tension兲.
Ultrasound generation and detection are performed on opposite sides of the foil to avoid interference in the surface displacement measurement between the detection laser pulse and the matter ablated by the generation laser pulse. The experimental layout of laser generation and detection of sur-face displacements is shown in Fig. 2. The ultrasound detec-tion system comprises three main parts: a detecdetec-tion laser, a Fabry-Perot interferometer, and a photodiode detector. The detection laser is a LightWave Electronics Nd: yttrium alu-minum garnet 共YAG兲 laser, which produces 500 mW of con-tinuous optical power at a wavelength of 1064 nm and is very frequency-stable. Surface displacements produced by the ultrasound wave can be detected through a phase
modu-lation of the detection laser beam induced by reflecting the beam on the sample surface.18,32 A half-wave plate and a beam-splitting cube are used to redirect the detection laser beam toward the Fabry-Perot interferometer after reflection on the sample surface. Phase modulation of the laser beam is converted to intensity modulation by the interferometer op-erating in a reflection mode. A quarter-wave plate and a beam-splitting cube then direct the detection laser beam ex-iting the interferometer to an 800-MHz bandwidth InGaAs photodiode detector with processing electronics. A 10-MHz high-pass filter was used to eliminate low frequencies. The signal is amplified by 26 dB using a 0.1– 1300-MHz ampli-fier. The signal is acquired with a 1-GHz bandwidth digital oscilloscope. The detection laser beam was focused on the opposite surface of the sample with respect to the generation laser and aligned in the center of the flat-top generation zone. The focal spot radius of the detection beam was 130± 25m, hence about 85% that of the generating pulse radius 共i.e., 152± 7m兲 as defined by the 90% rule dis-cussed above.
III. EXPERIMENTAL RESULTS
In this section we describe 共a兲 the broadband white light emission measurements used for determining the ablation threshold, and 共b兲 measurements of the rear surface displace-ments characterizing the ultrasound amplitude, for both the 80-fs and 270-ps pulses.
A. Ablation threshold
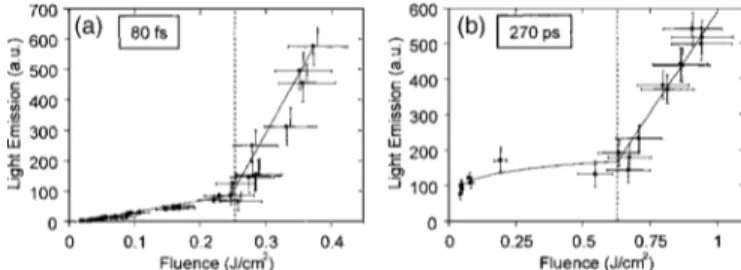
The light-emission measurements as a function of the laser fluence are presented in Fig. 3 for the two pulse dura-tions considered in this paper. One observes for both pulse durations a white light emission threshold occurring at 0.02± 0.01 and 0.04± 0.02 J / cm2for laser pulse durations of 80 fs and 270 ps, respectively. Above this threshold, the white light emission steadily increases with fluence and eventually undergoes a strong break that we attribute to the formation of a plasma of ejected matter.33 We define the ablation threshold by the fluence corresponding to this break. The physical explanation for the low-level light emission below the ablation threshold is not clear yet. Quantitative estimates support the assumption that this emission is due to black body radiation at the surface of the target. However, another possible explanation is that the emission would be
FIG. 2. Schematic of the experimental setup used for ultrasound generation and rear-surface displacement measurements.
FIG. 3. Measurements of plasma light-emission intensity as a function of laser fluence for an 80-fs 共a兲 and a 270-ps 共b兲 laser pulse on a 50-m-thick Al foil target. The ablation threshold is indicated by the dashed lines.
due to an intensity modulation in the generation laser beam 共hot spots兲 producing narrow intense filaments, which would induce very localized ablation of the target.
The ablation thresholds of Al foils irradiated by an 80-fs and a 270-ps laser pulse are clearly 0.25± 0.03 and 0.63± 0.03 J / cm2, respectively. Using a 20X optical micro-scope, we have observed damage to the surface of the Al foil at fluences greater than 0.23± 0.03 and 0.53± 0.03 J / cm2for the 80-fs and 270-ps pulses, respectively. The fact that the values found for the visible-damage thresholds are somewhat lower than the ablation threshold is consistent with the crite-rion used for the ablation threshold, since surface damage such as melting would naturally occur at a fluence lower than for ablation. However, these observations do not help in identifying the specific nature of the white light emission below the ablation threshold. More investigations would be required to draw definite conclusions.
B. Surface displacements
A typical signal corresponding to the rear surface dis-placement as a function of time in the ablative regime, in a
50-m-thick Al foil, is shown in Fig. 4. The compression wave front induces the first rear sample surface displacement 关magnified in Fig. 4共b兲兴, which is toward the detection laser. The amplitude of this first displacement peak 共hereafter called “displacement amplitude”兲, measured at various flu-ences and laser durations, is used as a measurement of the ultrasound amplitude. This surface displacement peak is fol-lowed by a displacement away from the detection laser and back into the sample, which is associated with a tension wave following the compression wave front. The time delay between two consecutive echoes 共compression peaks兲 corre-sponds to a round trip of the acoustic wave within the sample. The average long time scale displacement in Fig. 4共a兲 is associated with the global movement of the foil’s center of mass in reaction to the ejection of matter.20
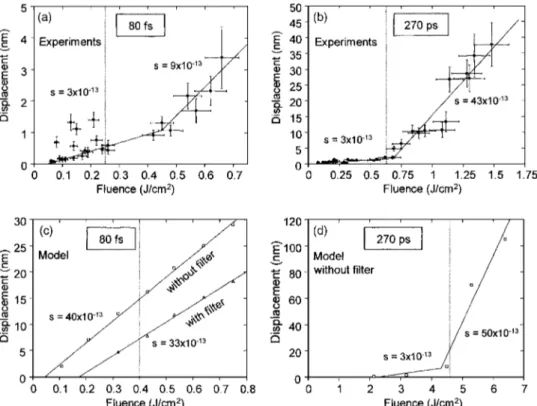
Measurements of the rear surface displacement ampli-tude as a function of laser fluence for the 80-fs and 270-ps laser pulses are presented in Figs. 5共a兲 and 5共b兲, respectively. One observes that the displacement amplitudes measured af-ter traveling once through the foil are similar for the two pulse durations in the fluence range of 0.1– 0.7 J / cm2. How-ever, the displacement amplitudes generated by a 270-ps la-ser pulse increase significantly in the fluence range of 0.7– 1.5 J / cm2. Measurements could not be performed with the 80-fs laser pulse in this fluence range because they were limited by the maximum energy available with this laser con-figuration.
As observed for the light-emission measurements 共Fig. 3兲, there is also a break in the curves of the displacement amplitude measurements. This break occurs at the ablation threshold for the 270-ps pulse, but is approximately a factor of 2 greater than the ablation threshold for the 80-fs pulse. No surface displacements were detected at fluences for which no light emission was detected.
FIG. 4. 共a兲 Typical measurement of rear sample surface displacement as a function of time. Ultrasound were generated by an 80-fs laser pulse with a fluence of 0.69± 0.03 J / cm2on a 50-m-thick Al foil. 共b兲 Enlarged view of
the first ultrasound echo. The value of displacement used in this article is illustrated by the two horizontal lines.
FIG. 5. Experimental results and simulations of rear sample surface dis-placements as a function of laser flu-ence for both an 80-fs and a 270-ps laser pulse on a 50-m-thick Al foil. The slopes of the lines are represented by s, shown in units of m3/ J.
Pre-sented are the experimental measure-ments for 80 fs 共a兲 and 270 ps 共b兲, and the simulations for 80 fs, without and with 800-MHz low-pass filter 共c兲, and 270 ps 共d兲. The ablation threshold is indicated by the dashed lines. 033104-4 Hébert et al. J. Appl. Phys. 98, 033104 共2005兲
The change in slope across the break is relatively small for the 80-fs pulse 共3 ⫻ 10−13– 9 ⫻ 10−13m3/ J兲 compared to the 270-ps pulse 共3 ⫻ 10−13– 43⫻ 10−13m3/ J兲. The small change in slope for the 80-fs pulse makes it difficult to pre-cisely determine the break point. This might explain why this break point does not seem to coincide with the ablation threshold determined using the white light emission.
IV. SIMULATION RESULTS AND COMPARISON WITH EXPERIMENTS
To provide physical insight into the experimental results, we simulated the experiments using a one-dimensional fluid code that describes the generation and propagation of acous-tic waves in bulk Al. A one-dimensional model is justified if the source of ultrasound is large enough so that essentially plane waves propagate in the thickness of the foil. Plane waves take place only in the near field of the acoustic source, as defined by the criterion s 艋 0.1, where s = z / a2 is the Fresnel parameter. Here, is the acoustic wavelength, z is the propagation distance, and a is the radius of the source. In our experiments, z = 50m and a = 152m 共the radius of the flat-top region兲. Then, since the velocity of sound in Al is cs= 6500 m / s, the near-field criterion is verified for frequen-cies cs/ ⬎ 141 MHz, which is acceptable for ultrasound
generated by short and ultrashort laser pulses 共see Sec. I兲. The code used for this project is adapted from previous work.17,28–30It calculates the spatial profile of different hy-drodynamic quantities such as density, temperature, pressure, and velocity as well as surface displacements of the target as a function of time by solving numerically the usual continu-ity equations for mass, momentum, and energy. The interac-tion of the laser pulse with the solid surface and with the ejected matter is described by solving the laser wave equa-tion with the appropriate electrical permittivity, which de-pends on the local mass, density, and temperature of the me-dium. The equation of state for Al included in the code takes into account a single phase transformation from a dense state to a gaseous state. This seems to be justified because the latent heat of vaporization is much larger than the latent heat of fusion. The equation of state also takes into account the change in sound speed, resulting from plastic deformations of matter at high pressures.
For reasons of length and clarity, we show in this paper only the simulation results that can be directly compared with the experimental measurements. Details on the interme-diate results of the simulations will be presented elsewhere. The simulation results for the surface displacement am-plitudes as a function of laser fluence in a 50-m Al foil are presented in Figs. 5共c兲 and 5共d兲 for the 80-fs and 270-ps pulses, respectively. A comparison with Figs. 5共a兲 and 5共b兲, respectively, shows that the simulation and experimental re-sults are qualitatively similar. However, significant quantita-tive differences are observed. In the following, we will dis-cuss the physical interpretation of the general behavior observed in Fig. 5 as obtained from the simulations, as well as the possible reasons for the quantitative discrepancies be-tween modeling and experiments.
A. Ablation thresholds
In the model calculations, the ablation threshold is un-ambiguously defined as the fluence required to produce a nonzero density of matter at some large distance away from the sample surface and at some large positive time.28 These modeled thresholds are identified in Figs. 5共c兲 and 5共d兲.
For the 80-fs pulse, the calculated ablation threshold is 0.4 J / cm2, while the threshold measured optically is near 0.25 J / cm2 and the break point in the measured ultrasonic amplitude is 0.45 J / cm2. We consider that this calculated ablation threshold agrees with experiment, given the uncer-tainties on the measurements and on the numerical model.
For the 270-ps pulse, the calculated ablation threshold is 4.5 J / cm2, while the measured threshold is near 0.65 J / cm2. Although the reasons for this large overestimation of the cal-culated ablation threshold are not yet clear, we suspect that this discrepancy could be due to the fact that some phase transformations are not taken into account in the model. In-deed, the numerical model predicts that, at the ablation threshold, the internal pressures are so high that the surface essentially explodes. However, it is possible that in the case of the longer 270-ps pulses, the surface would have time to melt and evaporate somewhat before the internal pressure builds up. This would create a gaseous Al atmosphere, which could greatly enhance the absorption of the later part of the light pulse and greatly lower the ablation threshold. 共This effect would be similar to that occurring above the ablation threshold, as discussed below.兲 The numerical calculations could not predict this phenomenon because thermal evapora-tion is not included in the code. This phenomenon does not occur for the 80-fs laser pulse because the pulse ends before the surface atoms have time to move a significant distance as compared to the interatomic distance.
B. Displacement amplitudes
For the 270-ps laser pulse, there is a strong break in the surface displacement amplitude curve near the ablation threshold for both simulations 关Fig. 5共d兲兴 and experimental measurements 关Fig. 5共b兲兴 albeit at significantly different threshold values. The slope of both the simulated and experi-mental data is of the order of 10−13m3/ J for fluences below their respective ablation threshold, increasing to 50 ⫻10−13m3/ J 共simulation兲 and 43⫻ 10−13m3/ J 共measure-ments兲 for fluences above each ablation threshold. Therefore, except for the value of the ablation threshold 共as discussed above兲, modeled and experimental displacement amplitudes agree well.
For the 80-fs laser pulse, and in contrast with the 270-ps laser pulse, the simulations predict that the ablation threshold has no effect on surface displacement amplitudes, whereas the measurements seem to show a modest break near 0.45 J / cm2 关Figs. 5共b兲 and 5共d兲兴. Therefore, there is a marked difference between the ultrasound-generation mecha-nisms for the 80-fs and 270-ps pulses. However, there seems to be some qualitative disagreement between simulations and experiments for the 80-fs pulses.
The difference in calculated behavior between the sur-face displacement amplitudes for the 80-fs and 270-ps pulses
near their respective ablation threshold, i.e., the presence or absence of a break in displacement amplitude near the abla-tion threshold, can be explained as follows. In the 270-ps case, the time required to deposit the laser energy on the sample surface is sufficiently long to cause an interaction of the end of the laser pulse with the plasma produced at the beginning of the laser pulse. The laser energy is absorbed efficiently in the plasma, inducing a significant increase of temperature of the ejected matter. In turn, the higher plasma temperature increases the plasma pressure on the sample sur-face. As a result, the ultrasound waves generated at fluences above the ablation threshold have significantly greater ampli-tudes than those generated at fluences below the ablation threshold. This interpretation is in line with the normally accepted view for nanosecond laser-pulse generation.2–4 In contrast, the deposition of the laser energy of a femtosecond laser pulse on a sample surface occurs in a time interval so short that the atoms do not have time to move significantly. Therefore, the plasma ejected after the light pulse is not sub-sequently heated to higher pressures, and no increase in gen-eration efficiency is predicted to occur at the ablation thresh-old. In partial agreement, both simulations and experimental results indicate that the ablation threshold has no or only a relatively small contribution to displacement amplitudes gen-erated by femtosecond laser pulses. 共It should be noted that both momentum and energy are naturally conserved in the model as a consequence of the continuity equations solved, and they have been checked to be conserved with high accu-racy in the simulations.兲
Still for the 80-fs pulse, the comparison between Figs. 5共a兲 and 5共c兲 shows that the model predicts an increase in ultrasound amplitude with a slope of 40⫻ 10−13m3/ J, while the measured value is probably 3 ⫻ 10−13m3/ J but possibly up to 9 ⫻ 10−13m3/ J. Clearly, the model and experiment dis-agree quantitatively on surface displacement amplitude.
A partial explanation for these significant discrepancies is that the measurement of surface displacements is limited by the bandwidth of the InGaAs detector. As a result, the higher-frequency components of the measured signal are electronically attenuated. The frequency limit in the simula-tion results is much higher, and corresponds to the Nyquist criterion for a time step of 10 ps 共50 GHz兲. Applying an 800-MHz low-pass filter 共second-order Chebyshev兲 to the simulation results significantly decreased the amplitude of the surface displacement for the 80-fs pulse, as shown in Fig. 5共c兲. However, even with the filter, the calculated displace-ment amplitudes dependence on fluence is 33⫻ 10−13m3/ J, which is still substantially larger than the measured value for the 80-fs pulse. The same filter was found to have no effect on the displacement amplitudes for the 270-ps pulse. This is a natural consequence of the fact that the 270-ps laser pulse generates longer acoustic pulses than the 80-fs laser pulse and thus has lower frequency components.
The remaining discrepancy in surface displacement am-plitudes cannot be attributed to any of the usual scattering or absorption mechanisms that cause ultrasonic attenuation for small-amplitude ultrasound because previous work consis-tently report signal attenuation in the range of 4.8– 6 dB/ mm near 530 MHz19,20,34as compared to the ⬃400 dB/ mm that
would be necessary to explain our results 共i.e., roughly a factor of 10 for a propagation distance of 0.05 mm兲. More-over, we do not think that the simulations can overestimate the amount of laser energy absorbed sufficiently to explain the discrepancy, since this quantity is in good general agree-ment with the available experiagree-mental data obtained for some-what different laser parameters.35
We believe that the observed attenuation is likely due to the high pressure generated in the solid by the 80-fs laser pulse. In the numerical model, the generated compressive stresses reach values in excess of 10 GPa near the ablation threshold. These stresses far exceed the static yield stress of Al, which is about 30 MPa or less for an annealed Al alloy of the 1000 series 共more than 99% pure Al兲 and about 150 MPa or less for a heavily cold-deformed alloy of the same series 共such as H18 treatment兲.36Although the dynamic yield stress is higher than the static one, it is unlikely to increase in the gigapascal range. As a result, both elastic and plastic defor-mation waves are generated, with most of the energy in the plastic wave.
It is known, from metallurgy, that plastic deformation results in the creation and motion of dislocations. Both of these processes convert mechanical energy into heat. There-fore, the attenuation of plastic waves could reduce the placement amplitude substantially. We believe that the dis-agreement in the absolute displacement amplitude is due to the fact that the model did not take into account the appro-priate wave-attenuation processes occurring in real solids. The only kinetic-energy absorption mechanism included in the code is the von Neumann artificial viscosity required for numerical stability. However, this contribution seems to be too small to describe the attenuation actually occurring in the aluminum samples used.
In the case of the 270-ps laser pulses, the calculated compressive stresses are only of the order of 1 GPa. There-fore, the propagating plastic deformation would be at least ten times smaller or perhaps absent altogether if the dynamic yield stress approaches 1 GPa. Correspondingly, the pre-dicted and measured surface displacement amplitudes are found to agree.
V. SUMMARY AND CONCLUSION
The effects of laser-pulse duration and laser fluence on the amplitude of the rear sample surface displacements due to ultrasound waves propagating in thin 共50m兲 Al foils were investigated experimentally. The two laser-pulse dura-tions used in these experiments were 80 fs and 270 ps. The laser fluences investigated range from zero up to two or three times the ablation threshold for each pulse duration. A com-parison with a one-dimensional fluid code was performed to provide physical insight into the ultrasound properties in these two regimes of laser-pulse duration.
Experimental results showed that displacement ampli-tudes of the rear surface as a function of laser fluence were similar when ultrasound were generated by 80-fs and 270 -ps laser pulses in a common fluence range 共0.1– 0.7 J / cm2兲. Furthermore, it was discovered that the ablation threshold had a modest effect on ultrasound-generation efficiency when 80-fs laser pulses were used to generate ultrasound,
while the effect of the ablation threshold is far more signifi-cant for the 270-ps laser pulses. The signifisignifi-cant influence of the ablation threshold on the surface displacement ampli-tudes for the 270-ps pulse is attributed to the heating of the ejected plasma by the incoming laser pulse, which increases the pressure at the target surface and induces additional mo-mentum to the acoustic pulse. For the 80-fs pulse, this effect does not occur as ablation starts well after the interaction between the laser pulse and the target.
Comparison of the calculated and measured displace-ment amplitudes in the 270-ps case is not straightforward due to large discrepancies in the calculated and measured ablation thresholds. However, a significant break in the sur-face displacement amplitudes as a function of the laser flu-ence was predicted and experimentally observed at the abla-tion threshold for ultrasound generaabla-tion. Moreover, the slopes of the surface displacement amplitudes associated with generation of ultrasound by a 270-ps laser pulse were very similar for both experiments and simulations below and above the ablation threshold.
For the 80-fs pulses, both experiments and simulations showed no 共simulations兲 or relatively modest 共experiments兲 break in the rear surface displacement amplitudes as a func-tion of the laser fluence at the ablafunc-tion threshold. The simu-lations predicted that very high pressures 共a few gigapascal兲 generated at the sample surface by an 80-fs laser pulse would induce strong displacement amplitudes of the rear sample surface. Even when the limited bandwidth of the detection system was included in simulations, displacement amplitudes observed experimentally were much smaller than predicted by simulations. This seems to indicate a significant attenua-tion of the short high-pressure waves generated by ultrashort laser pulses. This strong attenuation was apparently not prop-erly accounted for in the model.
Although several quantitative discrepancies have been observed between simulations and experiments, we believe that the code already encompasses several important features of ultrasound generation using short optical pulses. Improve-ments of the model would include realistic ultrasound ab-sorption mechanisms, which depend on the ultrasound am-plitude and frequency. Moreover, target evaporation below the ablation threshold should also be included in the code to investigate the role of early evaporated matter in triggering the ablation process for the 270-ps laser pulses.
ACKNOWLEDGMENTS
The authors would like to thank François Blanchard, François Poitras, and Stéphane Payeur for their excellent technical assistance as well as Nathalie Perret for her sup-port. A special thanks to Tecnar Automation Ltée, who pro-vided the ultrasound detection laser. This work is supported by a strategic grant from the Natural Sciences and Engineer-ing Council of Canada and the “Fonds Québécois de la Re-cherche sur la Nature et les Technologies.”
1
J.-P. Monchalin, in Review of Progress in Quantitative Nondestructive
Evaluation, Green Bay, Wisconsin, 27 July-1 August, 2003, edited by D. O. Thompson and D. E. Chimenti 共AIP, Melville, NY, 2004兲, Vol. 23A, pp. 3–31.
2
D. A. Hutchins, Ultrasonics generated by pulsed lasers, in Physical
Acous-tics, edited by W. P. Mason and R. N. Thruston 共Academic, San Diego, 1988兲, Vol. 18, pp. 21–123.
3
D. A. Hutchins, Can. J. Phys. 64, 1247 共1986兲.
4
C. B. Scruby and L. E. Drain, Laser Ultrasonics: Techniques and
Appli-cations 共Adam Hilger, Bristol, 1990兲.
5
B. Betz and W. Arnold, J. Phys. Colloq. 44, C6–61 共1983兲.
6
J. A. Smith and K. L. Telschow, in Review of Progress in Quantitative
Nondestructive Evaluation, Brunswick, Maine, 28 July-2 August, 1991, edited by D. O. Thompson and D. E. Chimenti 共Plenum, New York, 1992兲, Vol. 11, pp. 625–630.
7
R. Hrovatin and J. Mozina, J. Appl. Phys. 75, 8207 共1994兲.
8
S. Dixon, C. Edwards, and S. B. Palmer, J. Phys. D 29, 3039 共1996兲.
9
A. Hoffmann and W. Arnold, Appl. Surf. Sci. 96–98, 71 共1996兲.
10
R. J. Conant and S. E. Garwick, in Review of Progress in Quantitative
Nondestructive Evaluation, Brunswick, Maine, 28 July-2 August, 1996, edited by D. O. Thompson and D. E. Chimenti 共Plenum, New York, 1997兲, Vol. 16A, pp. 491–498.
11
T. W. Murray and J. W. Wagner, J. Appl. Phys. 85, 2031 共1999兲.
12
A. Hoffmann and W. Arnold, in Review of Progress in Quantitative
Non-destructive Evaluation, Montreal, Canada 25-30 July, 1999, edited by D. O. Thompson and D. E. Chimenti 共Plenum, New York, 2000兲, Vol. 19A, pp. 279–286.
13
I. Apostol, R. Stoian, R. Dabu, A. Stratan, A. Sebanescu Oasa, and C. Angelescu, SIOEL ’99: Sixth Symposium on Optoelectornics, Bucharest, Romania, 22-24 September, 1999 关Proc. SPIE 4068, 506 共2000兲兴.
14
R. J. Conant and S. E. Garwick, in Review of Pogress in Quantitative
Nondestructive Evaluation, edited by D. O. Thompson and D. E. Chi-menti, 共Plenum, New York, 1997兲, Vol. 16A, pp. 491–498.
15
B. Mi and I. Charles Ume, J. Nondestruct. Eval. 21, 23 共2002兲.
16
B. Le Drogoff, F. Vidal, S. Laville, M. Chaker, T. W. Johnston, O. Bar-thelemy, J. Margot, and M. Sabsabi, Appl. Opt. 44, 278 共2005兲.
17
S. Laville, F. Vidal, T. W. Johnston, O. Barthélemy, M. Chaker, B. Le Drogoff, J. Margot, and M. Sabsabi, Phys. Rev. E 66, 066415 共2002兲.
18
J.-P. Monchalin, R. Héon, P. Bouchard, and C. Padioleau, Appl. Phys. Lett. 55, 1612 共1989兲.
19
A. Moreau and M. Lord, in Nondestructive Characterization of Materials, Boulder, Colorado, 15-20 June, 1997, edited by R. E. Green, Jr. 共Plenum, New York, 1998兲, Vol. VIII, pp. 27–32.
20
F. Blanchard et al., in Review of Progress in Quantitative Nondestructive
Evaluation, Bellingham, Washington, 14-19 July, 2002, edited by D. O. Thompson and D. E. Chimenti 共AIP, Melville, NY, 2003兲, Vol. 22A, pp. 319–325.
21
C. Thomsen, H. T. Grahn, H. J. Maris, and J. Tauc, Phys. Rev. B 34, 4129 共1986兲.
22
G. Eesley, B. Clemens, and C. A. Paddock, Appl. Phys. Lett. 50, 717 共1987兲.
23
T. C. Zhu, H. J. Maris, and J. Tauc, Phys. Rev. B 44, 4281 共1991兲.
24
G. Tas, R. J. Stoner, H. J. Maris, G. W. Rubloff, G. S. Oehrlein, and J. M. Halbout, Appl. Phys. Lett. 61, 1787 共1992兲.
25
O. B. Wright and K. Kawashima, Jpn. J. Appl. Phys., Part 1 32, 2452 共1993兲.
26
B. Bonello, B. Perrin, E. Romatet, and J. C. Jeannet, Ultrasonics 35, 223 共1997兲.
27
A. Moreau, Comparative sensitivities of the piezoreflective and interfero-metric ultrasound detection techniques, NRC-IMI Internal Report No. 2005–109923-G-CNRC.
28
F. Vidal, T. W. Johnston, S. Laville, O. Barthélemy, M. Chaker, B. Le Drogoff, J. Margot, and M. Sabsabi, Phys. Rev. Lett. 86, 2573 共2001兲.
29
F. Vidal, S. Laville, T. W. Johnston, O. Barthélemy, M. Chaker, B. Le Drogoff, J. Margot, and M. Sabsabi, Spectrochim. Acta, Part B 56, 973 共2001兲.
30
S. Laville, F. Vidal, T. W. Johnston, M. Chaker, B. Le Drogoff, O. Bar-thélemy, J. Margot, and M. Sabsabi, Phys. Plasmas 11, 2182 共2004兲.
31
P. P. Pronko, S. K. Dutta, D. Du, and R. K. Singh, J. Appl. Phys. 78, 6233 共1995兲.
32
Q. Shan, A. S. Bradford, and R. J. Dewhurst, Meas. Sci. Technol. 9, 24 共1998兲.
33
D. Du, X. Liu, and G. Mourou, Appl. Phys. B 63, 617 共1996兲.
34
H. K. Wickramasinghe, R. C. Bray, V. Jipson, C. F. Quate, and J. R. Salcedo, Appl. Phys. Lett. 33, 923 共1978兲.
35
H. M. Milchberg, R. R. Freeman, and S. C. Davey, Phys. Rev. Lett. 61, 2364 共1988兲.
36
American Society for Metals, Metals Handbook, Desk ed. 共American So-ciety for Metals, Metals Park, OH 1985兲.