HAL Id: cea-02931915
https://hal-cea.archives-ouvertes.fr/cea-02931915
Submitted on 7 Sep 2020HAL is a multi-disciplinary open access archive for the deposit and dissemination of sci-entific research documents, whether they are pub-lished or not. The documents may come from teaching and research institutions in France or abroad, or from public or private research centers.
L’archive ouverte pluridisciplinaire HAL, est destinée au dépôt et à la diffusion de documents scientifiques de niveau recherche, publiés ou non, émanant des établissements d’enseignement et de recherche français ou étrangers, des laboratoires publics ou privés.
Distributed under a Creative Commons Attribution - NonCommercial - NoDerivatives| 4.0 International License
Mass transfer efficiency in rare earth extraction using a
hollow fiber pertraction device
Moussa Touré, Joseph Chamieh, Guilhem Arrachart, Stéphane
Pellet-Rostaing, Herve Cottet, Jean Duhamet
To cite this version:
Moussa Touré, Joseph Chamieh, Guilhem Arrachart, Stéphane Pellet-Rostaing, Herve Cottet, et al.. Mass transfer efficiency in rare earth extraction using a hollow fiber pertraction device. Separation and Purification Technology, Elsevier, 2020, 251, pp.117330. �10.1016/j.seppur.2020.117330�. �cea-02931915�
1
Mass transfer efficiency in rare earth extraction using a hollow fiber pertraction device. Moussa TOURE1,2, Joseph CHAMIEH3,Guilhem ARRACHART2, Stephane PELLET- ROSTAING2, Hervé COTTET3, Jean DUHAMET1.
1CEA, DES, ISEC, DMRC, Univ Montpellier, Marcoule, France. 2ICSM,
Univ Montpellier, CEA, CNRS, ENSCM, Marcoule, France 3
IBMM, Univ Montpellier, CNRS, ENSCM, Montpellier, France.
Corresponding author: Moussa Toure ([email protected]); Jean Duhamet ([email protected])
Abstract
Extraction of neodymium by N,N-dibutylacetamide (DBAc) has been investigated using a single hollow porous fiber pertraction device. It consists of a polypropylene hydrophobic fibre maintained in a cylindrical glass calender. The Nd loaded aqueous phase flows inside the porous fiber. The organic phase flows outside in the calender and fills the pores of the membrane. Neodymium is extracted by DBAc, transported through the membrane by molecular diffusion and collected in the solvent flow. DBAc was chosen taking into account its efficiency with regard to the extraction of rare earths, estimated initially by liquid-liquid extraction, and because of its low variation of viscosity with metal concentration. Accurate measurements of diffusion coefficient of neodymium in the solvent by Taylor Dispersion Analysis (TDA) confirmed the low influence of the neodymium concentration on its diffusivity. These results, combined with the determination of the distribution coefficient of Nd in DBAc, gave good agreement between experimental and simulated data of pertraction test. Nevertheless, the results showed a high resistance of mass transfer mainly due to the diffusion in membrane. A possible explanation was that the distribution coefficient of Nd was not high enough to ensure a sufficient gradient of concentration along the thickness of the membrane filled by the solvent. To prove it, a second pertraction experiment was performed using HDEHP at 1 mol L-1 in
n-2
dodecane as extractant. In this case, the distribution coefficient of Nd is 3 times higher than for DBAc. Good fitting of experimental data with simulated extraction of neodymium has been obtained and confirm the aforementioned hypothesis which assumes that high mass transfer rate requires high distribution and diffusion coefficients.
Keywords
Pertraction, N,N-dibutylacetamide, Di(2-ethylhexyl)phosphate, Taylor Dispersion Analysis, rare earth recycling.
1. Introduction
Due to their peculiar physico-chemical properties, the rare earth elements (REEs), which include the 15 lanthanides plus scandium and yttrium, are widely used in many high-tech applications (electronics, green energy…) [1-3]. The increasing demand associated to a high supply risk led to considers the REEs as the most critical raw materials group by the western nations (EU and US) [4]. The balance between demand and production do that the REE market is a versatile market [5].
The need of selectively extraction of rare earth elements from mineral ores [6, 7], urban mines (e-wastes) [8, 9], or spent nuclear fuel [10], led to the development of processes [11-14], mainly based on solvent extraction and ion exchange. These processes are the common approaches used in the recovery or removal of metal ions from aqueous solutions.
The extraction of REEs has been carried out mainly by using organophosphorus reagents [15-17], amides [18-20], supramolecular ligand [21-23], multifunctional ligand [24] or synergistic systems [25, 26]. Among them, di(2-ethylhexyl)phosphate (HDEHP) has proved to be versatile due to good loading and stripping properties associated to good kinetics, low solubility in the
3
aqueous phase and high chemical stability [27]. Also, as REEs are considered as hard acids according to Pearson’s HSAB concept [28], they are preferentially bounded by oxygen donor hard bases, such as malonamides [29] and diglycolamides [30]. Indeed, amides are weak bases whose protonation occurs only on the oxygen atom.
Liquid-liquid extraction is the usually employed method for the separation of REEs [31]. Despite its effectiveness, it has some drawbacks such as the use of large volumes of solvent that can increase the environmental footprint of the process, emulsions / third phase formation difficult to break requiring the use of phase modifier.
Therefore, supported liquid membrane have a few advantages over the classical solvent extraction based separation methods [32] . A benefit is that the organic phase volume is reduced and the extraction/stripping steps can be carried out simultaneously, as well as relief of problems such as third phase formation or phase disengagement issues. Nevertheless, the durability of such a membrane over long times is questionable due to the solubility of the organic phase, even when it is low.
The term “pertraction” in the literature refers to different meanings. It may concern the extraction using supported membrane, using liquid membrane or using porous membrane separating an aqueous and an organic phase. In this publication, pertraction consists of a liquid-liquid extraction using a porous membrane barrier as the exchange surface between the aqueous phase and the solvent. It is promising due to its simplicity and cost-effectiveness. This barrier generally consists of porous hollow fibers mounted in a bundle; one of the phases flowing in the fibers while the other flows in the calender of the device. According to the wettability characteristics of the membrane material, aqueous or organic phases fill in the porosity of the membrane and the mass transfer occurs between the two phases in contact at the surface of the pores. With the removal of the step devoted to mixing phases, this methodology allows the use of pure solvent without the constraints of difference in the density or interfacial tension. It is
4
thus possible to use a solvent consisting of a pure extractant with a high solvent loading capacity (greater than 100 g L-1).
However, it is necessary to consider the increase in the viscosity of the extractant phase once in contact with the feed solution, which can penalize the kinetics of mass transfer. Indeed, the diffusivity in the membrane, is inversely proportional to the viscosity of the fluid that govern the transfer and depends on the molecular interaction of the metal with the extractant. In this context, it is important to experimentally determine the molecular diffusion coefficients, both in organic and aqueous phase.
Several methods are reported in the literature for the determination of the diffusion coefficient of rare earth metals, such as pulsed filed gradient nuclear magnetic resonance (PFG-NMR) [33], or electrochemical methods [34]. In this work, we propose, for the first time, the use of Taylor Dispersion Analysis (TDA) [35, 36], as a simple and straightforward method allowing the determination of the molecular diffusion coefficients of the rare earth metals in aqueous and organic phases. TDA is a simple and rapid method based on the analysis of the dispersion profile of a solute plug in an open tube under the influence of a laminar Poiseuille flow. TDA was already applied to characterize different types of samples such as polymers [37-39], proteins [40, 41], nanoparticles [42, 43], micelles and microemulsions [44, 45], but to our knowledge was not applied to rare earth metals. One of the advantages of TDA, besides its simplicity, is that it can be applied in experimental conditions close to real applications.
Recently, rare earth metal extraction has been investigated mainly with organophosphorous reagents as carrier using different technologies [46-50]. Hollow fiber supported liquid membrane system has been investigated by using di-nonyl phenyl phosphoric acid (DNPPA) in
n-dodecane for the extraction of Nd(III) from nitrate solutions [46]. The synergistic extraction
of Nd(III) from nitric acid has been studied using mixtures of DNPPA and tri-n-octylphenyl phosphine oxide (TOPO) as carrier with a surfactant emulsifier in Petrofin as the diluent
5
through emulsion liquid membrane (ELM) [47]. In the same way, the pertraction of Dy(III) from nitric acid medium across ELM was studied using HDEHP as the carrier extractant in kerosene with a binary mixture of surfactants (Span 85/Span 80) as emulsifier [48]. Diluted HDEHP was also investigated in a pseudo-emulsion hollow fiber strip dispersion system for the recovery of Y(III) [49]. Pertraction of Nd(III) from chloride media have been also studied using Cyanex derivatives in kerosene using a microporous polytetrafluoroethylene film as supported liquid membranes system [50].
To the best of our knowledge, the implementation of pertraction system to recover REEs from aqueous solution has not been previously reported by using monoamide compound. The present study aims at investigating the recovery of REEs from nitrate solution using
N,Ndibutylacetamide (DBAc) as the carrier in a pertraction device. In the present study, we
focused our attention on the extraction efficiency from a nitrate media, while nitric acid is commonly used for the leaching of REEs mineral deposit,[51, 52] for all nuclear fuel treatment operations,[53, 54] but also in some cases for the leaching of end of life products that contain REEs such as NdFeB magnets.[55-57]
Solvent extraction experiments using DBAc as extracting agent displayed a high efficiency towards REEs over competitive elements from nitrate solution with a high loading capacity (> 125 g L-1) [58]. Moreover, DBAc exhibits physico-chemicals properties such as a low solubility
in water (0.6 %), interfacial tension allowing “quasi-stable emulsion” formation (3.4 mN.m-1)
and a moderate viscosity (< 5 mPa s), which makes it possible to use it as pure solvent in the pertraction experiments.
Therefore, pertraction experiments were performed on a single fiber hollow in order to analyze and model the mass transfer in the case of the extraction of Nd(III) by pure DBAc in comparison to dilute HDEHP.
6
2. Materials and methods 2.1. Materials and reagents
N,N-dibutylacetamide (DBAc) is a commercially available product (CAS 1563-90-2).
However, in order to avoid delivery delays, the price and the purity of the product, we synthesized the DBAc at scale semi-pilot scale (≈ 1L) in good yields (>90%). The general procedure for the DBAC synthesis and it characterization are reported in supporting information. In the various experiments, pure DBAc (4.79 mol L-1) was used as organic phase. Di(2-ethylhexyl)phosphate (HDEHP) was of analytical grade and purchased from SigmaAldrich. In the various experiments, HDEHP dilute in dodecane (1 mol L-1) was used as organic phase. The chemical structure of the extractant is illustrated in the Fig 1.
Fig 1. Chemical structure of the extractant studied.
Metallic stock solutions were prepared at the desired acidity from Nd(NO3)3∙ 6H2O (99.9%,
ACROS Organics), Dy(NO3)3∙ 6H2O (99.9%, ACROS Organics), Pr(NO3)3 (99.9%, ACROS
Organics), Fe (via Fe(NO3)3∙ H2O (99.9%, ACROS Organics), Co(NO3)2 (99.9%, ACROS
Organics), Ni(NO3)2 (99.9%, ACROS Organics), H3BO3 (99.9%, ACROS Organics). Nd(III)
stock solutions (1 – 35 g L-1) were prepared, at the desired acidity (typically HNO3 0.1 mol L1)
with or without NaNO3 (2.5 mol L-1).
A multi-elementary solution containing 0.3 g L-1 of Nd, 0.3 g L-1 of Dy, 0.3 g L-1 of Pr, 0.3 g L
-1 of Fe, 0.3 g L-1 of Co, 0.3 g L-1 of Ni and 0.2 g L-1 of B was prepared in an aqueous solution
7
To evaluate the efficiency properties of DBAc towards Nd and rare earth elements (Nd, Dy, Pr) from the multi-elementary solution, experiments were performed under batch conditions at organic (O) over aqueous phase (A) ratio of 1. For this purpose, pure DBAc (4.79 mol L-1) was
used as organic phase. The two phases were mixed and stirred for 30 minutes at room temperature (22 ± 3 °C). A preliminary study on the phase transfer kinetics indicated that equilibrium was reached quickly under batch conditions. As the equilibrium values after 5 minutes changed no further during up to 60 minutes of shaking, a 30 min shaking-time was therefore used in the experiments to ensure thermodynamic equilibrium. After separation by centrifugation (3000 rpm for 5 min), the aqueous phases were collected and analyzed by ICPAES.
Metal concentrations were measured by inductively coupled plasma/atomic emission spectroscopy (ICP-AES) using a SPECTRO ARCOS spectrometer.
In the extraction experiment, the distribution coefficients of the metals (kD), extraction
efficiency (%E) and the separation factor (β) were computed from the ICP-AES results and calculated from the equation (1), (2), (3) as follows:
eq i eq org aq aq D eq eq aq aq M M M k M M (1) (2) (3)Where is the metal concentration in solvent and is the metal concentration in aqueous phase at equilibrium and the initial concentration of the metal in the feed aqueous
8
solution, A and O are the volumes of the aqueous and the solvent phases, kDM1 and kDM2 are the
distribution coefficients of the metal ions M1 and M2, respectively.
Stripping experiments were performed at room temperature (22 ± 3 °C) by contacting the loaded organic phase with pure water (Milli Q) or with a 3M nitric acid solution during 30 minutes (aqueous to organic phase volumetric ratio Vst/VO of 1). After separation by
centrifugation (3000 rpm for 5 min), metal concentrations were measured in the aqueous phase by ICP-AES. The stripping percentage (%S) was calculated as follows:
(4)
where [M]st and [M]org are the concentrations of the metal ions in the stripping aqueous phase
after stripping and in the loaded organic phase before stripping, respectively.
All rheological measurements were performed using an AMVn automated micro-viscometer (Anton Paar, Graz, Austria). The apparatus measures viscosities using the rolling ball/falling ball principle, which consists of measuring ball-rolling time in a diagonally-mounted glass capillary filled with the sample. All measurements were made at 20.00 °C with a 70° inclination angle of the capillary.
2.2. Taylor dispersion analysis
TDA experiments were performed on a 7100 CE Agilent (Waldbronn. Germany) instrument using fused silica capillaries (Polymicro technologies. USA) having 100 cm × 100 µm i.d. dimensions and a detection window at 91.5 cm. Solutes were monitored by UV absorbance at 585 nm. TDA experiments were carried out using 100 mbar mobilization pressure for aqueous phase and 1000 mbar for organic phase and using the frontal mode (i.e. the Neodymium sample is injected continuously during the whole analysis time). New capillaries were first conditioned with 1 mol L-1 NaOH for 20 min and water for 10 min and finally flushed with the matrix for
9
10 min. The operating temperature was set to 25°C. Each sample was prepared in the matrix (aqueous or organic phase without Neodymium). Before sample analysis, the capillary was previously filled with the matrix to keep the viscosity in the capillary constant.
2.3. Pertraction setup
The pertraction device (Fig 2) is a single hollow fiber contained in a cylindrical glass tube of 4 mm internal diameter. At both ends, stainless steel parts with seals ensure a separate flow of the fluids between the inside and the outside of the fiber i.e. the calender.
The fiber has a 25 cm useful length for mass transfer. It is made of polypropylene membrane provided by Microdyn-Nadir with pores of about 200 nm and a thickness of 400 µm. The fiber as an internal diameter of 1.8 mm. The porosity is 72 % (measured by mercury porosimetry). The tortuosity of the membrane is around 2 (manufacturer data). It is defined as the square of the ratio of the average distance between two points along the paths defined by the pores over the shortest distance between these two points.
Fig 2. Pertraction device. Top and bottom parts have been designed to ensure the separation of the aqueous and organic phases without leak. Blue region represents the aqueous phase containing Nd(III) and yellow one is the organic phase.
10
The setup designed for the experiments is illustrated in Fig 3. Both phases flow in closed loop. The aqueous phase (blue) is cycled in the fiber while the organic phase (yellow) is cycled in the calender side. As the fiber is hydrophobic, the organic phase fills the pores of the fiber. A co-current mode was chosen for the pertraction experiments. The device stands in upright position and the phases are introduced at the bottom and go up. On output, the phases go through weirs. The aqueous weir is located higher than the organic one to ensure a counter pressure to avoid organic phase entrainment in the aqueous phase.
Fig 3. Experimental pertraction setup in closed loop and co-current mode. The aqueous phase tank contains the Nd(III) aqueous phase (in 0.1M nitric acid solution). The organic phase is composed of the pure extractant (DBAc) or HDEHP diluted at 1 M in dodecane.
During the pertraction experiment, regular sampling is carried out in order to monitor the evolution of the Nd concentration of the aqueous phase by ICP-AES analyses. Thus,
11
No evolution of the polypropylene hydrophobic hollow fibers have been observed during the experiments.
2.4. Theoretical aspects on TDA
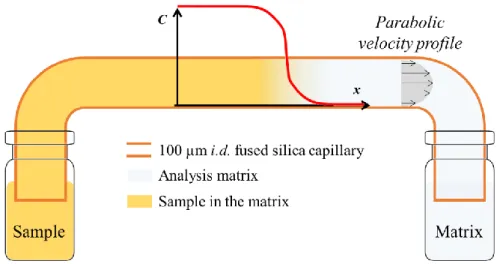
Taylor dispersion analysis is a simple and absolute method allowing the determination of the molecular diffusion coefficient and of the hydrodynamic radius of a given molecule. It is based on the analysis of the peak broadening of an injected solute plug in an open capillary tube and under a laminar Poiseuille flow [35] (Fig 4. Schematic representation of the Taylor dispersion analysis experiment using frontal mode, where the sample is injected continuously throughout the analysis. ). The elution profile is generally obtained by online UV detection through the capillary tube. When the injected sample is monodisperse in size a Gaussian shaped peak is obtained for the elution profile, as given by equation (5):
(5)
where t0 is average elution time and σ2 is the temporal variance of the elution profile and S0 is a
constant that depends on the response factor and injected quantity of solute. The peak variance is obtained by fitting the experimental data with equation (5) to obtain the molecular diffusion coefficient D of the sample and its hydrodynamic radius using equation (6):
(6)
where kB is the Boltzman constant. T is temperature (in K). Rc is the capillary radius and ƞ is
the viscosity of the matrix. To increase the sensitivity of detection, TDA can be implemented in frontal mode. In that case, the sample is continuously injected in the capillary leading to the
12 detection of a front instead of a peak and the experimental data are fitted with a Gaussian error equation (erf), as expressed by equation (7):
0 1 1 2 2 2 R S t t t erf S t (7)where the first derivative of equation (7) leads to equation (5). Equations (5-7) are valid when two conditions are fulfilled. First, the average elution time, t0, should be much longer than the
characteristic diffusion time of the solute in the cross section of the capillary, i.e. t0 ≥ 1.25
2
c
R Dfor a relative error ε on the determination of D lower than 3% [59]. Second, the axial diffusion should be negligible compared to convection (i.e. when the Peclet numberPe R u Dc
is higher than 40 for lower than 3% [59, 60] where u is the linear velocity.
Fig 4. Schematic representation of the Taylor dispersion analysis experiment using frontal mode, where the sample is injected continuously throughout the analysis.
2.5. Theoretical aspects on pertraction
Nd is extracted at the pores of the membrane by the extractant molecule, transported through the membrane by molecular diffusion and collected in the solvent flow. Assuming that the
13 amount of neodymium accumulated in the membrane is negligible, the mass balance described following equation (8) allows to evaluate the concentration of Nd in the solvent:
1 1 1 n e Pe i Pe n n i AX V X A n V X OY
(8)where A and O are the volumes of the aqueous and the solvent phases, respectively. The variation of A and O (related to the transfer of acid and water in the solvent or to the solubility of the solvent in the aqueous phase) during the extraction process is considered as negligible.
VPe is the volume of samples for ICP-AES analysis.
Xe (or [M] aqi ) and Ye (or [M] orgi ) are respectively the initial concentrations of the metal in the
aqueous phase and in the solvent (g L−1). The solvent does not initially contain metal. So Ye =
[M] orgi = 0 g L-1.
The concentration of the metal in the solvent (Yn or [M] org ) is expressed by equation (9):
1 1 1 n Pe Pe n e i n i A n V V A Y X X X O O O
(9)From the flow rates of the aqueous and solvent phases, and their intrinsic hydrodynamic properties, different adimensional numbers and other process variables can be expressed to define the hydrodynamics in the pertraction device.
The average velocity of a fluid u (m s-1) is determined by the ratio between the flow rate Q (m3 s-1) and the section S of the pipe (m2).
Aqueous phase inlet Aqueous phase outlet Samples from the aqueous tankSolvent phase outlet
14 Q
u S
(10)
The Reynolds number (Re) is a adimensional number that distinguishes the laminar (Re < 2000), intermediate (2000 < Re < 3000) and turbulent (Re > 3000) flow regimes of a fluid. It is expressed by:
Re ud
(11)
with ρ the density of the fluid (kg m-3) ; d the diameter of the pipe (m) and η the dynamic
viscosity of the fluid (Pa s). Flow rate of phases for our studies gives a laminar flow regime in the fiber and in the calender, with very low Reynolds number values (of the order of 7). For a fluid in laminar flow in a cylindrical pipe, the height of the pressure loss associated to the Re can be expressed by:
2 2 u L h gd (12)
where h corresponds to a height (m) of pressure; L is the length of the pipe (m); and g is the
acceleration of gravity (m s-2).
λ is the coefficient of the pressure loss. It is expressed by:
64 Re
(13)
The pressure loss is expressed by:
J gh (14)
with J the pressure loss (Pa), ρ the density of the fluid (kg m-3) and h the previously expressed height (m).
The Péclet (Pe) number is an adimensional number which is expressed by the ratio of the transport of a metal by convection on its transport by diffusion in a pipe:
.
L u Pe
D
15
To study the transfer kinetics of Nd, a mass transfer model already described in ref. [61] has been used. It is an axisymmetric model based on the hypothesis of a hydrophobic membrane with a convective transport in the fiber and the calender. The transfer of the solute at the interface is governed by kD. Minor adaptations were made to account closed loop operation on
both phases and sampling at selected intervals of aqueous phase which decreases aqueous volume. This model was used to estimate the transfer coefficient of Nd in the aqueous side film (ka), in the membrane (km) and in the organic side film (ks).
To calculate the Nd concentration in the reservoirs (solvent, aqueous phase), the implementation of the model required input data such as the geometrical parameters of the module and the process parameters including the diffusion coefficient of the Nd complexes in the aqueous and solvent phases.
3. Results and discussions
3.1. Efficiency of the DBAc towards Nd extraction
A preliminary study was investigated in order to evaluate the efficiency of the DBAC to extract Nd as well as the recovery of the Nd and consider the recyclability of the organic DBAC phase. Extraction experiments have been implemented in test tubes involving pure DBAC (4.79 mol L-1) as organic phase and an aqueous solution at 0.1 M HNO3 – 2.5 M NaNO3 containing 1 g/L
of Nd. The distribution coefficient of Nd extraction reached a value 16 after mixing an equal volume of aqueous and organic solutions at 25 °C indicating that this system is highly efficient. Also, it was observed that the distribution values decreased sharply with a slight increase in the nitric acid concentration from 0.1 M (kDNd= 16.0) to 3 M (kDNd= 0.08) allowing to consider a
stripping step using nitric acidic solution with concentration ≥ 3M.
After the extraction step with DBAC, the loaded organic solution contain, respectively, about 94% of the Nd initially present in the feed nitric acid solution. Stripping or back-extraction
16
experiments were implemented to strip Nd quantitatively from the organic phases using concentrate nitric acidic solution (HNO3 3M) as well as pure water (MilliQ) with an aqueous
stripping solution to organic ratio of 1. Both solutions showed promising results, which allow to recover the Nd up to 99% (kDNd= 0.01) and 93% (kDNd= 0.07) of recovery respectively with
the nitric acid solution and pure water.
3.2. Selectivity of DBAc towards rare earth elements
To consider the selectivity of the DBAc to extract the rare earth elements an aqueous multielement solution was proposed based on elements that can be found in leachate of NdFeB magnet. However, identical concentrations of the rare earth elements were chosen to evaluate on the one hand the selectivity with respect to competing metals but also if a separation of rare earths between them was also possible. Pure DBAc (4.79 mol L-1) was used as organic phase
which was put in contact with an aqueous solution containing a mixture of 0.1 mol L-1 of HNO3
and 0.5 to 3 mol L-1 NaNO3, in order to study the effect of salting-out agent on the extraction
of metallic species with DBAc. Table 1 shows the comparison between elements extraction with respect to the variation of the kD values as a function of the NaNO3 concentration.
Table 1 kD values of Nd, Pr, Dy, Fe, Co, Ni, B at 0.1 mol L-1 of HNO3 as a function of the concentration
of the NaNO3.
[NaNO3] Distribution coefficients kD
(mol L-1) Nd Pr Dy Fe Ni Co B 0.5 0.6 0.6 0.3 0.2 0.2 0.01 0.5 1 1.8 1.8 0.9 0.5 0.6 0.05 0.5 2 5.1 4.9 3.0 1.0 0.07 0.08 0.5 2.5 8.1 7.7 5.0 1.5 0.1 0.1 0.5 3 12.1 11.4 8 2.2 0.1 0.1 0.5
The increase in nitrate NO
-3 concentration up to 3 mol L-1 (last line of the table) favors the
extraction of rare earth elements (kD (Nd) = 12.1 , kD (Pr) = 11.4 , kD (Dy) = 8) compared to
17
range of NO-3. Salting-out agent is one of the major parameters that influences neutral
extractants on the extractability, they have been assumed to act by increasing the activity of metal ions and improving the formation of neutral nitrate.[62, 63] The increase in distribution coefficient with an increase in the concentration of nitrate ions in the aqueous phase supports that nitrate ions are coextracted during the equilibration and that they are present in the metalsolvate formed. Therefore, the main effect is probably due to a preferential extraction of metalnitrate, as compared to their possible hydrates.[64, 65]
The kD values were used to calculate the separation factor (β) between rare earth elements and
between Nd and the other elements (Fe, Co, Ni, B). These results are summarized in Table 2.
These results confirm the ability of DBAc to selectively extract rare earth element towards competitive metals that can be found in leachate of permanent magnet at 3 mol L-1 of NO-3 (last
line of Table 2: β (Nd/Co) = 90, β (Nd/Ni) = 116, β (Nd/Fe) = 5.4, β (Nd/B) = 23.6).
Table 2 Separation factor β values between rare earth elements and between Nd and the other elements (Fe, Co, Ni, B) at 0.1 mol L-1 of HNO
3 as a function of nitrate concentration NO-3.
[NaNO3] β
(mol L-1) Nd/Pr Nd/Dy Pr/Dy Nd/Fe Nd/Ni Nd/Co Nd/B
0.5 1.0 2.2 2.1 3.8 2.7 51.7 1.2 1 1.0 2.0 1.9 3.6 2.7 36.0 3.6 2 1.0 1.7 1.7 5.3 71 62 10.1 2.5 1.06 1.6 1.5 5.5 83 72 15.3 3 1.07 1.5 1.4 5.4 116 90 23.6
The extraction is also selective towards light and heavy rare earth depending on the nitrate concentration. When NaNO3 0.5M is used, separation factors are respectively β (Nd/Pr) = 1.04,
18
It was shown that the necessary energy required to dehydrate the rare earth is improved with increasing atomic number and decreasing ionic radii [66, 67], which in connection with the salting-out effect can explain these observations.
3.3. Taylor dispersion analysis
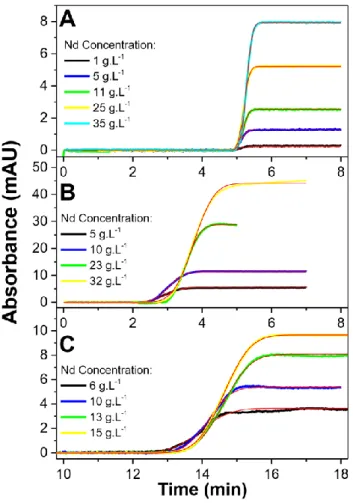
Fig 5 shows the dispersion fronts of Nd at different concentrations from 1 to 35 g/L in different matrices (0.1 mol L-1 HNO3 + 2.5 mol L-1 NaNO3 aqueous phase (Fig 5A), pure DBAc (Fig
5B), and 1 mol L-1 HDEHP in n-dodecane (Fig 5C)). Different elution times t
0 from 3.5 min (Fig
5B) up to 15 min (Fig 5C) were obtained depending on the viscosity of the matrices.
Fig 5. Overlay of fronts obtained by TDA for Nd solutions at different concentrations prepared in (A) the aqueous phase (0.1 mol L-1 HNO
3 + 2.5 mol L-1 NaNO3), (B) pure DBAc and (C) 1 mol L-1 HDEHP
in n-dodecane. Experimental conditions: fused silica capillary 100 cm (91.5 cm to detector) × 100 µm i.d. Mobilization pressure: (A) 100 mbar, (B) 1000 mbar and (C) 100 mbar. UV detection at 585 nm.
19
Temperature: 25°C. Red lines are the theoretical fits obtained by adjusting equation (13) to the experimental traces.
These results prove the opportunity to employing TDA and a UV detector to measure the diffusion of Nd in nitric and organic medium (DBAc or HDEHP). Fig 6 shows the diffusion coefficient values calculated as a function of Nd concentration in the aqueous phase (0.1 mol L-1 HNO3 + 2.5 mol L-1 NaNO3) (Fig 5A), or in organic phase such as pure DBAc (Fig 5B) or
in 1 mol L-1 HDEHP in n-dodecane (Fig 5C).
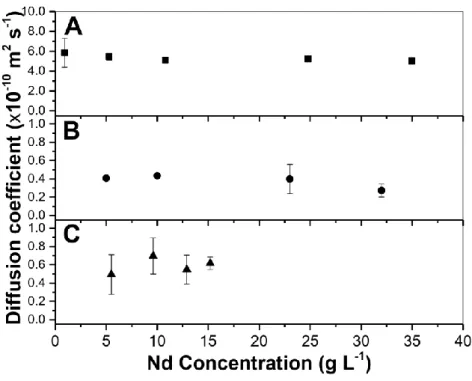
Fig 6. Calculated molecular diffusion coefficients for the fronts displayed in Fig 5. (A) Nd in the aqueous phase (0.1 mol L-1 HNO
3 + 2.5 mol L-1 NaNO3), (B) Nd in pure DBAc and (C) Nd in 1 mol L-1 HDEHP
in n-dodecane. Error bars are +/- one SD on 3 repetitions. Viscosity variation of Nd solution with the Nd concentration is presented in Fig. 7.
The diffusion coefficient of Nd in the aqueous phase decreases slightly from 5.8 × 10 -10 m2 s1
to 5.0 × 10⁻¹⁰ m2 s-1 between 1 and 35 g L-1 of Nd (see Fig 6A). These diffusion coefficient values determined by TDA are of the same order of magnitude as the diffusion coefficient of
20
Nd in water calculated by the Nernst Einstein equation. The values are also of the same order of magnitude as the published diffusion coefficient value of Nd in water [68].
In organic medium (DBAc or HDEHP), Fig 6B shows a decrease in the diffusion coefficient of Nd from 4.07×10⁻¹¹ m2 s-1 to 2.7×10⁻¹¹ m2 s-1 between 5 and 32 g L-1 Nd in correlation with the viscosity increase from 9 to 14 mPa s.
Unlike the DBAc - Nd system, Fig 6C displays a slight variation in the Nd diffusion coefficient in the range of 4.9-6×10-11 m2 s-1 between 6 and 15 g L-1 of Nd in HDEHP. This could be explained by a very small variation in the viscosity of HDEHP [3.3 - 3.5] mPa s with its Nd load. In all cases, the statistical analysis of the data was realized using Fisher's least significant difference (LSD) procedure in order to determine which means are significantly different from which others. It was shown that there were no statistically significant differences between any pair of means at the 95.0% confidence level. In other words, the diffusion coefficient of Nd did not change significantly within the studied concentration range in each selected solvent. The variation of the viscosity with Nd concentrations in all the studied media is illustrated in Fig. 7.
21
Fig 7. Variation of the dynamic viscosity of pure DBAc (■), of 1 mol L-1 HDEHP in n-dodecane (▲)
and of the aqueous phase (HNO3 0.1 M+ NaNO3 2.5 M) (●), with the neodymium concentration. Error
bars on x and y axes are calculated based on RSD values of 5%.
These diffusion coefficient values determined by TDA and a UV detector were used as input parameters in the modeling of mass transfer in the pertraction device. If diffusion coefficient values exist in the aqueous phase literature, it was not possible for us to find Nd diffusion coefficient values in the organic phases studied in this work.
3.4. Mass transfer studies in Pertraction of Nd by DBAc and HDEHP 3.4.1. Pertraction of Nd by DBAc
The Nd pertraction experiments from an aqueous phase containing 1 g L-1 of Nd, 0.1 mol L-1 of HNO3 and 2.5 mol L-1 of NaNO3were firstly implemented by using pure DBAc (4.79M) and
the device as described in Fig 2.and Fig 3.The hydrodynamic and thermodynamic parameters of the process are summarized in Table 3.
Table 3 Hydrodynamic and thermodynamic parameters of the Nd pertraction by DBAc. Qaq = Qorg = 40
mL h-1, A = 22 mL, O = 20.7 mL. DBAC kD = 16 Reservoir residence time (min)
Peclet Number Reynolds Number Loss of pressure
(bar)
Aqueous phase 33 1,870,000 7.4 13.1×10⁻⁵
Organic phase 31 6,810,000 0.2
16.7×10⁻⁵
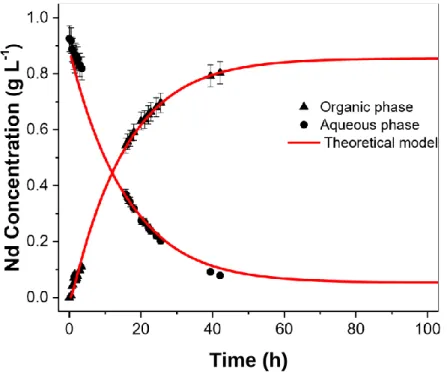
The experiment took place in 4 days in co-current mode. 22 samples were taken and analyzed to realize the variation of the concentration of Nd in the aqueous phase and in the DBAc as a function of time. Fig 8. shows the impoverishment of the reservoir of aqueous Nd phase during the process. The experimental results are represented by black dots and the data from the
22
numerical simulation by red lines. The results of the simulation are in good agreement with the experimental data only by adjusting the tortuosity coefficient of the membrane to 4.5.
Time (h)
Fig 8. Pertraction of Nd by pure DBAc. Variation of the concentration of Nd in the aqueous phase and in the DBAc as a function of time (black dots). Qaq = Qorg = 40 mL h-1, A = 22 mL, O = 20.7 mL, kD =
16, Daq = 5.8×10⁻¹⁰ m2 s-1, Dorg = 3.7×10⁻¹¹ m2 s-1, tortuosity = 4.5
The DBAc is gradually loaded in Nd during the process for a equilibrium achieved from 97 h of test corresponding to a partition coefficient of 16. This shows the possibility of a transfer of Nd from an aqueous nitrate load through the pores of a macroporous membrane filled with pure DBAc. However, this transfer of Nd has relatively slow kinetics since it takes 4 days to reach equilibrium. The value of the diffusion coefficient of Nd in the solvent contained in the pores of the membrane (Dm) is used as the only adjustment parameter in the simulation of the mass
transfer for correctly take into account the Nd accumulation in the solvent contained in the pores of the membrane (Fig. 9).
According to equations detailed in [69] for transfer coefficients and transfer resistances, the Nd transfer coefficient in the aqueous phase side film, in the solvent side film, and in the pores of
23
the membrane have been calculated and estimated to 2.1 × 10 -6 m s-1, 2.9 × 10⁻⁷ m s-1 and 2.5 × 10⁻⁷ m s-1, respectively.
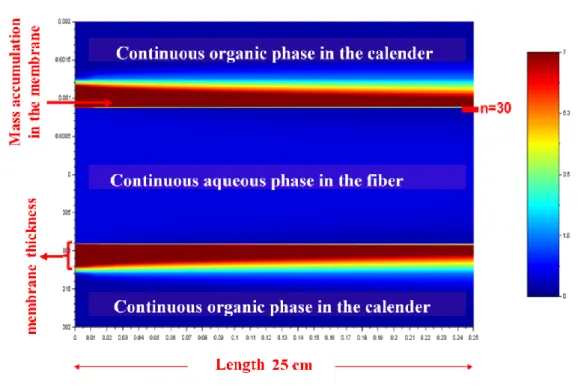
Fig 9. Illustration of Nd accumulation in DBAc contained in the pores of the polypropylene membrane with thickness e = 400 μm. Conditions: pure [DBAc]; [Nd]ini = 1 g L-1; kD = 16; n is the number of
discretization steps in the calender and along the fiber.
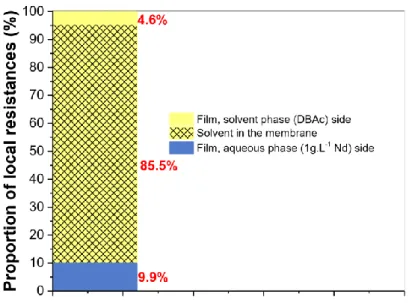
These values made it possible to evaluate the transfer resistance of the Nd in the aqueous phase side film at 4.6×10⁵ s m-1 in the solvent side film at 2.1 × 10⁵ s m-1, in the pores of the membrane at 4.0 × 10⁶ s m-1. These numerical values lead to an overall transfer resistance of
4.70 × 10⁶ s m-1. Fig 10 shows the repartition of each local resistance in the overall Nd transfer
resistance. Resistance to Nd transfer in DBAc contained in the pores of the membrane (85.5 %) is higher than the resistance in the aqueous side (9.9%) and solvent side (4.6%) films. These results show that a transfer mechanism of the Nd is controlled by its diffusion in the DBAc contained in the pores of the membrane. The lack of diffusion of Nd could be explained by an increase in the viscosity of DBAc with the Nd concentration, leading to a string decrease in the Nd diffusivity, as demonstrated by TDA in the section 3.3. Correlatively, the Nd distribution
24
coefficient is not high enough to generate a high concentration gradient in the membrane, which would lower the mass transfer resistance in the membrane.
Fig 10. Representation of the local resistances in the 100% of the overall resistance to Nd transfer. Aqueous phase = 1 g L-1 of Nd + 0.1 mol L-1 of HNO
3 + 2.5 mol L-1 of NaNO3, Solvent = 4.79 mol L-1
of DBAc, Qaq = Qs = 40 mL.h-1, A = 22 mL, O = 20.7 mL.
These results show that the good solvent for the pertraction process is a solvent which gives a high partition coefficient (kD >>1) of the solute but whose solute load does not lead to a
significant increase in its viscosity. To prove this rationale, the HDEHP was selected for its high Nd partition coefficient and for the low influence of its Nd load on its viscosity.
3.4.2. Pertraction of Nd by HDEHP
The Nd pertraction was then studied using HDEHP at a 1 mol L-1 concentration in dodecane from aqueous phase containing 1 g L-1 of Nd, 0.1 mol L-1 of HNO3 using the same the device
used and process. The hydrodynamic and thermodynamic parameters of the process are provided in Table 4.
Table 4 Hydrodynamic and thermodynamic parameters of the Nd pertraction by [HDEHP] = 1 mol L-1
25 HDEHP 1M L-1 k D = 47.5 Reservoir residence time (min)
Peclet Number Reynolds
Number
Loss of pressure (bar)
Aqueous phase 24 1,870,000 7.3 13.1×10⁻⁵
Organic phase 22 5,610,000 18 6×10⁻⁵
13 samples were taken and analyzed to realize the variation of the concentration of Nd in the aqueous phase and in the [HDEHP] = 1 mol L-1 in dodecane as a function of time. Fig 11shows
the impoverishment of the reservoir of aqueous Nd phase during the process. The experimental results are represented by black dots and the data from the numerical simulation by red dots. The results of the simulation are in good agreement with the experimental data with the same adjustment of the tortuosity coefficient to 4.5.
Fig 11. Pertraction of Nd by [HDEHP] = 1 mol L-1 in dodecane. Variation of the concentration of Nd in
the aqueous phase and in the HDEHP as a function of time (black dots). Qaq = Qorg = 40 mL h-1, A = 16.2
mL, O = 15.2 mL, kD = 47.5, Daq = 5.8×10⁻¹⁰ m2 s-1, Dorg = 5.8×10⁻¹¹ m2 s-1, tortuosity = 4.5
Unlike DBAc, the HDEHP gradually charges in Nd for a equilibrium achieved from only 19 hours of the process corresponding to a partition coefficient of 47.5. The Nd transfer coefficient in the aqueous phase side film in the solvent side film and in the pores of the membrane are
26
calculated to be 2.10-6 m.s-1 ; 3.9×10⁻⁷ m.s-1 et 1.1×10⁻⁶ m.s-1 respectively. These values made it possible to evaluate the transfer resistance of the Nd in the aqueous phase side film at 4.8.105 s.m-1, in the solvent side film at 5.4 × 10⁴ s.m-1 in the pores of the membrane at 8.7 × 10⁵ s.m-1
and deduce an overall transfer resistance of 1.4 × 10⁶ s m-1. Fig 12 shows the share of each local
resistance in the overall Nd transfer resistance.
Fig 12. Pertraction of Nd by [HDEHP] = 1 mol L-1 in dodecane. Variation of the concentration of Nd in
the aqueous phase and in the HDEHP as a function of time (black dots).
Resistance contribution to Nd transfer in the HDEHP contained in the pores of the membrane (61.8%) is reduced compared to DBAc even it is still higher than the resistance in HDEHP contained in the aqueous side (34.3%) and the resistance in the solvent-side film (3.8%). As expected, the high distribution coefficient leads to high concentration gradient in the membrane, which ensures a lower mass transfer resistance. These results show that the Nd transfer mechanism is also controlled by its diffusion in the aqueous phase side film. The limitation of the diffusion flux in the film on the aqueous side could be explained by a concentration gradient defect due to the depletion of the aqueous phase by the presence of a large partition of the Nd at the interface (kD = 47.5). These results demonstrate that sustainable kinetics is obtained in
27
the case of a solvent which gives a high partition coefficient (kD >> 1) of the solute but whose
solute load does not lead to a significant increase in its viscosity.
CONCLUSION
This study demonstrated that Taylor Dispersion Analysis (TDA) can be beneficially used for the experimental determination of the molecular diffusion coefficients of Nd or other rare earth elements (REEs) in aqueous and organic phases, which are necessary for modeling the mass transfer through pertraction monofiber. The following conclusions are highlighted:
- The first step of the study consisted of solvents screening based on three main criteria such as the affinity for rare earth elements including Nd, viscosity, solubility in aqueous phase and flash point for the process safety. By this approach, N, N-Dibutylacetamide (DBAc) was selected as a specific solvent for rare earth elements recovery. The system used exhibits promising results with regard to the extraction of REEs (Nd, Pr, Dy) from iron, boron, cobalt and nickel as competitive metals which can be encountered in NdFeB magnet waste.
- Mass transfer modeling through a porous membrane requires the knowledge of the diffusion coefficient of the solute in the two phases. Therefore, the second step in our study was the identification of a method allowing the experimental determination of the diffusion coefficient of neodymium in the aqueous phase and in the DBAc. In this context, Taylor Dispersion Analysis, an absolute technique, was chosen and the conditions leading to diffusion coefficient values in aqueous and organic phase have been defined during our study.
Finally, a study combining experience and modeling of Nd transfer kinetics in a hydrophobic and porous hollow fiber membrane extraction device was carried out using pure DBAc or HDEHP in n-dodecane, in order to study the influence of the distribution coefficient of Nd at the interface on the resistance to mass transfer in the membrane. The results shown the
28
advantage of using a solvent which highlight high distribution coefficient for the considered metal in order to limit the resistance to transfer into the membrane by obtaining a strong concentration gradient. However, this only remains valid if the viscosity of the solvent in the membrane does not increase too much, which could lead to a sharp decrease in the diffusion coefficient of the metal.
The experiments were conducted on a single fiber to simplify the system but it cannot be directly applied to an industrial process. In this case, a multi-fiber device should be applied with a thinner membrane thickness to increase the mass transfer kinetics; however, the principles implemented here can be +useful for sizing and calculation of the mass transfer efficiency.
REFERENCE
[1] E. Alonso, A.M. Sherman, T.J. Wallington, M.P. Everson, F.R. Field, R. Roth, R.E. Kirchain, Evaluating Rare Earth Element Availability: A Case with Revolutionary Demand from Clean Technologies, Environ. Sci. Technol. 46 (2012) 3406-3414. https://doi.org/10.1021/es203518d.
[2] A.R. Chakhmouradian, F. Wall, Rare Earth Elements: Minerals, Mines, Magnets (and More), Elements 8 (2012) 333-340. https://doi.org/10.2113/gselements.8.5.333.
[3] V. Zepf, Chapter 1 - An Overview of the Usefulness and Strategic Value of Rare Earth Metals, in: I. Borges De Lima, W. Leal Filho (Eds.) Rare Earths Industry, Elsevier, Boston, 2016, pp. 3-17.
[4] Study on the review of the list of Critical Raw Materials, European Commission2017.
[5] K. Binnemans, P.T. Jones, Rare Earths and the Balance Problem, Journal of Sustainable Metallurgy 1 (2015) 29-38. https://doi.org/10.1007/s40831-014-0005-1.
[6] J. Demol, E. Ho, K. Soldenhoff, G. Senanayake, The sulfuric acid bake and leach route for processing of rare earth ores and concentrates: A review, Hydrometallurgy 188 (2019) 123-139. https://doi.org/10.1016/j.hydromet.2019.05.015.
[7] C.R. Cánovas, S. Chapron, G. Arrachart, S. Pellet-Rostaing, Leaching of rare earth elements (REEs) and impurities from phosphogypsum: A preliminary insight for further recovery of critical raw materials, Journal of Cleaner Production 219 (2019) 225-235.
https://doi.org/10.1016/j.jclepro.2019.02.104.
[8] K. Binnemans, P.T. Jones, B. Blanpain, T. Van Gerven, Y. Yang, A. Walton, M. Buchert, Recycling of rare earths: a critical review, Journal of Cleaner Production 51 (2013) 1-22. https://doi.org/10.1016/j.jclepro.2012.12.037.
[9] S.M. Jowitt, T.T. Werner, Z. Weng, G.M. Mudd, Recycling of the rare earth elements, Current Opinion in Green and Sustainable Chemistry 13 (2018) 1-7.
https://doi.org/10.1016/j.cogsc.2018.02.008.
[10] A. Leoncini, J. Huskens, W. Verboom, Ligands for f-element extraction used in the nuclear fuel cycle, Chem. Soc. Rev. 46 (2017) 7229-7273. https://doi.org/10.1039/c7cs00574a.
[11] C.K. Gupta, N. Krishnamurthy, Extractive metallurgy of rare earths, Int. Mater. Rev. 37 (1992) 197248. https://doi.org/10.1179/imr.1992.37.1.197.
29
[12] M.L.P. Reddy, T. Prasada Rao, A.D. Damodaran, Liquid-Liquid Extraction Processes for the Separation and Purification of Rare Earths, Miner. Process. Extr. Metall. Rev. 12 (1993) 91-113. https://doi.org/10.1080/08827509508935254.
[13] F. Xie, T.A. Zhang, D. Dreisinger, F. Doyle, A critical review on solvent extraction of rare earths
from aqueous solutions, Miner. Eng. 56 (2014) 10-28.
https://doi.org/10.1016/j.mineng.2013.10.021. [14] N. Krishnamurthy, C.K. Gupta, Extractive Metallurgy of Rare Earths, 2nd ed., CRC Press, Boca Raton, 2015.
[15] J.M. Sanchez, M. Hidalgo, V. Salvadó, M. Valiente, Extraction of neodymium(III) at trace level with di(2-ethyl-hexyl)phosphoric acid in hexane, Solvent Extr. Ion Exch. 17 (1999) 455-474. https://doi.org/10.1080/07366299908934623.
[16] S. Radhika, B. Nagaphani Kumar, M. Lakshmi Kantam, B. Ramachandra Reddy, Solvent extraction and separation of rare-earths from phosphoric acid solutions with TOPS 99, Hydrometallurgy 110 (2011) 50-55. https://doi.org/10.1016/j.hydromet.2011.08.004.
[17] D. Li, Development course of separating rare earths with acid phosphorus extractants: A critical review, Journal of Rare Earths 37 (2019) 468-486. https://doi.org/10.1016/j.jre.2018.07.016. [18] V.K. Manchanda, P.N. Pathak, Amides and diamides as promising extractants in the back end of the nuclear fuel cycle: an overview, Sep. Purif. Technol. 35 (2004) 85-103. https://doi.org/10.1016/j.seppur.2003.09.005.
[19] E.A. Mowafy, H.F. Aly, Extraction Behaviors of Trivalent Lanthanides from Nitrate Medium by Selected Substituted Malonamides, Solvent Extr. Ion Exch. 24 (2006) 677-692. https://doi.org/10.1080/07366290600762322.
[20] Y. Sasaki, Y. Sugo, K. Morita, K.L. Nash, The Effect of Alkyl Substituents on Actinide and Lanthanide Extraction by Diglycolamide Compounds, Solvent Extr. Ion Exch. 33 (2015) 625-641. https://doi.org/10.1080/07366299.2015.1087209.
[21] M. Wehbie, G. Arrachart, I. Karamé, L. Ghannam, S. Pellet-Rostaing, Triazole Diglycolamide Cavitand for lanthanide extraction, Sep. Purif. Technol. 169 (2016) 17-24. https://doi.org/10.1016/j.seppur.2016.06.003.
[22] M. Wehbie, G. Arrachart, C. Arrambide Cruz, I. Karamé, L. Ghannam, S. Pellet-Rostaing, Organization of diglycolamides on resorcinarene cavitand and its effect on the selective extraction and separation of HREEs, Sep. Purif. Technol. 187 (2017) 311-318.
https://doi.org/10.1016/j.seppur.2017.06.062.
[23] E.J. Werner, S.M. Biros, Supramolecular ligands for the extraction of lanthanide and actinide ions, Organic Chemistry Frontiers 6 (2019) 2067-2094. https://doi.org/10.1039/C9QO00242A.
[24] F. Mary, G. Arrachart, A. Leydier, S. Pellet-Rostaing, Synthesis of organophosphorus ligands with a central oxygen atom and their applications in solvent extraction, Tetrahedron 75 (2019) 3968-3976. https://doi.org/10.1016/j.tet.2019.06.004.
[25] J.M. Muller, C. Berthon, L. Couston, N. Zorz, J.-P. Simonin, L. Berthon, Extraction of Lanthanides(III) by a Mixture of a Malonamide and a Dialkyl Phosphoric Acid, Solvent Extr. Ion Exch. 34 (2016) 141-160. https://doi.org/10.1080/07366299.2015.1135030.
[26] J. Rey, S. Atak, S. Dourdain, G. Arrachart, L. Berthon, S. Pellet-Rostaing, Synergistic Extraction of Rare Earth Elements from Phosphoric Acid Medium using a Mixture of Surfactant AOT and DEHCNPB, Solvent Extr. Ion Exch. 35 (2017) 321-331. https://doi.org/10.1080/07366299.2017.1362852.
[27] G.M. Ritcey, A.W. Ashbrook, Solvent Extraction, Principles and Applications to Process Metallurgy. Part I, Elsevier, Amsterdam, 1984.
[28] R.G. Pearson, Hard and soft acids and bases, HSAB, part 1: Fundamental principles, J. Chem. Educ. 45 (1968) 581. https://doi.org/10.1021/ed045p581.
[29] B. Gannaz, R. Chiarizia, M.R. Antonio, C. Hill, G. Cote, Extraction of lanthanides (III) and Am (III) by mixtures of malonamide and dialkylphosphoric acid, Solvent Extr. Ion Exch. 25 (2007) 313-337. https://doi.org/10.1080/07366290701285512.
30
[30] M. Wehbie, G. Arrachart, I. Karame, L. Ghannam, S. Pellet-Rostaing, Diglycolamide-functionalized resorcinarene for rare earths extraction, New J. Chem. 40 (2016) 9344-9351. https://doi.org/10.1039/C6NJ02195F.
[31] N.V. Thakur, Separation of Rare Earths by Solvent Extraction, Miner. Process. Extr. Metall. Rev. 21 (2000) 277-306. https://doi.org/10.1080/08827500008914171.
[32] N.M. Kocherginsky, Q. Yang, L. Seelam, Recent advances in supported liquid membrane technology, Sep. Purif. Technol. 53 (2007) 171-177. https://doi.org/10.1016/j.seppur.2006.06.022. [33] M. Levesque, V. Sarou-Kanian, M. Salanne, M. Gobet, H. Groult, C. Bessada, P.A. Madden, A.-L. Rollet, Structure and dynamics in yttrium-based molten rare earth alkali fluorides, J. Chem. Phys. 138 (2013) 184503. https://doi.org/10.1063/1.4802986.
[34] T. Murakami, Y. Sakamura, N. Akiyama, S. Kitawaki, A. Nakayoshi, T. Koyama, Electrochemical Measurement of Diffusion Coefficient of Actinides and Rare Earths in Liquid Cd, Procedia Chemistry 7 (2012) 798-803. https://doi.org/10.1016/j.proche.2012.10.121.
[35] G. Taylor, Dispersion of Soluble Matter in Solvent Flowing Slowly through a Tube, Proc R Soc Lon Ser-A 219 (1953) 186-203. https://doi.org/10.1098/rspa.1953.0139.
[36] G. Taylor, The Dispersion of Matter in Turbulent Flow through a Pipe, Proc R Soc Lon Ser-A 223 (1954) 446-468. https://doi.org/10.1098/rspa.1954.0130.
[37] E.P.C. Mes, W.T. Kok, H. Poppe, R. Tijssen, Comparison of methods for the determination of diffusion coefficients of polymers in dilute solutions: The influence of polydispersity, J Polym Sci Pol
Phys 37 (1999) 593-603.
https://doi.org/10.1002/(Sici)1099-0488(19990315)37:6<593::AidPolb11>3.3.Co;2-E.
[38] H. Cottet, M. Martin, A. Papillaud, E. Souaïd, H. Collet, A. Commeyras, Determination of Dendrigraft Poly-l-Lysine Diffusion Coefficients by Taylor Dispersion Analysis, Biomacromolecules 8 (2007) 3235-3243. https://doi.org/10.1021/bm070268j.
[39] J. Chamieh, J. Biron, L. Cipelletti, H. Cottet, Monitoring Biopolymer Degradation by Taylor
Dispersion Analysis, Biomacromolecules 16 (2015) 3945-3951.
https://doi.org/10.1021/acs.biomac.5b01260.
[40] A. Hawe, W. Hulse, W. Jiskoot, R. Forbes, Taylor Dispersion Analysis Compared to Dynamic Light Scattering for the Size Analysis of Therapeutic Peptides and Proteins and Their Aggregates, Pharm. Res. 28 (2011) 2302-2310. https://doi.org/10.1007/s11095-011-0460-3.
[41] W. Hulse, R. Forbes, A Taylor dispersion analysis method for the sizing of therapeutic proteins and their aggregates using nanolitre sample quantities, Int. J. Pharm. 416 (2011) 394-397. https://doi.org/10.1016/j.ijpharm.2011.06.045.
[42] J. Chamieh, L. Leclercq, M. Martin, S. Slaoui, H. Jensen, J. Østergaard, H. Cottet, Limits in Size of Taylor Dispersion Analysis: Representation of the Different Hydrodynamic Regimes and Application to the Size-Characterization of Cubosomes, Anal. Chem. 89 (2017) 13487-13493. https://doi.org/10.1021/acs.analchem.7b03806.
[43] D.A. Urban, A.M. Milosevic, D. Bossert, F. Crippa, T.L. Moore, C. Geers, S. Balog, B. RothenRutishauser, A. Petri-Fink, Taylor Dispersion of Inorganic Nanoparticles and Comparison to Dynamic
Light Scattering and Transmission Electron Microscopy, Colloid and Interface Science Communications 22 (2018) 29-33. https://doi.org/10.1016/j.colcom.2017.12.001.
[44] J. Chamieh, F. Davanier, V. Jannin, F. Demarne, H. Cottet, Size characterization of commercial micelles and microemulsions by Taylor dispersion analysis, Int. J. Pharm. 492 (2015) 46-54. http://dx.doi.org/10.1016/j.ijpharm.2015.06.037.
[45] J. Chamieh, V. Jannin, F. Demarne, H. Cottet, Hydrodynamic size characterization of a selfemulsifying lipid pharmaceutical excipient by Taylor dispersion analysis with fluorescent detection, Int. J. Pharm. 513 (2016) 262-269. https://doi.org/10.1016/j.ijpharm.2016.09.016.
[46] T. Wannachod, V. Mohdee, S. Suren, P. Ramakul, U. Pancharoen, K. Nootong, The separation of Nd(III) from mixed rare earth via hollow fiber supported liquid membrane and mass transfer analysis,
31
Journal of Industrial and Engineering Chemistry 26 (2015) 214-217. https://doi.org/10.1016/j.jiec.2014.11.032.
[47] M. Anitha, D.N. Ambare, D.K. Singh, H. Singh, P.K. Mohapatra, Extraction of neodymium from nitric acid feed solutions using an emulsion liquid membrane containing TOPO and DNPPA as the carrier extractants, Chem. Eng. Res. Des. 98 (2015) 89-95. https://doi.org/10.1016/j.cherd.2015.04.011. [48] M. Raji, H. Abolghasemi, J. Safdari, A. Kargari, Pertraction of dysprosium from nitrate medium by emulsion liquid membrane containing mixed surfactant system, Chemical Engineering and ProcessingProcess Intensification 120 (2017) 184-194. https://doi.org/10.1016/j.cep.2017.06.010.
[49] T. Pirom, A. Arponwichanop, U. Pancharoen, T. Yonezawa, S. Kheawhom, Yttrium (III) Recovery with D2EHPA in Pseudo-Emulsion Hollow Fiber Strip Dispersion System, Sci. Rep. 8 (2018). https://doi.org/10.1038/s41598-018-25771-4.
[50] S. Pavon, M. Kutucu, M.T. Coll, A. Fortuny, A.M. Sastre, Comparison of Cyanex 272 and Cyanex 572 for the separation of Neodymium from a Nd/Tb/Dy mixture by pertraction, J. Chem. Technol. Biotechnol. 93 (2018) 2152-2159. https://doi.org/10.1002/jctb.5458.
[51] D. Xu, Z. Shah, Y. Cui, L. Jin, X. Peng, H. Zhang, G. Sun, Recovery of rare earths from nitric acid leach solutions of phosphate ores using solvent extraction with a new amide extractant (TODGA), Hydrometallurgy 180 (2018) 132-138. https://doi.org/10.1016/j.hydromet.2018.07.005.
[52] Y. Shen, Y. Jiang, X. Qiu, S. Zhao, Leaching of Light Rare Earth Elements from Sichuan Bastnaesite: A Facile Process to Leach Trivalent Rare Earth Elements Selectively from Tetravalent Cerium, JOM 69 (2017) 1976-1981. https://doi.org/10.1007/s11837-017-2458-8.
[53] N. Desigan, N.P. Bhatt, N.K. Pandey, U. Kamachi Mudali, R. Natarajan, J.B. Joshi, Mechanism of dissolution of nuclear fuel in nitric acid relevant to nuclear fuel reprocessing, J. Radioanal. Nucl. Chem. 312 (2017) 141-149. https://doi.org/10.1007/s10967-017-5208-z.
[54] R. Taylor, Part One: Introductory issues and future challenges,, Reprocessing and Recycling of Spent Nuclear Fuel, Woodhead Publishing2015, pp. 3-90.
[55] A.C. Ni'am, Y.-F. Wang, S.-W. Chen, S.-J. You, Recovery of rare earth elements from waste permanent magnet (WPMs) via selective leaching using the Taguchi method, Journal of the Taiwan Institute of Chemical Engineers 97 (2019) 137-145. https://doi.org/10.1016/j.jtice.2019.01.006. [56] M. Gergoric, C. Ekberg, M.R.S.J. Foreman, B.-M. Steenari, T. Retegan, Characterization and Leaching of Neodymium Magnet Waste and Solvent Extraction of the Rare-Earth Elements Using TODGA, Journal of Sustainable Metallurgy 3 (2017) 638-645. https://doi.org/10.1007/s40831-0170122-8.
[57] Y. Kikuchi, M. Matsumiya, S. Kawakami, Extraction of Rare Earth Ions from Nd-Fe-B Magnet Wastes with TBP in Tricaprylmethylammonium Nitrate, Solvent Extraction Research and Development, Japan 21 (2014) 137-145. https://doi.org/10.15261/serdj.21.137.
[58] S. Pellet-Rostaing, J. Duhamet, M. Toure, G. Arrachart, R. Turgis, Selective extraction of rare earth elements from acidic aqueous solutions with the help of a monoamide, EP3323899 (A1) 2018-05-23, Commissariat a l'Energie Atomique et Aux Energies Alternatives, Fr.; Universite de Montpellier, 2018. [59] J. Chamieh, H. Cottet, Chapter 9 - Size-based characterisation of nanomaterials by Taylor dispersion analysis, in: H. Makino, K. Ohshima (Eds.) Colloid and Interface Science in Pharmaceutical Research and Development, Elsevier, Amsterdam, 2014, pp. 173-192.
[60] G. Taylor, Conditions under which dispersion of a solute in a stream of solvent can be used to measure molecular diffusion, Proceedings of the Royal Society of London Series a-Mathematical and Physical Sciences 225 (1954) 473-477. https://doi.org/10.1098/rspa.1954.0216.
[61] J. Duhamet, H. Mohwald, M. Pleines, T. Zemb, Self-Regulated Ion Permeation through
Extraction Membranes, Langmuir 33 (2017) 9873-9879.
https://doi.org/10.1021/acs.langmuir.7b02256. [62] D. Qi, Chapter 2 - Extractants Used in Solvent Extraction-Separation of Rare Earths: Extraction Mechanism, Properties, and Features Hydrometallurgy of Rare Earths, Elsevier2018, pp. 187-389. [63] Y. Y. Marcus, A.S. Kertes, Ion Exchange
32
and Solvent Extraction of Metal Complexes, Interscience Publishers, John Wiley & Sons, New York, London, Sydney, 1969.
[64] Q. Tian, M.A. Hughes, Synthesis and characterisation of diamide extractants for the extraction of neodymium, Hydrometallurgy 36 (1994) 79-94. https://doi.org/10.1016/0304-386X(94)90043-4. [65] Q. Tian, M.A. Hughes, The mechanism of extraction of HNO3 and neodymium with diamides, Hydrometallurgy 36 (1994) 315-330. https://doi.org/10.1016/0304-386X(94)90029-9.
[66] M. Wehbie, G. Arrachart, L. Ghannam, I. Karame, S. Pellet-Rostaing, An ionic liquid-based extraction system using diglycolamide functionalized macrocyclic platforms for the extraction and recovery of lanthanides, Dalton Trans 46 (2017) 16505-16515. https://doi.org/10.1039/c7dt02797d. [67] K.L. Nash, A review of the basic chemistry and recent developments in trivalent f-elements separations, Solvent Extr. Ion Exch. 11 (1993) 729-768. https://doi.org/10.1080/07366299308918184. [68] E.L. Cussler, Values of Diffusion coefficients, in: E.L. Cussler (Ed.) Diffusion: Mass Transfer in Fluid Systems, Cambridge University Press, Cambridge, 2009, pp. 142-143.
[69] J. Theisen, C. Penisson, J. Rey, T. Zemb, J. Duhamet, J.-C.P. Gabriel, Effects of porous media on extraction kinetics: Is the membrane really a limiting factor?, Journal of Membrane Science 586 (2019) 318-325. https://doi.org/10.1016/j.memsci.2019.05.056.