HAL Id: hal-03129161
https://hal.umontpellier.fr/hal-03129161
Submitted on 2 Feb 2021HAL is a multi-disciplinary open access archive for the deposit and dissemination of sci-entific research documents, whether they are pub-lished or not. The documents may come from teaching and research institutions in France or abroad, or from public or private research centers.
L’archive ouverte pluridisciplinaire HAL, est destinée au dépôt et à la diffusion de documents scientifiques de niveau recherche, publiés ou non, émanant des établissements d’enseignement et de recherche français ou étrangers, des laboratoires publics ou privés.
Nutrient budgets in a small-scale freshwater fish pond
system in Indonesia
Simon Pouil, Reza Samsudin, Jacques Slembrouck, Ahmad Sihabuddin,
Gusnia Sundari, Khazaidan Khazaidan, Anang Hari Kristanto, Brata
Pantjara, Domenico Caruso
To cite this version:
Simon Pouil, Reza Samsudin, Jacques Slembrouck, Ahmad Sihabuddin, Gusnia Sundari, et al.. Nu-trient budgets in a small-scale freshwater fish pond system in Indonesia. Aquaculture, Elsevier, 2019, 504, pp.267-274. �10.1016/j.aquaculture.2019.01.067�. �hal-03129161�
Nutrient budgets in a small-scale freshwater fish pond system in Indonesia
Simon Pouila*, Reza Samsudinb, Jacques Slembroucka, Ahmad Sihabuddinc, Gusnia Sundaric, Khazaidan Khazaidanb, Anang Hari Kristantob, Brata Pantjarab, Domenico Carusoa
a
ISEM, Université de Montpellier, CNRS, IRD, EPHE, Montpellier, France
b
RIFAFE, Bogor, Indonesia
c
IRD, Jakarta, Indonesia
* Corresponding author: Simon Pouil
ISEM, Institut de Recherche pour le Développement (IRD)
Université de Montpellier, Place Eugène Bataillon Montpellier Cedex 05, France
E-mail: [email protected] ORCID: 0000-0003-1531-0362
Version of Record: https://www.sciencedirect.com/science/article/pii/S0044848618324025 Manuscript_45f6015e6342c8e2df455dcf112367bd
Abstract:
Over the past several years, Indonesian freshwater aquaculture has intensified, with a concomitant increase in the use of commercial pellets. To assess the effects of pond aquaculture intensification on nutrient dynamics, we monitored nutrients and fish production in a small-scale fish farm in West Java province. The studied system consisted of semi-intensive giant gourami (Osphronemus goramy) production in four small earthen ponds (353-482 m2 each and 0.46-0.55 m deep). Nitrogen (N) and phosphorus (P) fluxes through the ponds were monitored, and data on fish production and nutrient accumulation in sediments were collected during a 5-month production cycle. Results showed that, on average, 61% total N and 77% P inputs were trapped in the accumulated sediments. Only 15% of total N and less than 3% P inputs introduced into ponds were recovered in harvested fish. Sediment nutrient accumulation increased linearly with total nutrient input. The consequences of intensification of giant gourami aquaculture using this production model are explored in terms of nutrient use efficiency and environmental impact.
1. Introduction
Producing 3 million tons of farmed fish in 2015, Indonesia is the third largest freshwater fish aquaculture producer country after China and India (FAO, 2017). Indonesian aquaculture production has increased six-fold since 2005 (FAO, 2017), after the government made aquaculture development a national priority (Philips et al., 2015; Rimmer et al., 2013). This sector plays an increasingly significant role in Indonesian economy, ensuring food availability, household food security and the improvement of living standards for rural communities (Rimmer et al., 2013). Indonesian aquaculture is characterized by a high number of fish farmers (3.34 million in 2016; FAO, 2018) and relatively low annual productivity (1.48 t/farmer) compared with other Asian countries (1.72 t/farmer in Asian countries excluding Indonesia and China; FAO, 2018). This is especially true for freshwater fish aquaculture, which is mainly carried out in, micro- and small-scale farms, which represent an estimated > 90% of all fish farms (Maskur et al., 2013).
Small-scale fish farmers usually practice aquaculture using low-input and low-level technology. This is especially true for aquaculture production in earthen ponds, where traditional practices favor primary productivity and limit inputs of exogenous food, especially commercial pellets. These traditional production systems reportedly use resources efficiently, particularly through integrated aquaculture-agriculture (IAA) practices (Nhan et al., 2008). Nevertheless, the number of studies providing quantitative evidence of such claims remains limited (e.g. Nhan et al., 2008). In addition, the development of freshwater aquaculture in recent years has resulted in a shift from low-intensity traditional culture methods to monoculture production systems, with increasing intensification accompanied by the use of commercial pellets (Edwards, 2009; Rimmer et al., 2013). Such changes raise many issues about the real effectiveness of current production systems in the use of nutrient resources and the associated environmental impacts.
Intensification of freshwater aquaculture with the increase in fish density and the use of commercial feed may result in the release of significant amounts of nutrients into water. This enrichment in nutrients such as nitrogen (N) and phosphorus (P) intended for aquaculture may contribute to the deterioration in water quality and to eutrophication (Boyd et al., 1998). Among the fish produced in Indonesian pond aquaculture, the giant gourami Osphronemus
goramy Lacepède (1801) is one of the main freshwater commodities of economic importance.
This species has been produced in small-scale farms for decades, usually in semi-intensive systems depending largely on natural food, supplemented with fertilizers and plants and commercial pellets in highly variable proportions.
Commercial pellets are one of the main sources of N and P inputs in semi-intensive and intensive aquaculture production systems (e.g. Briggs and Fvnge Smith, 1994; Nhan et al., 2008; Phong et al., 2011). Thus, nutrient assimilation by aquaculture organisms has important implications for water quality and the profitability of ponds. In most cases, no more than 20% to 50% of the N and P introduced into ponds through fertilizers and feed are recovered in farmed organisms at harvest, with the rest being diluted into the water column or accumulated in the sediment (e.g. Boyd and Tucker, 1998; Hargreaves, 1998; Ketola and Harland, 1993). Earthen ponds have a demonstrated ability to trap nutrients such as nitrogen and phosphorus, and pond waters usually have high concentrations of nutrients, suspended solids, and oxygen demand than the water bodies into which they discharge (Schwartz and Boyd, 1994). Thus, pond effluents are potential sources of pollution in receiving waters (Boyd, 2003). In this context, the lack of information regarding the environmental effects of aquaculture pond systems in Indonesia is of particular concern (Aubin et al., 2017).
This study aims to quantify the nutrient (N and P) balances in earthen ponds used for the production of giant gourami in Java (Fig. 1). Here, intensified aquaculture production was
considered using organic fertilization and commercial pellets as the unique sources of fish
2. Materials and methods
2.1. Ponds systems and management
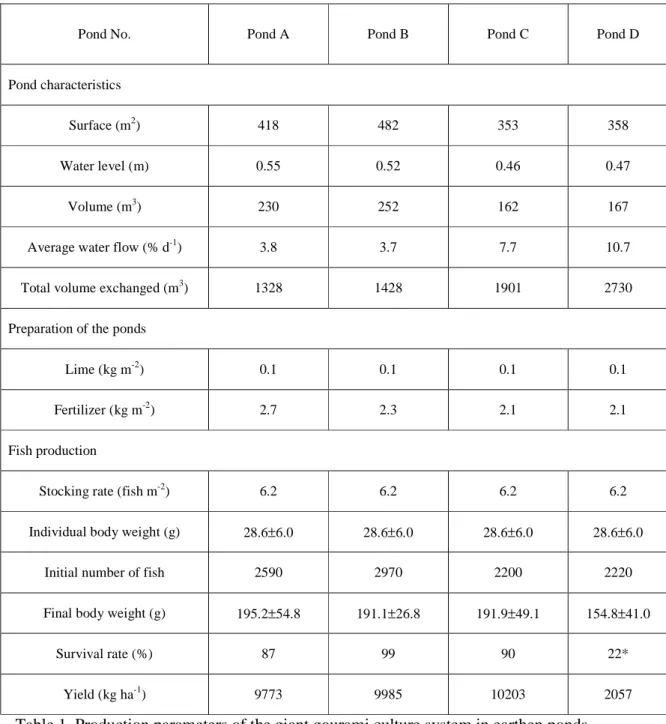
The experiment was conducted for 5 months (152 d from mid-November 2017 to mid-April 2018) in a small-scale fish farm located in the village of Babakan (-6°28’S; 106°42’E; alt: 125 m), Bogor district, West Java, Indonesia (Fig. 1). The investigated aquaculture pond system consisted of four small semi-intensive earthen ponds, whose size varied between 353 and 482 m2 with depths ranging from 0.46 to 0.55 m (Table 1). Each pond was equipped with PVC pipes for inlet and outlet water; an anti-predator nets held by bamboo poles were placed at a distance of 1 m from the banks. Juveniles of giant gourami (28.6 ± 6.0 g wet weight, 12.2 ± 1.0 cm) were stocked at a density of 6.2 fish m-2 in each pond (Table 1). Gourami were fed three times a day, seven days a week with the same commercial pellets (proteins: 33%, lipids: 5%, humidity 8%, Table 1) throughout the experiment. The daily ration was 3 to 5% of the estimated wet biomass according to fish growth.
Before starting the experiment, the ponds were dried, the bottom were flattened, the banks consolidated with sediment accumulated during the previous production cycle, unwanted species were removed, and the water was limed and fertilized using organic fertilizer (typical composition: poultry manure mixed with rice bran at a 0.5:1 ratio on a dry weight basis, Purnomo et al., 2017). The quantity of organic fertilizer was determined after consulting with local fish farmers (i.e. based on empirical knowledge). Fertilizer was added four times during the first three months of the experiment (equiv. 2.1-2.7 kg m-2 kg, see Table 1). Ponds were filled by gravity with water from a reservoir located at <1 km from the farm. The experiment was carried out in open flow water (average water flow 3.7-10.7% d-1, total volume
2.2. Environmental conditions monitoring
Environmental conditions were recorded continuously throughout the experiment using a data logger (Onset HOBO) placed in each pond at 10 cm depth for water temperature or at 50 cm above the water surface in the center of pond B for air temperature and light intensity (Fig. 1). A rain gauge placed on the production site recorded the daily rainfall. During the entire experiment, the ambient temperature was 28.7±5.0°C (range: 20.4-43.5°C), the daily diurnal (06:00 AM-06:00 PM) light intensity was on average 23,000 lux with maximum values reaching 176,000 lux, rainfall range was 7.8±14.6 mm day-1 (range: 0-75 mm day-1) and the water temperature was 30.2±1.9°C (range: 25.7-38.6°C) with no significant differences between the four ponds.
2.3. Sampling
2.3.1. Water
Water was sampled in the inlet channel and at the outlet of each pond eight times during the experiment (every two weeks). Prior to each water sampling, on-site measurements were taken (08:00-10:00 AM) to determine pH, dissolved oxygen (DO, mg L-1), temperature (T°C), total dissolved solid matter (TDS, mg L-1) using a multi-parameter probe (HI 9829 Hanna). Water samples were transported to the laboratory in a cooler at 4-5°C, then analyzed less than 6 h after sampling. In addition to N and P (see procedures in Section 2.5), nitrite (NO2--N),
nitrate (NO3--N), orthophosphate (PO43-) were determined using a spectrophotometer (Hach
DR/2010). Samples were also taken to determine chlorophyll-a concentration (APHA 2005), biological oxygen demand (BOD), and chemical oxygen demand (COD), according to AOAC (1999). Data are summarized in Table 2.
In each pond, the depth of accumulated substances during the experiment was determined from measurements of the height from the bottom of the pond of the two bamboo poles installed to hold the anti-predator net at the beginning and at the end of the 152-d experiment. The substances were composed of uneaten fish feed, fish feces, dead plankton, other organic matter and mineral particles, and are hereafter referred to as accumulated sediment (Nhan et al., 2008). Differences in bottom levels recorded between stocking and harvesting were assumed to be due to sediment accumulated during the fish culture period. Accumulated sediments were sampled at harvesting in five different locations in each pond using a 6.35 cm diameter PVC tube. For each pond, sediments taken from the different locations were thoroughly mixed into a composite sample for further analysis. The composite samples were stored at -18°C and then analyzed for N and P (see Section 2.5). In addition, for each pond, a 10-30 g wet sample was dried at 105°C for 24 hours to determine dry weight. The organic matter content was determined with 1 h combustion of the dried sediment subsamples at 500°C.
2.3.3. Commercial feed and fertilizer
The types and quantities of fertilizers and commercial feed (i.e. manufactured pellets) inputs were recorded daily. Prior to use, batches of fertilizer (poultry manure mixed with rice bran) were analyzed to determine N and P following the procedures described in Section 2.5. Regular supplies of commercial feed bags were brought to the farm throughout the experiment. For each new bag, samples of pellets were taken and mixed, and then N and P contents of this mixture were analyzed each month using the procedures described in Section 2.5. Pond nutrient inputs, for each type, were calculated by multiplying recorded quantities by measured nutrient concentrations.
2.3.4. Fish and other species
Before storage in the experimental ponds, 200 giant gourami juveniles were individually sampled to determine initial average body weight and biomass. Every month, 50 fish from each pond were sampled and individually weighed to determine growth and adjust the feed ration. The number of dead fish collected on the water surface was recorded daily for each pond throughout the experiment. At harvest, remaining fish were counted to assess survival and the total biomass of produced fish was determined for each pond.
Dry matter (DM), N and P contents in the fish were determined at the beginning (i.e. fish stocked, n=5) and at the end of the experiment (i.e. fish harvested, n=5 per pond) as described in Section 2.5.
Biomass of colonizing invertebrate species such as freshwater snails (mainly Pomacea
canaliculata and, to a lesser extent, Filopaludina javanica) and bivalves (Pilsbryoconcha exilis) were recorded and weighed for each pond at the end of the experiment. N and P
contents were determined following the procedure indicated in Section 2.5.
Net fish production was determined as the difference between initial and harvested biomass and was calculated on a kg ha-1 year-1 basis.
2.4. Nutrient budgets
Pond nutrient budgets were established for N and P on a kg ha-1 year-1 basis. In each pond, nutrient balance was estimated according to the following equation:
∑inputs = ∑outputs ± unaccounted.
The nutrient inputs included (1) commercial feed, (2) fertilizer, (3) fish stocked and (4) inflow water. The nutrient outputs included (1) accumulated sediments, (2) harvested bivalves and snails (ancillary production), (3) harvested fish, and (4) outflow water. The nutrient input and
output quantities were calculated by multiplying total weights or volumes by nutrient concentrations measured at the nearest date.
Following Nhan et al. (2008), nitrogen fixation, N volatilization, photosynthesis and absorption were not measured and phosphorus inputs from rainwater and losses of the nutrients through evaporation were assumed negligible. Nutrient dynamics in phyto- and zooplankton were not considered in this study because these compartments represented very little biomass in our production ponds. Nutrient uptake by other colonizing species, mainly shrimp (Atyidae) and fish (Barbonymus gonionotus, Oreochromis niloticus, and Trichogaster sp.) was considered negligible (<20 kg).
2.5. Sample analysis
Total Kjeldahl nitrogen (TKN) in water was measured following the Indonesian National Standard (SNI) 06-6989.52-2005 using macro Kjeldahl coupled with titration. Total N was then determined as the sum of TKN, NO₃-N and NO2-N. Phosphorus (P) in water was
determined based on the procedures described in the SNI 06-6989.31-2005 adapted from APHA 4500-PE.
For the other samples (bivalves, feed, fertilizer, fish, sediment and snails), total N was estimated based on the crude protein (CP) content measured according to AOAC 2001.11. Briefly, each sample was weighed and transferred to a sample tube. Digestion was performed using concentrated sulfuric acid at 400°C for 1 h and, after cooling, measurements were read using an automated Kjeldahl analyzer. The conversion factors used for total N estimation were 5.58 for fish, 5.6 for bivalves and snails and 6.25 for the remaining samples. For total P determination, samples were weighed and digested in nitric acid for 20 min at 190°C. Measurements were then read using an inductively coupled plasma optical emission spectrometer (ICP-OES).
2.6. Data analysis
Statistical comparisons were done for the different water parameters measured in the inlet channel and the four earthen ponds. When normality (Shapiro’s test) and homogeneity of variance (Levene’s test) were confirmed (BOD, chlorophyll a, DO, TDS, temperature, total N), one-way ANOVA was used to determine significant differences among sampling locations. When significant differences were detected, Tukey's test was performed to compare means. In the case of non-normality and/or heterogenous variances (COD, NO2-, NO3-, pH,
PO₄³⁻, total P), data were analyzed using non-parametric Kruskal-Wallis and Siegel and Castellan tests.
Linear regression analysis was used to test for effects of nutrient inputs on fish yields and on nutrient accumulation in sediment.
The level of significance for statistical analyses was set at α = 0.05. All statistics were calculated using R freeware version 3.3 (R Development Core Team, 2016) and figures were plotted using Microsoft Excel 2016.
3. Results
3.1. Nutrient budgets
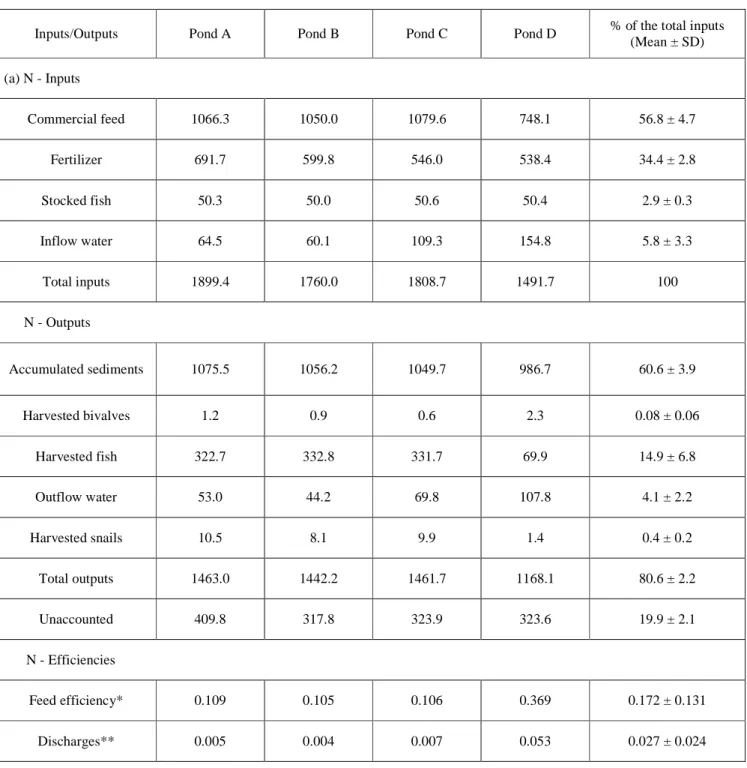
Overall, results show that commercial feed and organic fertilizer were the major sources of P and N, and that accumulated sediments were the major sinks of these nutrients (Fig. 2 and 3, Table 3). Commercial feed inputs accounted for 56.8 ± 4.7% of the total N and 60.4 ± 3.7% of P inputs. Organic fertilizer (poultry manure mixed with rice bran) was the second most important source of nutrients. Interestingly, water inflow accounted only for 5.8 ± 3.3% of N and 0.1 ± 0.1% of P inputs. Harvested fish accounted for 2.9 ± 0.3% of the total N and 0.7 ± 0.1%P inputs (Fig. 2 and 3, Table 3).
A large proportion of nutrients were trapped in the accumulated sediment: 60.6 ± 3.9% of the total N and 77.0 ± 3.5% of P inputs were found in the accumulated sediments at the end of the experiment. The remaining recorded fractions of the nutrients were found in harvested fish (14.9 ± 6.8% for N and 3.1 ± 1.7% for P) and flushed out with the outflow water. The fractions of nutrients found in ancillary productions were very low (<1% for N and P, Fig. 2 and 3, Table 4). Based on our analysis, we found unbalanced budgets for N and P: 19.9 ± 2.1% of N and 19.3 ± 2.6% of P inputs were not recovered in the outputs (Fig. 2 and 3, Table 3).
3.2. Fish yields and nutrient inputs
After a 5-month growing period in the four ponds (A, B, C and D), fish yields ranged from 2057 to 10,203 kg ha-1. A pathological event occurred in pond D and the final yield was dramatically reduced compared with the other ponds (2057 kg ha-1 year-1 for pond D and 9772-10,203 kg ha-1 for the three other ponds). For all ponds, monitoring of the observed mortality made it possible to re-adjust the quantities of food distributed according to the estimated biomass determined after each monthly sampling. This method proved to be fairly accurate for ponds A, B and C with relatively close estimated (98 ± 1%) and observed (92 ± 6%) survival rates at the end of the experiment. Nevertheless, for pond D, the survival rate was overestimated (65% vs. 22% measured at the end of the experiment). Thus, the quantity of pellets distributed in this pond were probably higher than daily rationing initially planned. The quantities of N and P found in the accumulated sediments increased with increasing total nutrient inputs through commercial feed, fertilizer, fish stocked and inflow water (Fig. 4). The total nutrient inputs explained 98% and 87% of the variability of the N and P found in the sediment, respectively.
4. Discussion
4.1. Management and nutrient budgets of giant gourami earthen pond aquaculture
Aquaculture of giant gourami O. goramy in Indonesia is a very old practice (Cuvier and Valenciennes, 1831). Many small-scale Asian fish farmers produce giant gourami in fertilized ponds to limit the use of high-priced commercial pellets (Pengseng and Boyd, 2011). In such systems, giant gourami is traditionally fed a combination of local plants such as giant taro (Alocasia macrorrhizos), supplemented with commercial pellets in varying proportions (Aubin et al., 2017).
In the present study, the culture system can be classified as upper-level semi-intensive with commercial pellets as a single source of feed (rationing: 4% on average), in line with intensification trends observed over the past years in Indonesian freshwater aquaculture for other fish species (Udo and Steenstra, 2010). Not surprisingly, commercial pellets were the main source of nutrients in ponds, contributing 50-61% of the total N and 56-65% of the total P inputs. These results are close to those obtained in shrimp aquaculture conducted in semi-intensive ponds (71-76% and 53-83% of the total N and total P inputs, respectively; Casillas-Hernández et al., 2006; Páez-Osuna et al., 1997; Páez-Osuna and Ruiz-Fernández, 2005). Nevertheless, the nutrient budgets established in our production system revealed that organic fertilizer is also an important source of N and P inputs.
One of main organic fertilizers used in Javanese pond aquaculture is poultry manure (from local intensive broiler farms) mixed with rice bran. In our system, the addition of organic fertilizer during the preparation of the ponds and the fish growing period represented 31-37% of inputs in N and 35-43% of inputs in P. The applied fertilizer doses were determined by the local fish farmers involved in the experiment (i.e. 97-124 g m-2 week-1) to promote high primary productivity of the ponds. This is a key feature of giant gourami production in ponds. This species can breathe atmospheric air and can be reared in heavily fertilized ponds
(Pengseng and Boyd, 2011), rich in phytoplankton and for which the dramatic variation in dissolved oxygen can be harmful for other fish species produced locally in earthen ponds, such as the Nile tilapia Oreochromis niloticus or the common carp Cyprinus carpio (Philips et al., 2015). Considering chlorophyll a as a proxy for the level of fertilization in ponds, although there are significant variations during the production cycle, the mean values between 169 and 446 µg L-1 of chlorophyll a in our ponds are well below those (up to 85.8 mg L-1) obtained in giant gourami production ponds in Thailand (Pengseng and Boyd, 2011) despite fertilization rates about 10 times lower (maximum of 60 kg N ha-1 and 30 kg P ha-1 applied during a 120 d production cycle using inorganic fertilizers) than those used in our experiment. In our system, we used organic fertilizer instead of chemicals and water renewal was about 4-11% d-1 during the fish production cycle. These differences likely explain the lower primary productivity observed in our ponds compared with Thai ponds (Pengseng and Boyd, 2011). Furthermore, nutrient inputs furnished by massive initial fertilization may be trapped in sediment and no longer be available to promote primary production in pond. These results call into question the bioavailability of nutrients supplied by organic fertilizers in our production system and the improvement of fertilization practices should be considered (see Section 4.2). In traditional Indonesian earthen pond fish farming, accumulated sediments are not regularly removed. Between each production cycle, the bottom of the pond is flattened, the banks restored using part of the accumulated sediment. These ponds are therefore characterized by sediment that is several tens of centimeters thick. In our experiment, the accumulation rate for sediments was on average, 0.91 cm month-1. Our results showed that accumulated sediments play a major role in nutrient budgets because a large fraction of the N and P inputs settle directly on the sediment, which is also enriched mainly by organic matter: plankton, dead organisms, and wastes produced by living organisms such as fish, snails, and bivalves. Such findings are in accordance with literature, with reports that nutrient trapping in sediments play
a key role in the nutrient balance of fish ponds (Nhan et al., 2008, see Table 4). Thus, sediments can account for 61% of total N inputs and 77% of total P inputs, an element known to be highly adsorbed on sediment (Boyd, 1985; Shrestha and Lin, 1996). In our system, less N accumulated in the sediment than P likely due to higher recovery of N inputs in harvested fish. We assume that the absence of sludge removal between each production cycle can increase nutrient trapping in sediment. More regular cleaning of the ponds, and the use of the nutrient-rich sludge for other applications (e.g. crop fertilization) could improve the efficiency and the utility of the nutrients inputs of the ponds.
The percentages of N input recovered in fish (5-19%) were similar to that observed in other semi-intensive and intensive fish farming systems, but we found lower values for P (1-5%). In semi-intensive ponds, proportions of N and P in harvested fish are highly variable and can account for 4-53% of N, and 3-24% of total N and P inputs respectively (e.g. Hlaváč et al., 2015; Green and Boyd, 1995; Nhan et al., 2008, see Table 4), whereas 11-27% of N and 18-32% of P total inputs are recovered in harvested fish in intensive systems (e.g. Boyd, 1985; Krom et al., 1985; Siddiqui and Al-Harbi, 1999).
4.2. Nutrient use efficiency and environmental impacts
The food efficiency of the production system studied was relatively low (0.107 ± 0.002 and 0.030 ± 0.001 kg kg-1 of fish produced for N and P respectively excluding pond D, Table 4). Such values are lower than other Asian semi-intensive fish aquaculture systems in which commercial feed is not used (approx. 0.240 and 0.120 kg kg-1 of fish produced for N and P respectively; Nhan et al., 2008), but higher than Brazilian semi-intensive pellet-fed tilapia systems (approx. 0.081 and 0.017 kg kg-1 of fish produced for N and P respectively, Osti et al., 2018). This comparison reveals that, in our system, the commercial food is not efficiently assimilated suggesting that conventional intensification is not the best model for the
sustainable production of giant gourami. One explanation for this low efficiency involves a mismatch between the feeding strategy and the feeding behavior of this species. In fish species with small mouths, uneaten feed can reach 30% of the feed supplied (Meer et al., 1997; Verdegem, 2013). In contrast, for large-mouthed species, such as European eel or the African catfish Clarias gariepinus, which can swallow pellets whole, uneaten feed is limited to 1-10% (Heinsbroek et al., 1989; Verdegem, 2013). Because the giant gourami is a shy and small-mouthed species, uneaten feed likely represents a significant proportion of the nutrients accumulated in the sediment. Nevertheless, characterization of giant gourami diet in aquaculture ponds, using approach such as stable isotope analysis, is needed to confirm the assumption.
Mechanisms regulating the primary production in pond are multifactorial and complex. The relatively low primary production in ponds generously fertilized with organic manure such as in gourami ponds, suggests that farmers’ fertilization practices should be investigated and optimized (as suggested in Section 4.1). In opposite to the inorganic forms of nutrients in pond sediments, are immediately available for primary production, organic forms become available through heterotrophic microbial activity, which requires long periods of time (Muendo et al., 2014). The C:N ratio of feed and fertilizer can greatly affect heterotrophic microbial activity (Das and Jana, 2003). Thus, adjusting the C:N ratio by adding carbohydrates (Magondu et al., 2015) to organic fertilizers or by the use of low protein-to-energy ratio (P:E) fish diets (Kabir et al., 2019) may promote the growth of heterotrophic bacteria and thus enhance the availability of organic nutrients. Furthermore, little bioturbation was observed in our experiment; ponds showed homogeneous and relatively compact sediment. The presence of burrowing organisms such as bottom-feeding fish (e.g. common carp) may help increase the bioavailability of nutrients trapped in sediments (Ritvo et al.,
2004). However, more research is needed to understand the potential complex interactions between common carp and giant gourami in pond systems.
Despite the low feed efficiency of the system, a large proportion of nutrients was trapped in the sediments and the discharge in inflow water was low (0.0056 ± 0.0012 and 0.0001 ± 0.0001 kg kg-1 of fish produced for N and P, respectively, excluding pond D, Table 4). These values are significantly lower than the discharges observed in the production of giant gourami (0.0459 ± 0.0042 and 0.0226 ± 0.0008 kg kg-1 of fish produced for N and P, respectively) and three other species (C. gariepinus, C. carpio and O. niloticus; 0.0204-0.0499 and 0.0139-0.0226 kg kg-1 of fish produced for N and P, respectively) reared in cages in Indonesia (Syandri et al., 2018). Thus, the risks of water quality alteration associated with intensification remain low in earthen pond production systems highlighting the ecosystem services rendered by aquaculture ponds through the trapping of nutrients in sediments (Brugere et al., 2015). Such results suggest that environmentally friendly intensification is possible within these production systems without compromising water quality and, for these reasons, further investigations should be done on the ecological intensification of Indonesian earthen pond aquaculture (Slembrouck et al., 2018). Nevertheless, the limitations of the present study (see Section 4.3) should be considered when interpreting the results.
4.3. Study limitations
Nevertheless, the interpretation of some results presented in this study has to be done with caution. Our experiment was performed on four ponds using a unique zootechnical management method within a single fish farm. Thus, some trends, such as the linear increase of nutrient accumulated in sediments relative to the total nutrient inputs, need to be confirmed in further investigations carried out in a larger scale.
Only the major sources and sinks of N and P where considered in the present study. However, for the four ponds studied and for N and P, fewer nutrients were measured in the outputs than in the inputs. Indeed, about 20% of the total N and total P were not recovered in the measured outputs (Fig. 2 and 3).
Several processes were not measured in the present study due to technical constraints: N volatilization, denitrification, photosynthesis and respiration all influence the nutrient budget in ponds (Nhan et al. 2008). N volatilization accounts for a non-negligible part of the N budget in fish ponds. N losses by volatilization can reach 15% of the N inputs in intensive channel catfish Ictalurus punctatus ponds (Gross et al., 1999). Nevertheless, N volatilization depends strongly on pH and to a lesser extent temperature (Hargreaves, 1998) and occurs in alkaline conditions because only unionized ammonia (NH3) can be lost to the atmosphere
(Hargreaves 1998). In our production system, morning pH was close to 7.0, but the photosynthetic activity occurring during the diurnal period increased the pH throughout the day, which associated with high temperatures (Boyd and Tucker 1998), may enhance N volatilization.
In addition, we assumed that some uncertainties occurred in the estimation of nutrient concentration in the outflow water. Indeed, water flows out of the ponds through overflow PVC pipes, meaning that only the surface water was evacuated. Thus, the sampled water collected in the PVC pipe maybe not fully representative of the low water-exchange ponds. In such ponds, stratification of nutrients and micro-organisms can occur in the water column (Danos et al., 1983), even if the depth of the ponds did not exceed 0.55 m. Aeration systems (e.g. paddle wheel) ensure better water mixing but are technically difficult to set up due to the absence of electricity at the majority of the production sites.
5. Conclusion
The present study is one of the first to investigate nutrient use in small-scale freshwater aquaculture in Indonesia. Despite some limitations, it highlights the need for paying special attention to the monitoring of nutrient budgets in such production systems in which intensification has increased over the past years. In the studied semi-intensive production system, commercial feed and, to a lesser extent, organic fertilizers were the most important nutrient sources. Only a small fraction of nutrient inputs was taken up by harvested fish, and the largest fraction accumulated in the sediment with no nutrient enrichment observed in the outflow water. Nevertheless, further investigations at a larger scale are needed to determine the environmental impacts, especially on water quality, of intensification of freshwater aquaculture in Indonesia.
Acknowledgments
This publication is a production of the COFASP ERA-NET project “IMTA-EFFECT” funded by the European Union and French National Research Agency. The authors acknowledge Bang Macho and the local fish farmers in Babakan village for sharing their experiences and for their assistance throughout the duration of the study. Authors also thank laboratory staff of the IPB (Department of Aquaculture, Bogor) and SIG (Saraswanti Indo Genetech, Bogor) laboratories who carried out nutrient and chlorophyll analyses. This is publication ISEM 2019-018 SUD.
References
APHA, 2005. Standard methods for the examination of water and wastewater, American Public Health Association, Washington, USA.
AOAC, 1999. Official methods of analysis of AOAC International. Association of Official Analytical Chemists, Maryland, USA.
Aubin, J., Callier, M., Rey-Valette, H., Mathé, S., Wilfart, A., Legendre, M., Slembrouck, J., Caruso, D., Chia, E., Masson, G., Blancheton, J.-P., Haryadi, E.J., Prihadi, T.H., de Matos Casaca, J., Tamassia, S.T.J., Tocqueville, A., Fontaine, P. 2017. Implementing ecological intensification in fish farming: Definition and principles from contrasting experiences. Rev. Aquac. 0:1-19.
Boyd, C.E., 2003. Guidelines for aquaculture effluent management at the farm-level. Aquaculture 226:101-112.
Boyd, C.E., 1985. Chemical budgets for channel catfish ponds. Trans. Am. Fish Soc. 114:291-298.
Boyd, C.E., Gross, A., Rowan, M., 1998. Laboratory study of sedimentation for improving quality of pond effluents. J. Appl. Aquac. 8:39-48.
Boyd, C.E., Tucker, C.S., 1998. Pond aquaculture water quality management. Kluwer Academic Publishers, Boston, Massachusetts, USA.
Briggs, M.R.P., Fvnge‐Smith, S.J., 1994. A nutrient budget of some intensive marine shrimp ponds in Thailand. Aquac. Res. 25:789-811.
Brugere, C., Lymer, D., Bartley, D.M., 2015. Ecosystem services in freshwater fish production systems and aquatic ecosystems: Recognizing, demonstrating and capturing their value in food production and water management decisions. TEEB Agriculture & Food, UNEP, Geneva, Swiss.
Casillas-Hernández, R., Magallón-Barajas, F., Portillo-Clarck, G., Páez-Osuna, F., 2006. Nutrient mass balances in semi-intensive shrimp ponds from Sonora, Mexico using two feeding strategies: Trays and mechanical dispersal. Aquaculture 258:289-298.
Cuvier, G., Valenciennes, A., 1831. Histoire naturelle des poisons : Tome septième (in french), Levrault FG, Paris, France.
Danos, S.C., Maki, J.S., Remsen, C.C., 1983. Stratification of microorganisms and nutrients in the surface microlayer of small freshwater ponds. Hydrobiologia 98:193-202.
Das, S.K., Jana, B.B., 2003. Pond Fertilization Regimen. J. Appl. Aquac. 13:35-66.
Edwards, P., 2009. Changes in traditional inland aquaculture in West Java, Indonesia. Aquac. Asia Mag. 14:3-8.
FAO, 2017. FishStatJ: software for fishery statistical time series. Food and Agriculture Organization (FAO), Roma, Italy.
FAO, 2018. The state of world fisheries and aquaculture 2018: Meeting the sustainable development goals. Food and Agriculture Organization (FAO), Roma, Italy.
Green, B.W., Boyd, C.E., 1995. Chemical budgets for organically fertilized fish ponds in the dry tropics. J. World Aquac. Soc. 26:284-296.
Gross, A., Boyd, C.E., Wood, C.W., 1999. Ammonia volatilization from freshwater fish ponds. J. Environ. Qual. 28:793-797.
Hargreaves, J.A., 1998. Nitrogen biogeochemistry of aquaculture ponds1. Aquaculture 166:181-212.
Heinsbroek, L.T.N., van Thoor, R.M.H., Elizondo, L.J., 1989. The effect of feeding level on the apparent digestibilities of nutrients and energy of a reference diet for the European eel, Anguilla anguilla L., and the African catfish, Clarias gariepinus (Burchell, 1822). in: Aquaculture and Fisheries (Eds.) Proceedings 3rd International Symposium Feeding and nutrition in fish, Toba, Indonesia pp. 39.
Hlaváč, D, Másílko, J, Hartman P, Bláha, M., Pechar, L., Anton-Pardo, M., Adámek Z., 2015. Effects of common carp (Cyprinus carpio Linnaeus, 1758) supplementary feeding with modified cereals on pond water quality and nutrient budget. J. Appl. Ichthyol. 31:30-37. Kabir, K.A., Schrama, J.W., Verreth, J.A.J., Phillips, M.J., Verdegem, M.C.J., 2019. Effect of dietary protein to energy ratio on performance of Nile tilapia and food web enhancement in semi-intensive pond aquaculture. Aquaculture 499:235-242.
Ketola, H.G., Harland, B.F., 1993. Influence of phosphorus in rainbow trout diets on phosphorus discharges in effluent water. Trans. Am. Fish Soc. 122:1120-1126.
Krom, M.D., Porter, C., Gordin, H., 1985. Nutrient budget of a marine fish pond in Eilat, Israel. Aquaculture 51:65-80.
Magondu, E.W., Charo‐Karisa, H., Verdegem, M.C.J., Nyakeya, K., 2015. Enhancing productivity of Labeo victorianus ponds using maize flour as a carbohydrate source. Aquac. Nutr. 21:942–951.
Maskur, M., Rina, R., Hamid, M.A., 2013. Small-scale freshwater aquaculture extension development in Indonesia. https://enaca.org/?id=189&title=small-scale-aquaculture-extension-in-indonesia (accessed 22 September 2018).
Meer, M.B.V., Faber, R., Zamora, J.E., Verdegem, M.C.J., 1997. Effect of feeding level on feed losses and feed utilization of soya and fish meal diets in Colossoma macropomum (Cuvier). Aquac. Res. 28:391-403.
Muendo, P.N., Verdegem, M.C.J., Stoorvogel, J.J., Milstein, A., Gamal, E.-N., Duc, P.M., Verreth, J.A.J., 2014. Sediment accumulation in fish ponds; its potential for agricultural use. Int. J. Fish Aquat. Stud. 1:228-241.
Nhan, D.K., Verdegem, M.C.J., Milstein, A., Verreth, J.A.V., 2008. Water and nutrient budgets of ponds in integrated agriculture–aquaculture systems in the Mekong Delta, Vietnam. Aquac. Res. 39:1216-1228.
Osti, J.A.S., Moraes, M.A.B., Carmo, C.F., Mercante, C.T.J., 2018. Nitrogen and phosphorus flux from the production of Nile tilapia through the application of environmental indicators. Braz. J. Biol. 78:25-31.
Páez-Osuna, F., Guerrero-Galván, S.R., Ruiz-Fernández, A.C., Espinoza-Angulo, R., 1997. Fluxes and mass balances of nutrients in a semi-intensive shrimp farm in north-western Mexico. Mar. Pollut. Bull. 34:290-297.
Páez-Osuna, F., Ruiz-Fernández, A.C., 2005. Environmental load of nitrogen and phosphorus from extensive, semi-intensive, and intensive shrimp farms in the Gulf of California ecoregion. Bull. Environ. Contam. Toxicol. 74:681-688.
Pengseng, P., Boyd, C.E., 2011. Assessment of fertilizer application intervals for giant gourami (Osphronemus goramy Lacepede) in ponds. Walailak J. Sci. Technol. 8:33-40. Philips, M., Henriksson, P.J.G., Tran, N., Chan, C.Y., Mohan, C.V., Rodriguez, U.-P., Suri,
S., Hall, S., Koeshendrajana, S., 2015. Exploring Indonesian aquaculture futures. WorldFish, Penang, Malaysia.
Phong, L.T., Stoorvogel, J.J., van Mensvoort, M.E.F., Udo, H.M.J., 2011. Modeling the soil nutrient balance of integrated agriculture-aquaculture systems in the Mekong Delta, Vietnam. Nutr. Cycl. Agroecosystems 90:33-49.
Purnomo, C.W., Indartib, S., Wulandaric, C., Hinoded, H., Nakaskid, K., 2017. Slow release fertiliser production from poultry manure. Chem. Eng. Trans. 56:1531–1536.
R Development Core Team, 2016. R: a language and environment for statistical computing. R Foundation for Statistical Computing, Vienna, Austria.
Rimmer, M.A., Sugama, K., Rakhmawati, D., Rofiq, R., Habgood, R.H., 2013. A review and SWOT analysis of aquaculture development in Indonesia. Rev. Aquac. 5:255-279. Ritvo, G., Kochba, M., Avnimelech, Y., 2004. The effects of common carp bioturbation on
Schwartz, M.F., Boyd, C.E., 1994. Channel catfish pond effluents. Progress Fish-Cult. 56:273–281.
Shrestha, M.K., Lin, C.K., 1996. Phosphorus fertilization strategy in fish ponds based on sediment phosphorus saturation level. Aquaculture 142:207–219.
Siddiqui, A.Q., Al-Harbi, A.H., 1999. Nutrient budgets in tanks with different stocking densities of hybrid tilapia. Aquaculture 170:245-252.
Slembrouck, J., Samsudin, R., Pantjara, B., Sihabuddin, A., Legendre, M., Caruso, D., 2018. Choosing floating macrophytes for ecological intensification of small-scale fish farming in tropical areas: A methodological approach. Aquat. Living Resour. 31:1-9.
Syandri, H., Azrita, Mardiah, A., 2018. Nitrogen and phosphorus waste production from different fish species cultured at floating net cages in lake Maninjau, Indonesia. Asian J. Sci. Res. 11:287-294.
Udo, H.M.J., Steenstra, F.A., 2010. Intensification of smallholder livestock production, is it sustainable? in: Community Empowerment and Tropical Animal Industry (Eds.) The 5th International Seminar on Tropical Animal Production, Yogyakarta, Indonesia, pp. 19-26.
Verdegem, M.C., 2013. Nutrient discharge from aquaculture operations in function of system design and production environment. Rev. Aquac. 5:158-171.
Figure captions
Figure 1. Location of the study site in West Java Province and layout. Earthen ponds used for the experiments are indicated in gray (A, B, C and D). Each pond was supplied with water via PVC pipes connected to the water inlet channel (in gray, E). The evacuation channel is indicated in black (F). The arrows indicate the direction of water circulation. The site is located near a road (G) facilitating access and sample transportation.
Figure 2. Budget of nitrogen (N, expressed as % of the total inputs and kg ha-1) in semi-intensive monoculture of giant gourami. The variation between the four ponds is indicated by the areas shown in light gray.
Figure 3. Budget of phosphorus (P, expressed as % of the total inputs and kg ha-1) in semi-intensive monoculture of giant gourami. The variation between the four ponds is indicated by the areas shown in light gray.
Figure 4. Relationship between total nutrient inputs (through fertilizer, stocked fish, commercial feed and inflow water) and nutrient accumulation in sediments (kg ha-1 year) across the four earthen ponds for nitrogen (N) (A) and phosphorus (P) (B). Regression line is indicated in black and the gray area represents the 95% confidence level. The regression equation, coefficient of determination (R2) and significance (p-values) are also provided.
557 558 Figure 1 JAVA ISLAND kilometers 0 200 West Java Jakarta
WEST JAVA PROVINCE
kilometers 0 100 Bogor district FISH FARM N S E W A B C D E meters 0 100 F G
559 Figure 2 Commercial feed: 50-61%, 986±159 kg ha-1 Fertilizer: 31-37%, 594±71 kg ha-1 Stocked fish: 3%, 50±0 kg ha-1 Inflow water: 3-10%, 97±44 kg ha-1 INPUTS Accumulated sediments: 57-66%, 1042±38 kg ha-1 Outflow water: 3-7%, 69±28 kg ha-1 Harvested invertebrates: <1%, 9±4 kg ha-1 Harvested fish: 5-19%, 264±130 kg ha-1 Unaccounted: 18-22%, 344±44 kg ha-1 OUTPUTS
N budget
1740±175 kg ha-1560 Figure 3 Commercial feed: 56-65%, 275±44 kg ha-1 Fertilizer: 35-43%, 176±21 kg ha-1 Stocked fish: <1%, 3±0 kg ha-1 Inflow water: <1%, 1±0 kg ha-1 INPUTS Accumulated sediments: 73-80%, 349±38 kg ha-1 Outflow water: <1%, 2±1 kg ha-1 Harvested invertebrates : <1%, 1±0 kg ha-1 Harvested fish: 1-5%, 15±9 kg ha-1 Unaccounted: 16-22%, 88±19 kg ha-1 OUTPUTS
P budget
455±58 kg ha-1Table 1. Production parameters of the giant gourami culture system in earthen ponds.
563 * High mortalities due to a disease (presumably an infection by Aeromonas sp.) occurred
564 during the experiment
Pond No. Pond A Pond B Pond C Pond D
Pond characteristics
Surface (m2) 418 482 353 358
Water level (m) 0.55 0.52 0.46 0.47
Volume (m3) 230 252 162 167
Average water flow (% d-1) 3.8 3.7 7.7 10.7
Total volume exchanged (m3) 1328 1428 1901 2730
Preparation of the ponds
Lime (kg m-2) 0.1 0.1 0.1 0.1
Fertilizer (kg m-2) 2.7 2.3 2.1 2.1
Fish production
Stocking rate (fish m-2) 6.2 6.2 6.2 6.2
Individual body weight (g) 28.6±6.0 28.6±6.0 28.6±6.0 28.6±6.0
Initial number of fish 2590 2970 2200 2220
Final body weight (g) 195.2±54.8 191.1±26.8 191.9±49.1 154.8±41.0
Survival rate (%) 87 99 90 22*
565 Table 2. Summary of the physical and chemical parameters measured in the four ponds
566 throughout the five-month experiment. Data are expressed as Means ± SD. Measurements and
567 sampling were done between 08:00 and 10:00 AM.
Parameters Inlet Pond A Pond B Pond C Pond D
On-site measurements Temperature (°C) 28.9±1.3a 28.9±1.5a 28.9±1.5a 29.1±1.6a 29.2±1.6a pH 6.4±1.0 a 6.7±0.6a 6.8±0.6 a 6.9±0.5a 6.9±0.6a DO (mg L-1) 4.7±1.1a 4.4±2.2a 5.1±1.9a 5.5±2.8a 4.8±2.6a TDS (mg L-1) 37.6±7.1a 45.6±7.3a 47.0±11.6a 43.8±5.7a 46.1±4.9a Laboratory measurements Chlorophyll a (µ g L-1) 19±9 a 343±129b 468±300b 327±152 b 238±260 a BOD (mg L-1) 2.3±0.7a 3.9±1.8a 4.2±1.4a 4.0±1.7a 3.8±1.5a COD (mg L-1) 26.6±17.6a 26.7±16.4a 28.1±11.8a 23.9±19.6a 28.4±20.0a N (mg L-1) 2.0±0.4a 1.5±0.4ab 1.5±0.4ab 1.3±0.6b 1.6±0.4ab P (mg L-1) 0.012±0.019a 0.025±0.030a 0.055±0.050a 0.028±0.035a 0.029±0.045a NO₃-N (mg L-1) 1.59±0.29a 1.21±0.32ab 1.08±0.30ab 1.04±0.45b 1.17±0.39a NO₂-N (mg L-1) 0.06±0.06a 0.02±0.01a 0.02±0.02a 0.03±0.04a 0.06±0.11a PO₄³⁻ (mg L-1) 3.6±3.2a 2.9±2.4a 4.3±3.6a 2.9±2.3a 3.0±2.0a
Table 3. Budgets (kg ha-1) and use efficiency (kg kg-1 fresh fish) of nitrogen (N) and
570 phosphorus (P) in semi-intensive monoculture of giant gourami.
Inputs/Outputs Pond A Pond B Pond C Pond D % of the total inputs
(Mean ± SD) (a) N - Inputs Commercial feed 1066.3 1050.0 1079.6 748.1 56.8 ± 4.7 Fertilizer 691.7 599.8 546.0 538.4 34.4 ± 2.8 Stocked fish 50.3 50.0 50.6 50.4 2.9 ± 0.3 Inflow water 64.5 60.1 109.3 154.8 5.8 ± 3.3 Total inputs 1899.4 1760.0 1808.7 1491.7 100 N - Outputs Accumulated sediments 1075.5 1056.2 1049.7 986.7 60.6 ± 3.9 Harvested bivalves 1.2 0.9 0.6 2.3 0.08 ± 0.06 Harvested fish 322.7 332.8 331.7 69.9 14.9 ± 6.8 Outflow water 53.0 44.2 69.8 107.8 4.1 ± 2.2 Harvested snails 10.5 8.1 9.9 1.4 0.4 ± 0.2 Total outputs 1463.0 1442.2 1461.7 1168.1 80.6 ± 2.2 Unaccounted 409.8 317.8 323.9 323.6 19.9 ± 2.1 N - Efficiencies Feed efficiency* 0.109 0.105 0.106 0.369 0.172 ± 0.131 Discharges** 0.005 0.004 0.007 0.053 0.027 ± 0.024
572 Table 3. Continued
Inputs/Outputs Pond A Pond B Pond C Pond D % of the total inputs
(Mean ± SD) (b) P - Inputs Commercial feed 297.7 293.1 301.4 208.8 60.4 ± 3.7 Fertilizer 204.5 177.4 161.5 159.2 38.8 ± 3.6 Stocked fish 3.0 3.0 3.0 3.0 0.7 ± 0.1 Inflow water 0.4 0.3 0.6 0.9 0.1 ± 0.1 Total inputs 507.6 473.8 468.5 371.9 100 P - Outputs Accumulated sediments 368.7 381.0 351.9 295.2 77.0 ± 3.5 Harvested bivalves 0.3 0.2 0.1 1.0 0.1 ± 0.1 Harvested fish 25.2 16.1 14.8 3.2 3.1 ± 1.7 Outflow water 1.2 1.0 2.0 2.3 0.4 ± 0.2 Harvested snails 0.4 0.4 0.5 0.1 0.6 ± 0.03 Total outputs 395.6 398.6 369.2 301.8 80.8 ± 2.6 Unaccounted 109.9 75.1 97.3 70.1 19.3 ± 2.6 P - Efficiencies Feed efficiency* 0.030 0.029 0.030 0.103 0.048 ± 0.037 Discharges** 0.0001 0.0001 0.0002 0.0011 0.0012 ± 0.0015
573 *Efficiency (kg kg-1 of fish produced) = total nutrient inputs from food/total fish yields.
574 **Discharge (kg kg-1 of fish produced) = total nutrient quantity flushed out with outflow
577 Table 4. Nutrient (N and P) budgets in semi-intensive aquaculture ponds from selected
578 scientific literature.The nutrient budgets were not always balanced see the cited literature for
579 details.
Compartments Fish reared Nitrogen (N) % of the total inputs
Phosphorus (P)
% of the total inputs References Nutrient inputs
Feed and fertilizers
A B C 16-18 92-95 29-48 23-25 93-95 73-83 D E F Inflow water A B C 71-72 4-5 35-69 51-52 3-4 9-23 D E F Stocked fish A B C 11 2-3 <1 24-25 2 <1 D E F Nutrient outputs Harvested fish A B C 23-24 17-20 3-10 51-53 15-17 4-6 D E F Outflow water and
other water losses
A B C 66-68 10-13 52-103 56-59 43-51 14-67 D E F Sediments A B C - - 18-66 - - 34-77 D E F
A: Common carp (Cyprinus carpio), B: Tilapia (Oreochromis sp.), C: Several fish species,
including silver barb (Barbodes gonionotus), carps (Cirrhina mrigala, Cyprinus carpio and Hypophthalmichthys molitrix), tilapia (Oreochromis niloticus), gouramis (Helostoma temminckii, Osphronemus goramy) and catfishs (Clarias macrocephalus x Clarias gariepnus, Pangasius hypophthalmus), D: Hlaváč et al. (2015), E: Green and Boyd (1995) F: Nhan et al.