HAL Id: hal-02165628
https://hal-amu.archives-ouvertes.fr/hal-02165628
Submitted on 9 Jul 2019HAL is a multi-disciplinary open access
archive for the deposit and dissemination of sci-entific research documents, whether they are pub-lished or not. The documents may come from teaching and research institutions in France or abroad, or from public or private research centers.
L’archive ouverte pluridisciplinaire HAL, est destinée au dépôt et à la diffusion de documents scientifiques de niveau recherche, publiés ou non, émanant des établissements d’enseignement et de recherche français ou étrangers, des laboratoires publics ou privés.
Leaf Nutrients and Macroinvertebrates Control Litter
Mixing Effects on Decomposition in Temperate Streams
Mathieu Santonja, Hector Rodriguez-Perez, Nathalie Le Bris, Christophe
Piscart
To cite this version:
Mathieu Santonja, Hector Rodriguez-Perez, Nathalie Le Bris, Christophe Piscart. Leaf Nutrients and Macroinvertebrates Control Litter Mixing Effects on Decomposition in Temperate Streams. Ecosys-tems, Springer Verlag, 2020, 23 (2), pp.400-416. �10.1007/s10021-019-00410-9�. �hal-02165628�
TITLE: Leaf nutrients and macroinvertebrates control litter mixing effects on decomposition in
1
temperate streams 2
3
RUNNING HEAD: Litter mixture decomposition in temperate streams
4 5
AUTHORS: Mathieu Santonja1,2*, Héctor Rodríguez-Pérez1, Nathalie Le Bris1, Christophe
6 Piscart1 7 8 ADDRESSES 9
1. Univ Rennes, CNRS, ECOBIO UMR 6553, F-35000 Rennes, France.
10
2. Aix Marseille Univ, Avignon Université, CNRS, IRD, IMBE, Marseille, France.
11 12 *CORRESPONDING AUTHOR 13 Email: [email protected] 14 ORCID: 0000-0002-6322-6352 15 16
ABSTRACT
17
Plant litter decomposition is an essential ecosystem function in temperate streams. Both 18
riparian vegetation and decomposer communities are major determinants of the decomposition 19
efficiency and the interactions occurring within litter mixtures. However, the extent to which 20
such litter mixture interactions are affected by combined shifts in litter traits and decomposer 21
community is not well understood. We used leaf litter from 10 European tree species in order 22
to study litter decomposition and litter mixture effects occurring in two-species litter mixtures 23
in a temperate forested stream of northwestern France. The study distinguished between (i) 24
decomposition involving microorganisms alone or together with invertebrates, and (ii) 25
decomposition involving litter mixtures of similar or dissimilar nutrient content. Increasing 26
mean litter nutrient concentration favored both microbial activity and litter decomposition rate. 27
Surprisingly, the highest litter mixture effects occurred in mixtures containing two nutrient-rich 28
litters and occurred mainly in macroinvertebrate presence. Both the “mass-ratio hypothesis”, 29
expressed as the community weighted mean traits (TraitCWM), and the “niche complementarity
30
hypothesis”, expressed as the functional dissimilarity of litter traits (TraitFD), contributed to
31
explain litter mixture effects. However, TraitCWM was found to be a better predictor than TraitFD.
32
Finally, when evaluating the individual contributions of litter nutrients, calcium and magnesium 33
appeared as important drivers of litter mixture effects. Our findings suggest that the mass-ratio 34
hypothesis overrules the niche complementarity hypothesis as a driver of litter diversity effects. 35
Our study highlights the key importance of macroinvertebrates and of leaf nutrients, such as Ca 36
and Mg, which are often neglected in decomposition studies in streams. 37
38
KEYWORDS: Biodiversity-ecosystem functioning; community weighted means; functional trait 39
dissimilarity; litter traits; litter decomposition; litter nutrients; temperate stream 40
HIGHLIGHTS
41
- Macroinvertebrates and leaf nutrients drive microbial activity and litter decomposition 42
rate 43
- Macroinvertebrate presence and nutrient concentration control litter mixing effect 44
intensity 45
- Mean nutrient concentration is more important than concentration dissimilarity within 46
litter mixture
47 48
INTRODUCTION
49
Litter decomposition is an essential ecosystem function controlling the carbon (C) and 50
nutrient cycles in both terrestrial (Swift and others 1979; Cadish and Giller 1997) and aquatic 51
(Cummins 1974; Wallace and others 1997) ecosystems. Litter decomposition rate is jointly
52
affected by the litter traits (e.g. Cornwell and others 2008; Garcia-Palacios and others 2016), 53
the environmental conditions, such as the temperature (e.g. Fierer and others 2005; Follstad
54
Shah and others 2017), and the decomposer communities (e.g. Hättenschwiler and others 2015;
55
Gessner and others 2010; Jabiol and others 2013; Santonja and others 2018a). Rates of litter
56
decomposition are essentially controlled by litter chemistry (Cornwell and others 2008;
Garcia-57
Palacios and others 2016). In addition to secondary compounds (e.g. tannins) and fiber
58
components (e.g. lignin), concentrations of nutrients such as nitrogen (N) and phosphorus (P) 59
are useful litter traits for the prediction of the decomposition rates of single-species litter 60
(Gessner and Chauvet 1994; Cornwell and others 2008; Schindler and Gessner 2009).
61
Nevertheless, as mainly reported in terrestrial ecosystems, other nutrients such as calcium (Ca), 62
magnesium (Mg), potassium (K), sodium (Na), and sulfur (S), can also affect the decomposition 63
efficiency (Kaspari and others 2008; Makkonen and others 2012; Garcia-Palacios and others
64
2016). However, the potential importance of these nutrients is often neglected in decomposition 65
studies in streams compared to N and P. 66
In the majority of natural ecosystems, litter material from different plant species 67
decomposes together. Given that forested stream food webs are dependent upon allochthonous 68
leaf litter (Vannote and others 1980; Wallace and others 1997; Gessner and others 1999), 69
understanding the relationship between riparian tree species composition (and its associated 70
litter traits) and the decomposition rates in streams draining forested watersheds is of 71
considerable ecological importance (Swan and Palmer 2004; Kominoski and others 2007). 72
Changing plant species composition can modify litter trait control over decomposition in two 73
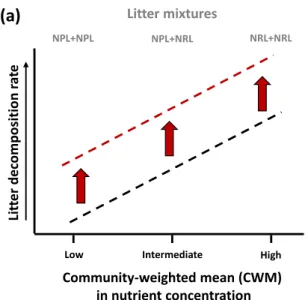
ways. First, according to the “mass-ratio hypothesis” (Grime 1998; Garnier and others 2004), 74
litter trait control over decomposition changes along community-weighted mean (CWM) trait 75
values (Fig. 1a, Quested and others 2007; Mokany and others 2008; Laughlin 2011). Second, 76
according to the “niche complementarity hypothesis” (Petchey and Gaston 2006; Diaz and
77
others 2007), a change in the functional dissimilarity (FD) of litter trait-values affects the degree
78
to which resource-use complementary occurs within the decomposer community, and its 79
capacity to induce non-additive litter mixing effects on decomposition (i.e. litter mixtures that 80
decompose at different rates than predicted by the mass-ratio hypothesis) (Fig. 1b, Wardle and
81
others 1997; Vos and others 2013; Handa and others 2014). These two mechanisms can operate
82
simultaneously by affecting both decomposer community and decomposition efficiency as a 83
result of plant (litter) composition change (e.g. Garcia-Palacios and others 2017; Santonja and
84
others 2018b). However, our knowledge about the relative importance of these two mechanisms
85
in controlling the decomposer communities and the efficiency of the decomposition process in 86
streams is very limited. 87
Mechanisms involved in positive litter mixing effects likely include nutrient transfer, 88
such as N or P, from nutrient-rich to nutrient-poor litter species. For example, nutrients may be 89
transported through fungal hyphae connecting two different leaf litter species (Schimel and
90
Hättenschwiler 2007; Gessner and others 2010; Lummer and others 2012), in which case an
91
acceleration of decomposition in species mixtures is expected since the nutrients are used more 92
efficiently overall. According to the literature (Wardle and others 1997; Sanpera-Calbet et al.
93
and others 2009; Santonja and others 2015a, 2015b; Santschi and others 2018), positive mixing
94
effects are most likely expected in the mixtures including one poor-quality litter species and a 95
high-quality one (Fig 1b; but see Frainer and others (2015) for contrasting results). However, 96
whether, and to what extent, mixing litter affects decomposition rates in streams remains much 97
debated, since litter mixture effects appear to be idiosyncratic (Schindler and Gessner 2009; 98
Gessner and others 2010; Cardinale and others 2011; Lecerf and others 2011). Previous studies 99
highlighting contrasting results have focused on the effects of N and P in explaining such litter 100
mixture effects (e.g. Frainer and others 2015; Santschi and others 2018). However, other key 101
nutrients, such as Mg or Ca, could potentially affect decomposition rates in litter mixtures. 102
Additionally, it is also not clear to what extent macroinvertebrates contribute to 103
decomposition in litter mixtures (Hättenschwiler and Gasser 2005; Swan and Palmer 2006b; 104
Swan 2011). Shredder macroinvertebrates can play a prominent role in the decomposition
105
process in stream ecosystems (Anderson and Sedell 1979; Cummins and Klug 1979; Handa and
106
others 2014; Garcia‐Palacios and others 2016), by consuming and fragmenting the litter
107
material (Allan 1996; Graça 2001), by stimulating microbial decomposition (Wetzel 1995; 108
Villanueva and others 2012), and by mediating plant diversity effects on litter decomposition
109
(Lecerf and others 2005; Kominoski and others 2007; Sanpera-Calbet and others 2009).
110
According to Cummins and others (1989), such a role played by macroinvertebrates would be 111
higher in litter mixtures of distinct degradability than in more homogeneous litter mixtures. 112
Indeed, this type of litter mixture could simultaneously create a suitable microhabitat (more 113
refractory litter) and a food resource (more labile litter). Additionally, litter mixtures could 114
promote an increase in both growth rate (Swan and Palmer 2006a) and macroinvertebrate 115
population due to their aggregative behavior (Presa-Abós and others 2006), enhancing therefore 116
the decomposition of litter mixtures (Sanpera-Calbet and others 2009). 117
In order to address these gaps, we used leaf litter from 10 common European tree species 118
to evaluate how litter diversity effects are affected by litter nutrients (Ca, K, Mg, N, Na, P, and 119
S) in a temperate stream. Moreover, in order to elucidate which organisms may be responsible 120
for mediating such litter diversity effects, we distinguished between decomposition involving 121
microorganisms alone (with decomposition in fine-mesh litterbags) and both microorganisms 122
and macroinvertebrates (with decomposition in coarse-mesh litterbags) (Boulton and Boon
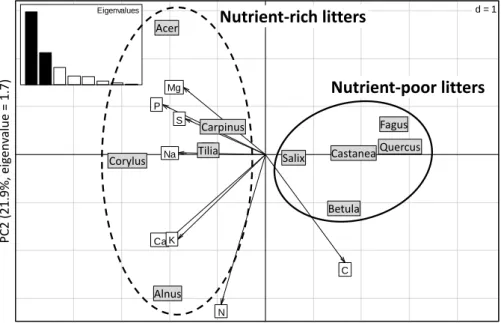
1991). Five of the plant species showed rich litter, while the other five showed nutrient-124
poor litter (Fig. 2). Mixtures of two litter species were created in all possible pairwise 125
combinations, in order to distinguish between litter mixtures of similar nutrient content (i.e. in 126
mixing two nutrient-poor or two nutrient-rich litters) and litter mixtures of dissimilar nutrient 127
content (i.e. in mixing one nutrient-poor litter and one nutrient-rich litter). Despite the fact that 128
both litter traits, litter mass loss and microbial activity are continuous variables, such artificial 129
distinction into two discrete nutrient categories was necessary to better understand where and 130
why litter diversity effects occur. We evaluated (i) the litter decomposition rate and the 131
microbial activity (i.e. CO2 production) in the two-species litter mixtures, and (ii) the litter
132
diversity effects occurring on the decomposition rate and on the microbial activity in these litter 133
mixtures after 30 days of immersion in a temperate forested stream in northwestern France 134
(Piscart and others 2009).
135
First, according to the “mass-ratio hypothesis” (Grime 1998; Garnier and others 2004), 136
the increase in both litter decomposition rate and microbial activity would be positively 137
correlated to the increase in CWM scores in nutrient concentration within the litter mixture 138
(Cornwell and others 2008; Foucreau and others 2013). Therefore, in our first hypothesis, we
139
predicted higher litter decomposition rate and microbial activity in the mixture of two nutrient-140
rich litters (Fig. 1a). Second, according to the “niche complementarity hypothesis” (Petchey
141
and Gaston 2006; Diaz and others 2007), mixtures of very dissimilar litter species yield the
142
highest FD scores and are related to higher litter diversity effects (Wardle and others 1997; 143
Lecerf and others 2011; Santschi and others 2018). Thus, in our second hypothesis, we
144
predicted the highest litter diversity effects in the mixtures of nutrient-poor and nutrient-rich 145
litters (Fig. 1b), which would be shown by an increase in litter decomposition rate and microbial 146
activity due to synergistic effects between the two litters in mixtures in the present study. 147
Finally, macroinvertebrates may contribute up to 6 times more influence than microorganisms 148
on litter decomposition in temperate unaltered forested streams (Piscart and other 2009), favor 149
microbial community development (Wetzel 1995; Villanueva and others 2012), and mediate 150
litter diversity effects (Lecerf and others 2005), we hypothesized that litter decomposition rate, 151
microbial activity, and litter diversity effects would be enhanced by macroinvertebrate presence 152
(Figs. 1a and 1b).
153 154
MATERIALS AND METHODS
155 156
Study site and material collection 157
The experiment was conducted in the Hermitage stream, located in the Villecartier 158
Forest in northwestern France (48°28’ N, 1°33’ W). The stream bed was dominated by sand 159
and leaf litter (site H1 in Piscart and others 2009). The stream water was circumneutral, well-160
oxygenated, and possessed moderate nutrient concentrations (Piscart and others 2009): 11 ± 1 161
mg l-1 dissolved oxygen, 49 ± 18 µg N l-1 ammonium, 510 ± 19 µg N l-1 nitrate, 10 ± 8 µg N l
-162
1 nitrite, 19 ± 8 µg P l-1 phosphate. The macroinvertebrate community of the Hermitage stream
163
was composed of species belonging to the Amphipoda, Isopoda and Trichoptera orders, with 164
crustaceans representing 74% of this macroinvertebrate community (Supplementary Table S1). 165
Fagus sylvatica was the dominant tree species in the forested watershed, but the riparian 166
vegetation was composed of diverse deciduous tree species, including those employed in the 167
experiment. 168
The leaf litter of 10 common European tree species was collected: Acer platanoides, 169
Alnus glutinosa, Betula pendula, Castanea sativa, Corylus avellana, Carpinus betulus, Fagus 170
sylvatica, Quercus robur, Salix atrocinerea and Tilia cordata, hereafter referred to by their 171
genus name. These 10 species were selected using the existing literature (e.g. Lecerf and others
172
2007; Schindler and Gessner 2009; Santonja and others 2018a), based on the nutrient
concentrations of their leaves, to represent five species with nutrient-rich litter (NRL), and five 174
with nutrient-poor litter (NPL) (Fig. 2; a cluster analysis well discriminates these two groups). 175
Freshly abscised leaves were collected over the entire period of maximum litter fall, from 176
October to November 2015. They were dried at room temperature, and stored until the 177
beginning of the experiment. 178
179
Litter decomposition experiment 180
Leaf litter decomposition was studied for a period of 30 days, using the litterbag method 181
(Boulton and Boon 1991). Coarse- and fine-mesh litterbags (5 mm and 0.5 mm mesh size,
182
respectively) were used and filled with 2 g of dry leaves. The leaf litter enclosed in fine-mesh 183
litterbags was only accessible to microorganisms, whereas the coarse-mesh bags also allowed 184
access to macroinvertebrates. The litterbags contained either a single species (10 treatments) or 185
a mixture of two species in all possible pairwise combinations (45 treatments). The mixed-186
species litterbags received equal amounts of both species (i.e. 1 g). A total of 440 litterbags ([10 187
single-species + 45 two-species mixtures] × 2 mesh sizes × 4 replicates) were used for the 188
experiment. 189
In December 2016, the litterbags were immersed for 30 days in the Hermitage stream. 190
After removal, the litterbags were immediately sealed in plastic bags to prevent the loss of litter 191
material and were transported to the laboratory. The leaves were separated by species, which 192
was possible even with small fragments of litter (owing to marked morphological differences 193
among the species) and were carefully cleaned under water to remove macroinvertebrates and 194
attached sediment particles. 195
Avoiding the central veins, six leaf discs (10 mm-diameter) for the single-species litters, 196
or three disks for each species in the two-species litter mixtures, were cut for the purpose of 197
microbial activity measurement. The remaining leaf material was frozen at -20 °C. 198
199
Microbial activity measurement 200
Microbial CO2 production measurements, as a measure of overall heterotrophic
201
microbial activity, were performed in order to evaluate the activity of the microbial 202
communities that colonized the leaves after 30 days of decomposition. We adapted the protocol 203
proposed by Anderson and Domsch (1973). Briefly, the six leaf disks taken in each litterbag 204
were placed in 125 ml glass bottles with 25 ml of filtered water (GF/F glass microfiber filter, 205
WhatmanTM) from the Hermitage stream and then preincubated for 12 h at 20 °C in the dark 206
allowing the microbial respiration to saturate the water with CO2. In the matter of fact, at
207
constant temperature, it is only possible to increase the CO2 concentration in the air phase of
208
the respiration chamber if the aqueous phase is oversaturated in CO2. After a night of remaining
209
open to the atmosphere, the respiration chambers were hermetically sealed and the first sample 210
of air was taken, the second air sample was sampled after a 4 h incubation at 20 °C in the dark. 211
CO2 production in a given time (i.e. 4 h) was then calculated as the difference between the final
212
CO2 concentration and the initial CO2 concentration. Preliminary studies with our experimental
213
conditions demonstrated that the CO2 production was linear and, since all the process of
214
incubation occurred in the dark, there was no photosynthesis and thus no alteration of the 215
dissolved CO2 partial pressure. In total, 440 respiration chambers, corresponding to the 440
216
litterbags, were prepared. At the beginning and at the end of the incubation period, 1 ml of air, 217
taken with a syringe, was injected into a gas chromatograph (μGC SRA A 3000) in order to 218
estimate the microbial activity (i.e. CO2 air content). The leaf discs were then dried at 65 °C for
219
72 h and the CO2 production was calculated as µg C-CO2 per hand per g of litter dry mass (±
220
0.1 mg). 221
In parallel to the measurement of the microbial activity, the leaves remaining in the 440 222
litterbags were dried at 65 °C for 72 h, and then weighed to the nearest 0.1 mg. After weighing 223
the leaf disks and remaining leaf litter, all the litter material from a given litterbag was combined 224
and ground to a fine powder using a ball mill, before measuring the litter ash content. We 225
obtained ash-free dry mass by burning the combined sample at 550 °C for 4 h. Additional 226
samples were also used to estimate ash-free dry mass of the initial litter material. The percentage 227
of ash-free dry mass data was used to correct both the initial and the remaining leaf material 228
before the computation of (i) the percentage of litter mass loss after 30 days of field 229
decomposition and (ii) the microbial CO2 production per h and per g of litter.
230 231
Litter trait measurement 232
The initial litter traits were determined from four samples of each of the 10 litter species 233
(Supplementary Table S2). Prior to the chemical analysis, each litter sample was ground into
234
powder using a ball mill. The carbon (C), nitrogen (N), and sulfur (S) concentrations were 235
determined by thermal combustion, using a Vario Pyro cube CNS analyzer (Elementar France 236
SARL, Lyon, France). The phosphorus (P) concentration was measured colorimetrically using 237
the molybdenum blue method (Grimshaw and others 1989). To 80 mg of ground litter sample 238
8 ml of HNO3 and 2 ml of H2O2 were added and the mixture was heated at 175 °C for 40 min
239
using microwaves (Ethos One, Milestone SRL, Italy). After this mineralization step, the sample 240
was diluted to a total of 50 ml. A hundred µl of sample, 100 µl of NaOH, 50 µl of mixed reagent 241
(emetic tartar and ammonium molybdate solution), and 50 µl of ascorbic acid were mixed 242
directly in a 96 well microplate. After 30 min at 40 °C, the reaction was completed, and the P 243
concentration was measured at 720 nm using a microplate reader (Victor, PerkinElmer, 244
Singapore). Following the mineralization step (i.e. the same as for P analysis), calcium (Ca), 245
magnesium (Mg), potassium (K), and sodium (Na) concentrations were measured using an 246
atomic absorption spectrometer (AAS, iCE 3000 series, ThermoScientific, China). 247
To assess the “mass-ratio hypothesis”, we calculated the community-weighted mean 248
(CWM) trait values of litter mixtures as the average trait values of litter mixtures following 249
Garnier and others (2004) as: TraitCWM = ∑𝑛𝑖=1𝑝𝑖 × 𝑡𝑟𝑎𝑖𝑡𝑖, where pi is the relative abundance
250
for species i in the litter mixture and traiti is the trait value for species i. These calculations were
251
performed for each of the 8 litter traits. The highest scores of CWM were reached for litter 252
mixtures containing two litter species with the highest nutrient concentrations (Fig. 1a). Since 253
we predicted that both microbial activity and litter decomposition rate respond to the “mass-254
ratio hypothesis”, we expected the increase in both decomposition rate and microbial activity 255
to be positively correlated to the increase in CWM values. 256
To assess the “niche complementarity hypothesis”, we calculated the functional 257
dissimilarity (FD) of litter mixtures according to Rao’s quadratic entropy (Botta Dukat 2005; 258
Epps and others 2007) as: TraitFD = ∑ni=1∑nj=1𝑝𝑖𝑝𝑗 ∗ 𝑑𝑖𝑗, where pi and pj are the relative
259
abundance for species i and j in the litter mixture, and dij the Euclidian distance between species
260
i and j for the trait considered. These calculations were performed for each of the 8 litter traits. 261
The highest scores of FD were reached for litter mixtures containing two species with very 262
dissimilar nutrient concentrations (Fig. 1b). Since we predicted that the litter diversity effects 263
respond to the “niche complementarity hypothesis”, we expected the increase in relative litter 264
mixture effects to be positively correlated to the increase in FD values. 265
266
Statistical analyses 267
All of the statistical analyses were conducted using R software (R Core Team 2013), 268
with significance levels indicated as * for P < 0.05, ** for P < 0.01, and *** for P < 0.001. 269
A principal component analysis (PCA) was conducted using the values of the eight 270
measured litter traits of the 10 tree species (Supplementary Table S2) in order to discriminate 271
the five tree species with rich litter (NRL) from the other five tree species with nutrient-272
poor litter (NPL). The differences in the initial litter traits were assessed using one-way 273
ANOVAs, followed by Tukey’s tests to carry out post-hoc pairwise comparisons. 274
For the single-species litter, three-way ANOVAs, followed by Tukey’s post hoc tests, 275
were used to test for the effects of litter type (separated in NPL vs. NRL), litter species identity 276
(10 litters), macroinvertebrate presence (fine-mesh bag [FMB] vs. coarse-mesh bag [CMB]), 277
and their interactions on litter decomposition rate and microbial activity. 278
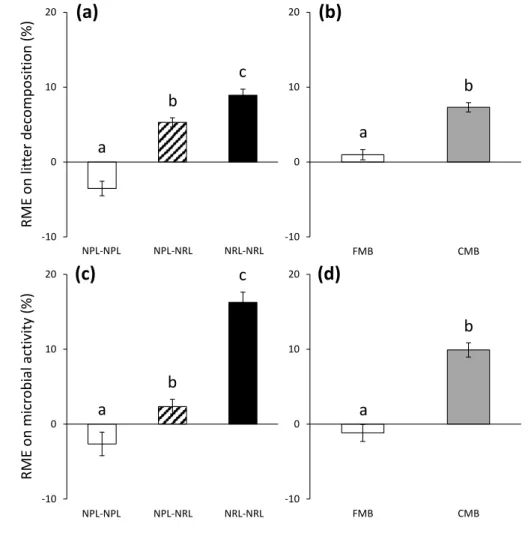
In order to further test whether litter decomposition and microbial activity differed 279
between litter mixtures and single litter species, the relative litter mixture effects (RME) on 280
litter decomposition rate and microbial activity were calculated. The RME was calculated as 281
the relative difference between the observed litter decomposition rate/microbial activity (O) 282
from the litter mixtures compared to those expected based on the respective single litter species 283
treatments (E), following the formula (O − E) / E × 100% (Wardle and others 1997). One-284
sample Student’s t-tests were used to test whether the RME were significantly different from 285
zero. 286
For the two-species litter mixtures, two-way ANOVAs, followed by Tukey’s post hoc 287
tests, were used to test for the effects of litter mixing (NPL-NPL, NPL-NRL and NRL-NRL), 288
macroinvertebrate presence (FMB vs. CMB), and their interactions i) on litter decomposition 289
rate and microbial activity and ii) on the RME on litter decomposition rate and on microbial 290
activity. 291
For a more detailed understanding of how the mixture of leaf litter affected the litter 292
decomposition rate and microbial activity, we evaluated the effects of the mean litter traits 293
(TraitCWM) and functional litter trait dissimilarities (TraitFD) of the eight measured litter traits
294
(Supplementary Table S2). First, a principal component analysis (PCA) was conducted using
295
the CWM or the FD values of the eight measured litter traits across the 45 two-species litter 296
mixtures. CWM1 and CWM2, and FD1 and FD2 represented the two first components of the 297
PCAs conducted using the CWM or the FD values across the litter mixtures, respectively. 298
Second, multiple linear regression models were performed in order to decipher the relative 299
contributions of TraitCWM and TraitFD. In these models the effects of the TraitsCWM (i.e. CWM1
300
and CWM2), TraitsFD (i.e. FD1 and FD2), macroinvertebrate presence (FMB vs. CMB), and
301
their interactions were tested i) on litter decomposition rate and microbial activity and ii) on the 302
RME on litter decomposition rate and on microbial activity. 303 304 RESULTS 305 306 Litter traits 307
The PCA based on the element concentrations showed that the first PCA axis explained 308
50.2% of the variation and discriminated between the nutrient-rich litters (NRL) on the left and 309
the nutrient-poor litters (NPL) on the right of the axis (Fig. 2). 310
311
Litter species incubated individually 312
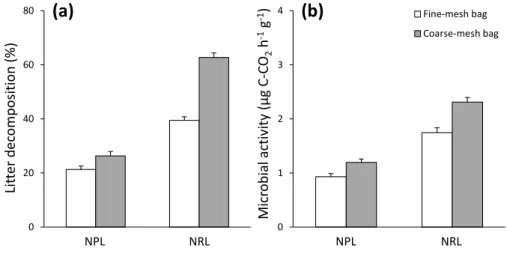
The NRL exhibited two times more litter mass loss and microbial activity than the NPL 313
(Table 1; Fig. 3). The presence of macroinvertebrates increased the litter mass loss and the
314
microbial activity, but this effect was dependent on the litter type (litter type × mesh size 315
interaction, Table 1). This significant interaction was explained by a stronger increase in litter 316
mass loss and microbial activity in the NRL category (+59% litter mass loss and +33% 317
microbial activity) compared to the NPL category (+23% litter mass loss and +28% microbial 318
activity) (Fig. 3). 319
In addition, litter mass loss and microbial activity were significantly affected by litter 320
species identity (Table 1). Within the NRL category, Alnus showed the highest litter mass loss 321
compared to the four other species (Supplementary Fig. S1a), as well as a higher microbial 322
activity than Carpinus, Acer, and Tilia (Supplementary Fig. S1b). Within the NPL category, 323
Salix and Betula showed both a higher litter mass loss and a higher microbial activity than the 324
three other species (Supplementary Fig. S1a and S1b). The positive effect of the 325
macroinvertebrate presence on the litter mass loss also varied according to the litter species 326
identity (litter species × mesh size interaction, Table 1), as the effects ranged from +68% for 327
Alnus to an absence of effect for Fagus (Supplementary Fig. S1a).
328 329
Effects of mixing low- and high-quality litter 330
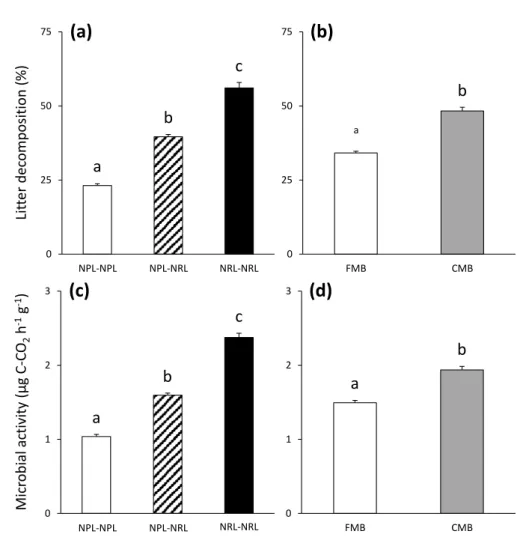
Litter mass loss and microbial activity increased according to the gradient NPL-NPL < 331
NPL-NRL < NRL-NRL mixtures (Table 2; Fig. 4a and 4c), with two times more litter mass 332
loss and microbial activity in mixtures of two nutrient-rich litters compared to the mixtures of 333
two nutrient-poor litters. The relative mixture effects (RME) on litter mass loss and on 334
microbial activity showed a similar trend, with an increase in RME according to the same 335
gradient (Table 2; Fig. 5). The NPL-NPL mixtures lost -3.5% litter mass compared with the 336
expected values from the respective single litter species (Fig. 5a), while the observed microbial 337
activity of the NPL-NPL mixtures did not differ significantly from the expected values (Fig.
338
5c). The NPL-NRL mixtures lost +5.3% litter mass than expected from the respective single 339
litter species (Fig. 5a), while the observed microbial activity of the NPL-NRL mixtures did not 340
differ from the expected values (Fig. 5c). The NRL-NRL mixtures showed +8.9% litter mass 341
and +16.3% microbial activity than expected from the respective single litter species (Figs. 5a
342
and 5c).
343
Litter mass loss and microbial activity were respectively 41% and 30% higher with 344
macroinvertebrates than without (Table 2; Fig. 4b and 4d). The RME on litter mass loss and on 345
microbial activity were also higher with macroinvertebrates than without (Table 2). 346
Specifically, the litter mixtures exhibited synergistic effects in the presence of 347
macroinvertebrates, with +7.3% litter mass loss and +9.9% microbial activity than expected 348
from the respective single litter species (Figs. 5b and 5d). 349
350
CWM- versus FD-trait control over litter decomposition rate and microbial activity 351
The PCA of the CWM traits showed that the first PCA axis (CWM1), explaining 50.2% 352
of the variation, was determined by high scores of P and Ca concentrations, and, to a lower 353
extent, by the scores of the K, Mg, Na, and S concentrations (Supplementary Fig. S2a). The 354
low scores of the second PCA axis (CWM2), explaining 21.9% of the variation, were related 355
to high values of N and C concentrations (Supplementary Fig. S2a). Regarding functional trait 356
dissimilarity, high scores of the first PCA axis (FD1), explaining 28.5% of the variation, were 357
related to the increase in dissimilarity in the Mg, S, and C concentrations, while the low scores 358
were related to the increase in dissimilarity in the N and Ca concentrations (Supplementary Fig.
359
S2b). The low scores along the second axis (FD2), explaining 22.0% of the variation, were 360
largely dependent on the increase in dissimilarity in the K, Na, and P concentrations 361
(Supplementary Fig. S2b).
362
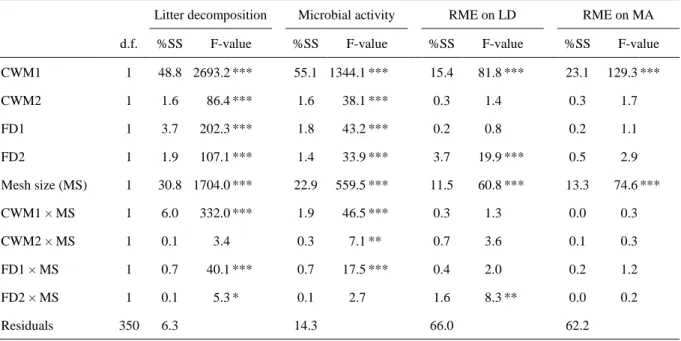
When simultaneously evaluating the effects of the CWM and FD traits (Table 3), we 363
found that both litter mass loss and microbial activity were mainly controlled by the CWM 364
values (i.e. increasing mean nutrient concentrations within the litter mixture) compared to the 365
FD values (i.e. increasing dissimilarity in nutrient concentrations within the litter mixture). In 366
fact, CWM values (CWM1 + CWM2) explained respectively 9 and 15 times more of the overall 367
variance in litter mass loss and in microbial activity than FD values (FD1 + FD2) (Table 3). 368
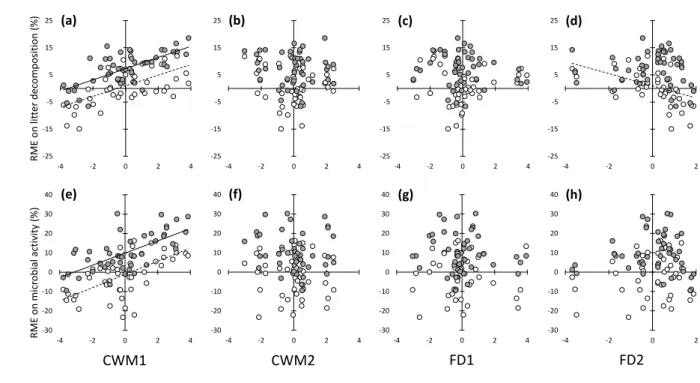
When simultaneously evaluating the effects of the CWM and FD traits on RME, we 369
found that the RME on litter mass loss was controlled by the CWM (CWM1), the presence of 370
macroinvertebrates, and the interaction between the FD and the presence of macroinvertebrates 371
(FD2 × mesh size) (Table 3). Increasing CWM1 scores was related to higher RME (Fig. 6a). 372
The significant interaction between FD2 and mesh size (Table 3) showed that increasing FD in 373
the initial K, Na, and P concentrations stimulated microbial-driven RME (Fig. 6d). Concerning 374
the RME on microbial activity, it was found to be significantly affected only by CWM1 and the 375
presence of macroinvertebrates (Table 3). Similar to what we observed for litter mass loss, 376
increasing CWM1 scores was related to higher RME on microbial activity (Fig. 6e). 377
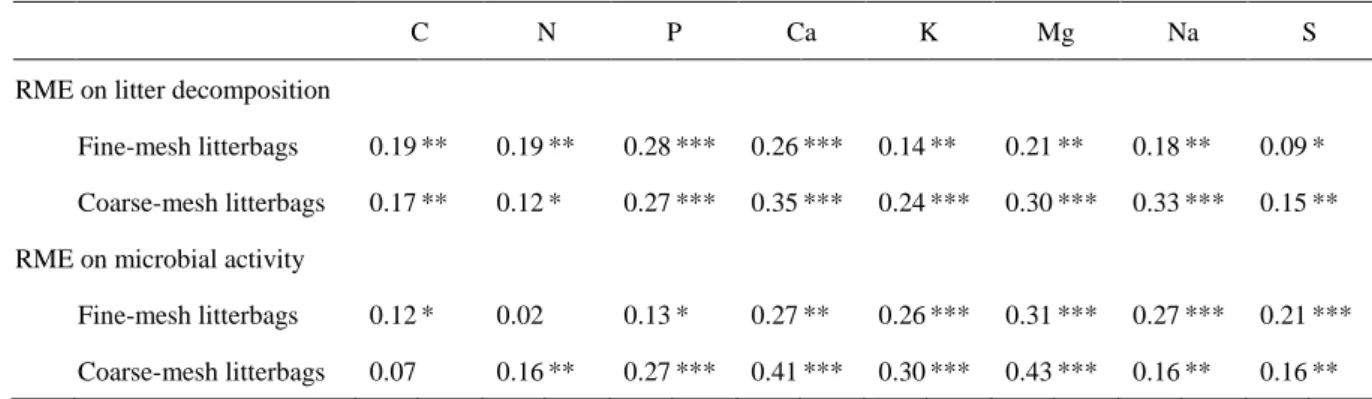
The RME on litter mass loss appeared to be more strongly correlated with the increase 378
in P, Ca, Mg and Na concentrations than with the K, N, or S concentrations, and these 379
relationships were more marked in the coarse-mesh litterbags in which macroinvertebrates were 380
present, than in the fine-mesh litterbags in which macroinvertebrates were absent (Table 4). 381
The RME on microbial activity appeared to be more strongly correlated with the increase in 382
Ca, K, and Mg concentrations than in N and P concentrations, and these relationships were also 383
more marked in the presence than in the absence of macroinvertebrates (Table 4). 384
385
DISCUSSION
386 387
Niche complementarity hypothesis vs. mass-ratio hypothesis for explaining litter diversity 388
effects 389
We found evidence of leaf litter diversity effects on decomposition rates, including 390
additive, synergistic, and antagonistic effects, as previously shown in other studies (Kominoski
391
and others 2007; Srivastava and others 2009; Lecerf and others 2011; Handa and others 2014).
392
Surprisingly, the pattern observed in our study highlighted that the largest mixture effects 393
occurred in mixtures containing the combination of two nutrient-rich litters (NRLs), rather than 394
in mixtures of one nutrient-rich litter (NRL) and one nutrient-poor litter (NPL), as predicted in 395
our second hypothesis (Fig. 1b). Such a finding is in agreement with the mass-ratio hypothesis, 396
and emphasizes the fact that increasing the mean value of the nutrient pool in litter mixtures 397
favors the occurrence of litter diversity effects. In any case our results pointed out that the litter 398
diversity effects on decomposition were strongly litter-quality dependent. This finding is 399
congruent with the recent study of Jabiol and Chauvet (2015) in which higher synergistic effects 400
on litter decomposition occurred when Alnus glutinosa was combined with Fraxinus 401
angustifolia (i.e. two NRLs) than when Alnus glutinosa was combined with Quercus ilex (i.e. 402
one NRL and one NPL). 403
Surprisingly, TraitCWM proved to be a better predictor of litter diversity effects than
404
TraitFD, for both the coarse- and fine-mesh litterbags, contrasting with our second hypothesis.
405
Indeed, based on the well-developed literature on the drivers of the litter decomposition process 406
(e.g. Hättenschwiler and others 2005; Cornwell and others 2008; Gessner and others 2010; 407
Makkonen and others 2012; Vos and others 2013; Handa and others 2014; Garcia-Palacios and
408
others 2017), we expected that litter diversity effects occur when there are increases in the
409
nutrient concentration dissimilarity of the litter mixtures (i.e. according to the niche 410
complementary hypothesis, Fig. 1b), while the mean nutrient concentration within the litter 411
mixture must only explain the litter decomposition rate (i.e. according to the mass-ratio 412
hypothesis, Fig. 1a). The results from the coarse-mesh litterbags showed no evidence of nutrient 413
dissimilarity effect (TraitFD), conforming with the conclusion of Frainer and others (2015),
414
which also highlighted, over a lower range of litter traits (N, P, and lignin), that no litter 415
dissimilarity effect was involved in the litter diversity effects occurring in two-species mixtures. 416
In contrast, TraitFD was linked to the litter diversity effects for the fine-mesh litterbags. In this
417
case, litter mixtures with contrasting nutrient concentrations may have improved the availability 418
of different nutrient sources for microorganisms (Schimel and Hättenschwiler 2007; Handa and
419
others 2014), as suggested by the niche complementarity hypothesis. Filamentous fungi,
420
including the aquatic hyphomycetes that dominate fungal communities on decomposing leaves 421
in streams (Krauss and others 2011), can indeed extend their hyphae over considerable distances 422
in order to acquire remote resources that they transport to the locations of active hyphal growth 423
(Ritz 2006). It has previously been suggested that fungi-driven N transfer among litter species
424
varying in their initial N concentration may contribute to litter mixture effects (Schimel and
425
Hättenschwiler 2007; Vos and others 2013; Handa and others 2014). Thus, nutrients from a
426
nutrient-rich litter may be translocated to another litter depleted in nutrient (i.e. a nutrient-poor 427
litter; Schimel and Hattenschwiler 2007; Handa and others 2014). Therefore, our findings 428
highlighted that both TraitCWM and TraitFD contributed to explain litter diversity effects driven
429
by microorganisms alone. Interestingly, TraitFD did not explain litter diversity effects driven by
430
microorganisms and macroinvertebrates together. In this case, it could be hypothesized that the 431
additional nutrients provided by macroinvertebrate feces alleviated the nutrient limitation for 432
microorganisms (Wetzel 1995; Joyce and Wotton 2008), and consequently the TraitFD
433
contribution to litter diversity effects. 434
435
Macroinvertebrates control over decomposition and litter diversity effects 436
Across all of the 45 litter mixtures, litter mixture decomposition was not found to be 437
enhanced in the fine-mesh litterbags (i.e. additive effects), while the litter mixtures in the 438
coarse-mesh litterbags lost on average 7.3% more mass than the litter in the single-species 439
treatments (i.e. synergistic effects). The absence of litter mixture effects when 440
macroinvertebrates were excluded suggests that the activity of microbial decomposers alone 441
did not induce any effect of litter mixture on decomposition in the studied temperate stream. 442
Previous studies performed in lotic systems, where decomposition primarily involves 443
microorganisms, have also reported a lack of a synergism (Ferreira and others 2012; Bruder
444
and others 2014). For instance, similar to our findings, Jabiol and Chauvet (2015) reported that
445
no effect of litter mixture was observed when detritivores were excluded during the litter 446
decomposition in a Mediterranean stream in southern France. In a laboratory experiment, Swan
and Palmer (2006b) also reported that litter mixture effects were contingent on the feeding 448
activity of the isopod Caecidotea communis. 449
In homogenous species mixtures comprising litters of a single litter category, 450
macroinvertebrates have little choice to select among different qualities of leaves, as opposed 451
to the choice offered between leaf litter species in heterogeneous litter mixtures (Swan and
452
Palmer 2006b). However, as macroinvertebrates can simultaneously exploit multiple litter
453
species to meet their elemental demands (Leroy and Marks 2006), combining two NRLs that 454
nutritionally complement one another might stimulate the feeding activity of detritivores (Vos
455
and others 2013). For example, the mixing of one P-rich with one N-rich species in the present
456
study (such as Acer platanoides and Alnus glutinosa, respectively) increased litter mass loss of 457
the mixture by 14%, probably due to the increased nutritional value of such litter mixing. In 458
contrast, mixing two P-rich species (e.g. Acer platanoides and Carpinus betulus) increased litter 459
mass loss of the mixture by only 4%, while mixing two P-poor species (e.g. Castanea sativa 460
and Fagus sylvatica) decreased litter mass loss of the mixture by 10%. Alternatively in 461
NRL+NPL mixtures, high detritivore density may be promoted by the co-occurrence of a 462
suitable resource, such as that provided by the nutrient-rich litter, and a complex and structured 463
habitat provided by the nutrient-poor litter (Sanpera-Calbet and others 2009; Jabiol and others
464
2014).
465 466
Litter nutrients control over decomposition and litter diversity effects 467
In agreement with our predictions and the literature, nutrient-rich litters decomposed 468
faster than nutrient-poor litters, confirming that nutrient concentration is an important 469
determinant of leaf litter decomposition (Kaspari and others 2008; Makkonen and others 2012; 470
Garcia-Palacios and others 2016). The rates of litter decomposition observed in the present
471
study were similar to those reported in other studies concerning temperate streams (e.g. Lecerf
and others 2007; Schindler and Gessner 2009; Frainer and others 2015). For instance, Lecerf
473
and others (2007) reported 80% and 42% mass loss for Alnus glutinosa (i.e. a nutrient-rich
474
litter) and Quercus robur (i.e. a nutrient-poor litter), respectively, after 34 days of 475
decomposition in a temperate stream in central France. The results of the present study were 476
also similar to the 16.5% mass loss for Fagus sylvatica (i.e. a nutrient-poor litter) after 30 days 477
of decomposition obtained in the same Petit Hermitage stream in February 2005 (Piscart and
478
others 2009).
479
Moreover, our results also highlighted the important role of nutrients not usually 480
considered in litter diversity experiments. The first principal component of the CWM-trait PCA 481
was the main driver of litter diversity effects in both fine- and coarse-mesh litterbags, and was 482
driven by P, Ca, K, Mg, Na, and S. Their relative content in the leaves is closely related to one 483
other (Garcia-Palacios and others 2016), hampering a straightforward interpretation of 484
combination of elements. Nevertheless, when evaluating the individual contributions of litter 485
nutrients, Ca and Mg appeared to be important drivers of litter diversity effects compared to N 486
(and to P only for microbial activity), suggesting for the first time that these two nutrients may 487
play an important role in litter diversity effects in addition to, or independently of, the P or N 488
content. The Ca content is known to positively affect the growth and activity of aquatic 489
hyphomycetes, by enhancing the fungal capacity to transfer N between distinct litter types 490
(Jenkins and Suberkropp 1995). Meanwhile, Ca and Mg are known to be essential elements in
491
the diet of macroinvertebrates, since they are required for enzymatic reactions, nerve 492
connections, muscle function, and skeleton formation (National Research Council 2005). 493
Moreover, in some temperate streams, crustaceans could represent up to 95% of shredder 494
biomass (Piscart and others 2011), and the Ca content of leaves could be a significant source of 495
Ca for their cuticles (Cairns and Yan 2009), especially in streams with a low Ca content in the 496
water (Glazier 1998), such as in Brittany, where the present study was conducted. 497
498
CONCLUSION
499
As expected, increasing mean nutrient concentration and macroinvertebrate presence 500
favored both microbial activity and litter decomposition rate. In addition, we experimentally 501
demonstrated for the first time that the mass-ratio hypothesis (i.e. TraitCWM) overrules the niche
502
complementarity hypothesis (TraitFD) as a driver of litter diversity effects in a temperate stream.
503
In fact, in strong contrast to our expectations, the combination of two nutrient-rich litters yielded 504
the highest litter mixture effects. In addition, the synergistic effects of litter mixing were mainly 505
evident in the presence of macroinvertebrates. Both community weighted mean traits 506
(TraitCWM) and the functional dissimilarity of litter traits (TraitFD) contributed to explain the
507
litter mixture effects. There was no support for TraitFD explaining litter diversity effects in the
508
presence of macroinvertebrates, while both TraitCWM and TraitFD contributed to explain litter
509
mixture effects driven by microorganisms alone. Finally, Ca and Mg, which are often neglected 510
in decomposition studies in streams, were found to be important drivers of litter mixture effects. 511
512
ACKNOWLEDGMENTS
513
The chemical analyses were performed at the Plateforme d’Analyses Chimiques en 514
Ecologie (PACE, LabEx Centre Méditerranéen de l’Environnement et de la Biodiversité, 515
Montpellier, France), as well as at the PLateforme AnalYtique (PLAY, UMR CNRS 6553 516
ECOBIO, Rennes, France). We thank Raphaëlle Leclerc, Bruno Buatois and Nicolas Barthes 517
for technical assistance during the chemical analyses as well as Pierre Mariotte for his reviewing 518
of the English. This study was funded by the Selune project (project number 1 053 864) and by 519
the Rennes Metropole's project AIS 2015. The study was also supported by the LTSER France 520
Zone Atelier Armorique. Finally, the authors declare no conflict of interest. 521
AUTHORS’ CONTRIBUTIONS
523
M.S., H.R.P., N.L.B. and C.P. conceived and performed the experiments. M.S. analyzed 524
the data and led the writing of the manuscript. All authors contributed critically to the drafts 525
and gave final approval for publication. 526
527
REFERENCES
528
Allan DJ. 1996. Stream Ecology. Chapman and Hall, New York. 529
Anderson, JPE, Domsch KH. 1973. Quantification of bacterial and fungal contributions to soil 530
respiration. Archiv für Mikrobiologie 93:113-127. Doi: 10.1007/BF00424942 531
Anderson NH, Sedell JR. 1979. Detritus processing by macroinvertebrates in stream 532
ecosystems. Annual Review of Entomology 24:351-377. Doi: 533
10.1146/annurev.en.24.010179.002031 534
Botta Dukát Z. 2005. Rao’s quadratic entropy as a measure of functional diversity based on 535
multiple traits. Journal of Vegetation Science 16:533-540. Doi: 10.1658/1100-536
9233(2005)16[533:RQEAAM]2.0.CO;2 537
Boulton AJ, Boon PI. 1991. A review of methodology used to measure leaf litter decomposition 538
in lotic environments: time to turn over an old leaf? Australian Journal of Marine Freshwater 539
Resources 42:1-43. Doi: 10.1071/MF9910001 540
Bruder A, Schindler MH, Moretti MS, Gessner MO. 2014. Litter decomposition in a temperate 541
and a tropical stream: the effects of species mixing, litter quality and shredders. Freshwater 542
Biology 59:438-449. https://doi.org/10.1111/fwb.12276 543
Cadish G, Giller KE. 1997. Driven by Nature: Plant Litter Quality and Decomposition. CAB 544
international, Wallingford. 545
Cairns A, Yan N. 2009. A review of the influence of low ambient calcium concentrations on 546
freshwater daphniids, gammarids, and crayfish. Environmental Reviews 17:67-79. Doi: 547
10.1139/A09-005 548
Cardinale BJ, Matulich KL, Hooper DU, Byrnes JE, Duffy E, Gamfeldt L, … Gonzalez A. 549
2011. The functional role of producer diversity in ecosystems. American Journal of Botany 550
98:572-592. Doi: 10.3732/ajb.1000364 551
Cornwell WK, Cornelissen JH, Amatangelo K, Dorrepaal E, Eviner VT, Godoy O, … Westoby 552
M. 2008. Plant species traits are the predominant control on litter decomposition rates within 553
biomes worldwide. Ecology letters 11:1065-1071. Doi: 10.1111/j.1461-0248.2008.01219.x 554
Cummins KW, Klug MJ. 1979. Feeding ecology of stream invertebrates. Annual review of 555
ecology and systematics 10:147-172. Doi: 10.1146/annurev.es.10.110179.001051 556
Cummins KW, Wilzbach MA, Gates DM, Perry JB, Taliferro WB. 1989. Shredders and riparian 557
vegetation: Leaf litter that falls into streams influences communities of stream invertebrates. 558
BioSciences 39:24-30 Doi: 10.2307/1310804 559
Cummins KW. 2012. Structure and function of stream ecosystems. Bioscience 24:631-641. 560
https://doi.org/10.2307/1296676 561
Diaz S, Lavorel S, De Bello F, Quetier F, Grigulis K, Robson TM. 2007. Incorporating plant 562
functional diversity effects in ecosystem service assessments. Proceedings of the National 563
Academy of Sciences of the USA 104:20684-20689. Doi: 10.1073/pnas.0704716104 564
Epps KY, Comerford NB, Reeves III JB, Cropper Jr WP, Araujo QR. 2007. Chemical diversity-565
highlighting a species richness and ecosystem function disconnect. Oikos 116:1831-1840. 566
Doi: 10.1111/j.0030-1299.2007.15853.x 567
Ferreira V, Encalada AC, Graça MA. 2012. Effects of litter diversity on decomposition and 568
biological colonization of submerged litter in temperate and tropical streams. Freshwater 569
Science 31:945-962. Doi: 10.1899/11-062.1 570
Fierer N, Craine JM, McLauchlan K, Schimel JP. 2005. Litter quality and the temperature 571
sensitivity of decomposition. Ecology 86:320-326. Doi: 10.1890/04-1254 572
Follstad Shah JJ, Kominoski JS, Ardón M, Dodds WK, Gessner MO, Griffiths NA, ... Manning 573
DW. 2017. Global synthesis of the temperature sensitivity of leaf litter breakdown in streams 574
and rivers. Global Change Biology 23:3064-3075. Doi: 10.1111/gcb.13609 575
Foucreau N, Puijalon S, Hervant F, Piscart C. 2013. Effect of leaf litter characteristics on leaf 576
conditioning and on consumption by Gammarus pulex. Freshwater Biology 58:1672-1681. 577
Doi: 10.1111/fwb.12158 578
Frainer A, Moretti MS, Xu W, Gessner MO. 2015. No evidence for leaf-trait dissimilarity 579
effects on litter decomposition, fungal decomposers, and nutrient dynamics. Ecology 580
96:550-561. Doi: 10.1890/14-1151.1 581
Garcia‐Palacios P, McKie BG, Handa IT, Frainer A, Hättenschwiler S. 2016. The importance 582
of litter traits and decomposers for litter decomposition: a comparison of aquatic and 583
terrestrial ecosystems within and across biomes. Functional Ecology 30:819-829. Doi: 584
10.1111/1365-2435.12589 585
Garcia-Palacios P, Shaw EA, Wall DH, Hättenschwiler S. 2017. Contrasting mass-ratio vs. 586
niche complementarity effects on litter C and N loss during decomposition along a regional 587
climatic gradient. Journal of Ecology 105:968-978. Doi: 10.1111/j.1466-8238.2011.00651.x 588
Garnier E, Cortez J, Billès G, Navas ML, Roumet C, Debussche M, … Toussaint JP. 2004. 589
Plant functional markers capture ecosystem properties during secondary 590
succession. Ecology 85:2630-2637. Doi: 10.1890/03-0799 591
Gessner MO, Chauvet E. 1994. Importance of stream microfungi in controlling breakdown rates 592
of leaf litter. Ecology 75:1807-1817. Doi: 10.2307/1939639 593
Gessner MO, Chauvet E, Dobson M. 1999. A perspective on leaf litter breakdown in streams. 594
Oikos 85:377-384. Doi: 10.2307/3546505 595
Gessner MO, Swan CM, Dang CK, Mckie BG, Bardgett RD, Wall DH, Hättenschwiler S. 2010. 596
Diversity meets decomposition. Trends in Ecology and Evolution 25:372-380. Doi: 597
10.1016/j.tree.2010.01.010 598
Glazier DS. 1998. Springs as model systems for ecology and evolutionary biology: a case study 599
of Gammarus minus Say (Amphipoda) in mid-Appalachian springs differing in pH and ionic 600
content. In: Botosaneanu L (eds) Studies in crenobiology: the biology of springs and 601
springbrooks, Backhuys Publishers, Leiden, pp 41-54. 602
Graça MAS. 2001. The role of invertebrates on leaf litter decomposition in streams-a review. 603
International Review of Hydrobiology 86:383-393. Doi: 10.1002/1522-604
2632(200107)86:4/5<383::AID-IROH383>3.0.CO;2-D 605
Grime JP. 1998. Benefits of plant diversity to ecosystems: immediate, filter and founder effects. 606
Journal of Ecology 86:902-910. Doi: 10.1046/j.1365-2745.1998.00306.x 607
Grimshaw HM, Allen SE, Parkinson JA. 1989. Nutrient elements. In: Allen SE (eds) Chemical 608
analysis of ecological materials, 2nd Edition, Blackwell Scientific, Oxford, pp 81-159. 609
Handa IT, Aerts R, Berendse F, Berg MP, Bruder A, Butenschoen O, … Hättenschwiler S. 610
2014. Consequences of biodiversity loss for litter decomposition across 611
biomes. Nature 509:218-221. Doi: 10.1038/nature13247 612
Hättenschwiler S, Gasser P. 2005. Soil animals alter plant litter diversity effects on 613
decomposition. Proceedings of the National Academy of Sciences, 102:1519-1524. 614
https://doi.org/10.1073/pnas.0404977102 615
Hättenschwiler S, Tiunov AV, Scheu S. 2005. Biodiversity and litter decomposition in 616
terrestrial ecosystems. Annual Review of Ecology, Evolution and Systematics 36:191-218. 617
Doi: 10.1146/annurev.ecolsys.36.112904.151932 618
Jabiol J, McKie BG, Bruder A, Bernadet C, Gessner MO, Chauvet E. 2013. Trophic complexity 619
enhances ecosystem functioning in an aquatic detritus‐based model system. Journal of 620
Animal Ecology 82:1042-1051. Doi: 10.1111/1365-2656.12079 621
Jabiol J, Cornut J, Danger M, Jouffroy M, Elger A, Chauvet E. 2014. Litter identity mediates 622
predator impacts on the functioning of an aquatic detritus-based food web. Oecologia, 623
176:225-235. Doi: 10.1007/s00442-014-2990-y 624
Jabiol J, Chauvet E. 2015. Biodiversity and litter decomposition: a case study in a 625
Mediterranean stream. Freshwater Science 34:423-430. Doi: 10.1086/680094 626
Jenkins CC, Suberkropp K. 1995. The influence of water chemistry on the enzymatic 627
degradation of leaves in streams. Freshwater Biology 33:245-253. Doi: 10.1111/j.1365-628
2427.1995.tb01165.x 629
Joyce P, Wotton RS. 2008. Shredder fecal pellets as stores of allochthonous organic matter in 630
streams. Journal of the North American Benthological Society 27:521-528. Doi: 10.1899/07-631
102.1 632
Kaspari M, Wright J, Yavitt J, Harms K, Garcia M, Santana M. 2008. Multiple nutrients limit 633
litterfall and decomposition in a tropical forest. Ecology Letters 11:35-43. Doi: 634
10.1111/j.1461-0248.2007.01124.x 635
Kominoski JS, Pringle CM, Ball BA, Bradford MA, Coleman DC, Hall DB, Hunter MD. 2007. 636
Nonadditive effects of leaf litter species diversity on breakdown dynamics in a detritus-based 637
stream. Ecology 88:1167-1176. Doi: 10.1890/06-0674 638
Krauss GJ, Solé M, Krauss G, Schlosser D, Wesenberg D, Bärlocher F. 2011. Fungi in 639
freshwaters: ecology, physiology and biochemical potential. FEMS microbiology reviews 640
35:620-651. Doi: 10.1111/j.1574-6976.2011.00266.x 641
Laughlin DC. 2011. Nitrification is linked to dominant leaf traits rather than functional 642
diversity. Journal of Ecology 99:1091-1099. Doi: 10.1111/j.1365-2745.2011.01856.x 643
Lecerf A, Dobson M, Dang CK, Chauvet E. 2005. Riparian plant species loss alters trophic 644
dynamics in detritus-based stream ecosystems. Oecologia 146:432-442. Doi: 645
10.1007/s00442-005-0212-3 646
Lecerf A, Risnoveanu G, Popescu C, Gessner MO, Chauvet E. 2007. Decomposition of diverse 647
litter mixtures in streams. Ecology 88:219-227. https://doi.org/10.1890/0012-648
9658(2007)88[219:DODLMI]2.0.CO;2 649
Lecerf A, Marie G, Kominoski JS, LeRoy CJ, Bernadet C, Swan CM. 2011. Incubation time, 650
functional litter diversity, and habitat characteristics predict litter-mixing effects on 651
decomposition. Ecology 92:160-169. Doi: 10.1890/10-0315.1 652
Leroy CJ, Marks JC. 2006. Litter quality, stream characteristics and litter diversity influence 653
decomposition rates and macroinvertebrates. Freshwater biology 51:605-617. Doi: 654
10.1111/j.1365-2427.2006.01512.x 655
Lummer D, Scheu S, Butenschoen O. 2012. Connecting litter quality, microbial community 656
and nitrogen transfer mechanisms in decomposing litter mixtures. Oikos 121:1649-1655. 657
Doi: 10.1111/j.1600-0706.2011.20073.x 658
Makkonen M, Berg MP, Handa IT, Hättenschwiler S, van Ruijven J, van Bodegom PM, … 659
Aerts R. 2012. Highly consistent effects of plant litter identity and functional traits on 660
decomposition across a latitudinal gradient. Ecology Letters 15:1033-1041. Doi: 661
10.1111/j.1461-0248.2012.01826.x 662
Mokany K, Ash J, Roxburgh S. 2008. Functional identity is more important than diversity in 663
influencing ecosystem processes in a temperate native grassland. Journal of Ecology 96:884-664
893. Doi: 10.1111/j.1365-2745.2008.01395.x 665
National Research Council. 2005. Mineral Tolerance of Animals, 2nd ed. National Academic 666
Press, Washington. 667
Petchey OL, Gaston KJ. 2006. Functional diversity: back to basics and looking forward. 668
Ecology letters 9:741-758.doi: 10.1111/j.1461-0248.2006.00924.x 669
Piscart C, Genoel R, Dolédec S, Chauvet E, Marmonier P. 2009. Effects of intense agricultural 670
practices on heterotrophic processes in streams. Environmental Pollution 157:1011-1018. 671
Doi: 10.1016/j.envpol.2008.10.010 672
Piscart C, Navel S, Maazouzi C, Montuelle B, Cornut J, Mermillod-Blondin F, Creuse des 673
Chatelliers M, Simon L, Marmonier P. 2011. Leaf litter recycling in benthic and hyporheic 674
layers in agricultural streams with different types of land use. Science of the Total 675
Environment 409:4373-4380. Doi: 10.1016/j.scitotenv.2011.06.060 676
Presa Abos C, Lepori F, McKie BG, Malmqvist B. 2006. Aggregation among resource patches 677
can promote coexistence in stream‐living shredders. Freshwater Biology 51:545-553. 678
https://doi.org/10.1111/j.1365-2427.2006.01509.x 679
Quested H, Eriksson O, Fortunel C, Garnier E. 2007 Plant traits relate to whole-community 680
litter quality and decomposition following land use change. Functional Ecology 21:1016-681
1026. Doi: 10.1111/j.1365-2435.2007.01324.x 682
R Core Team. 2013. R: A Language and Environment for Statistical Computing. R Foundation 683
for Statistical Computing, Vienna, Austria. 684
Ritz K. 2006. Fungal roles in transport processes in soils. In MG Gadd eds, Fungi in 685
biogeochemical cycles. Cambridge University Press, Cambridge, UK, pp. 51-73. 686
Sanpera-Calbet I, Lecerf A, Chauvet E. 2009. Leaf diversity influences in‐stream litter 687
decomposition through effects on shredders. Freshwater Biology 54:1671-1682. Doi: 688
10.1111/j.1365-2427.2009.02216.x 689
Santonja M, Baldy V, Fernandez C, Balesdent J, Gauquelin T. 2015a. Potential shift in plant 690
communities with climate change in a Mediterranean Oak forest: consequence on nutrients 691
and secondary metabolites release during litter decomposition. Ecosystems 18:1253-1268. 692
Doi: 10.1007/s10021-015-9896-3 693
Santonja M, Fernandez C, Gauquelin T, Baldy V. 2015b. Climate change effects on litter 694
decomposition: intensive drought leads to a strong decrease of litter mixture interactions. 695
Plant and Soil 393:69-82. Doi: 10.1007/s11104-015-2471-z 696
Santonja M, Pellan L, Piscart C. 2018a. Macroinvertebrate identity mediates the effects of litter 697
quality and microbial conditioning on the leaf litter recycling in temperate streams. Ecology 698
and Evolution 8:2542-2553. Doi: 10.1002/ece3.3790 699
Santonja M, Foucault Q, Rancon A, Gauquelin T, Fernandez C, Baldy V, Mirleau P. 2018b. 700
Contrasting responses of bacterial and fungal communities to plant litter diversity in a 701
Mediterranean oak forest. Soil Biology and Biochemistry 125:27-36. Doi: 702
10.1016/j.soilbio.2018.06.020 703
Santschi F, Gounand I, Harvey E, Altermatt F. 2018. Leaf litter diversity and structure of 704
microbial decomposer communities modulate litter decomposition in aquatic systems. 705
Functional Ecology 32:522-532. Doi: 10.1111/1365-2435.12980 706
Schimel JP, Hättenschwiler S. 2007. Nitrogen transfer between decomposing leaves of different 707
N status. Soil Biology and Biochemistry 39:1428-1436. Doi: 10.1016/j.soilbio.2006.12.037 708
Schindler MH, Gessner MO. 2009. Functional leaf traits and biodiversity effects on litter 709
decomposition in a stream. Ecology 90:1641-1649. Doi: 10.1890/08-1597.1 710
Srivastava DS, Cardinale BJ, Downing AL, Duffy JE, Jouseau C, Sankaran M, Wright JP. 2009. 711
Diversity has stronger top‐down than bottom‐up effects on decomposition. Ecology 712
90:1073-1083. Doi: 10.1890/08-0439.1 713
Swan CM, Palmer MA. 2004. Leaf diversity alters litter breakdown in a piedmont stream. 714
Journal of the North America Benthological Society 23:15-28. 715
Swan CM, Palmer MA. 2006a. Composition of speciose leaf litter alters stream detritivore 716
growth, feeding activity and leaf breakdown. Oecologia 147:469-478. Doi: 10.1007/s00442-717
005-0297-8 718
Swan CM, Palmer MA. 2006b. Preferential feeding by an aquatic consumer mediates non-719
additive decomposition of speciose leaf litter. Oecologia 149:107-114. Doi: 720
10.1007/s00442-006-0436-x 721
Swan C M. 2011. Consumer presence and resource diversity independently induce stability of 722
ecosystem function in a Piedmont stream. Ecosphere 2:136. Doi: 10.1890/ES11-00274.1 723
Swift MJ, Heal OW, Anderson JM. 1979. Decomposition in terrestrial ecosystems. Berkeley, 724
University of California press. 725
Vannote RL, Minshall GW, Cummins KW, Sedell JR, Cushing CE. 1980. The river continuum 726
concept. Canadian Journal of Fisheries and Aquatic Sciences 37:130-137. Doi: 10.1139/f80-727
017 728
Villanueva VD, Albarino R, Canhoto C. 2012. Positive effect of shredders on microbial 729
biomass and decomposition in stream microcosms. Freshwater Biology 57:2504-2513. Doi: 730
10.1111/fwb.12023 731
Vos VC, van Ruijven J, Berg MP, Peeters ET, Berendse F. 2013. Leaf litter quality drives litter 732
mixing effects through complementary resource use among detritivores. Oecologia 173:269-733
280. Doi: 10.1007/s00442-012-2588-1 734
Wallace JB, Eggert SL, Meyer JL, Webster JR. 1997. Multiple trophic levels of a forest stream 735
linked to terrestrial litter inputs. Science 277:102-104. Doi: 10.1126/science.277.5322.102 736
Wardle DA, Bonner KI, Nicholson KS. 1997. Biodiversity and plant litter: Experimental 737
evidence which does not support the view that enhanced species richness improves 738
ecosystem function. Oikos 79:247-258. Doi: 10.2307/3546010 739
Wetzel RG. 1995. Death, detritus, and energy flow in aquatic ecosystems. Freshwater Biology 740
33:83-89. Doi: 10.1111/j.1365-2427.1995.tb00388.x 741
TABLES
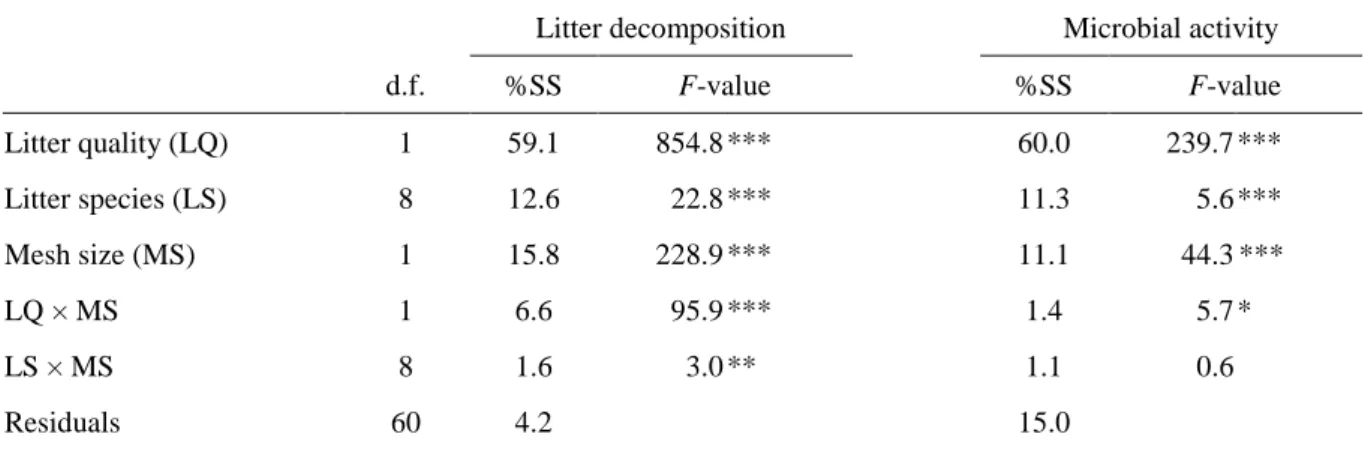
743 744
Table 1. Effects of litter quality (NPL vs. NRL), litter species identity (10 species), litterbag
745
mesh size (fine-mesh vs. coarse-mesh litterbags), and their interactions on litter decomposition 746
rate and microbial activity in the single-species litterbags. d.f. = degrees of freedom, %SS = 747
percentage of type III sums of squares. F-values and associated P-values (with the respective 748
symbols * for P < 0.05, ** for P < 0.01, and *** for P < 0.001) are indicated. 749
750
Litter decomposition Microbial activity
d.f. %SS F-value %SS F-value Litter quality (LQ) 1 59.1 854.8*** 60.0 239.7*** Litter species (LS) 8 12.6 22.8*** 11.3 5.6*** Mesh size (MS) 1 15.8 228.9*** 11.1 44.3*** LQ × MS 1 6.6 95.9*** 1.4 5.7* LS × MS 8 1.6 3.0** 1.1 0.6
Residuals 60 4.2 15.0 751 752
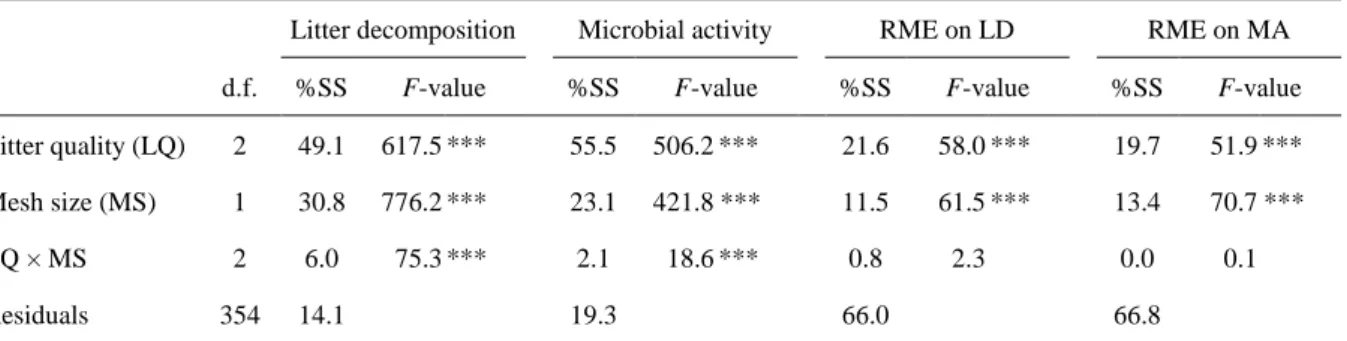
Table 2. Effects of litter quality mixing (NPL-NPL, NPL-NRL and NRL-NRL), litterbag mesh
753
size (fine-mesh vs. coarse-mesh litterbags), and their interactions i) on litter decomposition rate 754
and microbial activity and ii) on relative mixture effects (RME) on litter decomposition rate 755
(LD) and on microbial activity (MA). d.f. = degrees of freedom, %SS = percentage of type III 756
sums of squares. F-values and associated P-values (with the respective symbols * for P < 0.05, 757
** for P < 0.01, and *** for P < 0.001) are indicated. 758
759
Litter decomposition Microbial activity RME on LD RME on MA
d.f. %SS F-value %SS F-value %SS F-value %SS F-value
Litter quality (LQ) 2 49.1 617.5 *** 55.5 506.2 *** 21.6 58.0 *** 19.7 51.9 *** Mesh size (MS) 1 30.8 776.2 *** 23.1 421.8 *** 11.5 61.5 *** 13.4 70.7 *** LQ × MS 2 6.0 75.3 *** 2.1 18.6 *** 0.8 2.3 0.0 0.1 Residuals 354 14.1 19.3 66.0 66.8 760 761