HAL Id: hal-02285509
https://hal.archives-ouvertes.fr/hal-02285509
Submitted on 12 Sep 2019
HAL is a multi-disciplinary open access
archive for the deposit and dissemination of
sci-entific research documents, whether they are
pub-lished or not. The documents may come from
teaching and research institutions in France or
abroad, or from public or private research centers.
L’archive ouverte pluridisciplinaire HAL, est
destinée au dépôt et à la diffusion de documents
scientifiques de niveau recherche, publiés ou non,
émanant des établissements d’enseignement et de
recherche français ou étrangers, des laboratoires
publics ou privés.
Machine learning approach and waves synchronization
improvement for the localization of Atrial Flutter circuit
based on the 12-leads ECG
Olivier Meste, Haziq Azman, Gabriel Latcu
To cite this version:
Olivier Meste, Haziq Azman, Gabriel Latcu. Machine learning approach and waves synchronization
improvement for the localization of Atrial Flutter circuit based on the 12-leads ECG. Computing in
Cardiology, Sep 2019, singapore, Singapore. �hal-02285509�
Machine learning approach and waves synchronization improvement for the
localization of Atrial Flutter circuit based on the 12-leads ECG
O. Meste
1, H. K. Azman
1,2, D. G. Latcu
31
Université Côte d’Azur, CNRS, I3S, France
2Universiti of Kuala Lumpur, Malaysia
3
Cardiology Department, Centre Hospitalier Princesse Grace, Monaco
Abstract
The localization of the Atrial flutter (AFL) is of great in-terest for ablation planification. Regardless the direction of rotation of the corresponding reentry loop, its left or right atrium origin needs to be known beforehand. This lo-calization is usually performed by using visual inspection of the 12-leads standard ECG that could be computerized. The aim of the study is to automatically classify the cor-responding averaged F-waves by using one to five simple features. The averaged F-wave is computed by introducing a new multi-lead extension of a SVD based method for the wave resynchronization.
A dataset of ECG recorded from 56 subjects and com-prising 25 left AFL and 31 right AFL will train the clas-sifier. It is shown that the single lead SVD based wave synchronization is efficiently extended to 12 leads by com-puting the SVD of each group of waves for each lead and optimally combining the corresponding first singular val-ues. From the subsequent averaged 12 leads F-wave, 3 groups (Gi) of features were extracted: G1-(min, max), G2-(integral of the negative, of the positive part), G3-(integral of the wave, integral of the absolute value of the wave). For each group 24 features are then computed to feed the learning algorithm. A wrapper approach using an exhaustive search for feature selection is applied to maxi-mize the mean classification accuracy computed over one to five features for each group (Gi) applied to the 12 leads. The logistic regression (LR) model is used for the super-vised classifications.
The mean accuracy ranges for the three groups, without validations, are G1:[0.69-0.83], G2:[0.68-0.81], G3:[0.68-0.80] for one feature up to five. The maximum accuracy comes from G1 with five features and is equal to 93%. The corresponding selected features are [max(I), max(III), max(V3), min(aVL), min(V5)]. In order to check for the risk of model overfitting, a leave one out cross-validation (LOOCV) is performed with these five features and gives 86% for the accuracy. When using all the 24
fea-tures simultaneously, the corresponding accuracy without validation is 93% and 67% for the LOOCV.
1.
Introduction
The localization of the source of Atrial Flutter (AFL) is of great importance for the guidance of the ablation pro-cedure. Prior knowledge as to which atrium the circuit or focus is located will thus aid in the planning phase, ef-fectively reducing operation time. It is well known that features visually extracted from the continuous ECG leads help practitioner for this task because they are shown to be linked to circuit localization [1], [2]. Although V1 is the most useful lead for distinguishing left from right atrial ori-gin [2], it doesn’t reach the best performances that could be obtained by using extended combinations of leads.
It has been shown in [3] that the spatial variability of the F-waves could unveils from which chamber the AFL orig-inates. The spatial variability is far from being addressed by a simple 12-leads ECG visual inspection used by prac-titioners. One goal of this paper is to refer to the regular practice to distinguish left from right atrial origin of the AFL. This practice mostly makes use of extremum values and polarities of the F-waves, considering simple combina-tions of multiple leads. In order to reject any source of dis-turbances that could impede a correct classification, a syn-chronous averaging is applied to the segmented F-waves automatically detected by using previous work [4]. The synchronous averaging is a very well known and efficient processing to remove noise but needs aligned waveforms.
This alignment, also addressed as a time delay estima-tion problem, has been considered in [5] as a problem of eigenvalues maximization in a context of one-dimensional multiple observations. In the context of 12-leads ECG sys-tem, the multiple delayed F-waves should be considered as a 12-dimensional alignment. Then, results from [5] is easily extended in this work to the N-dimensional space in order to improve the accuracy of the delays estimation. The subsequent synchronous averaging provides reduced
noise F-waves where features captured from visual inspec-tion are in that case computerized. For each averaged F-wave and for each lead these computed features are : min, max, integral of the negative/positive parts, global integral, global integral of the absolute value.
Finally, according to the labeled right (R) or left (L) AFL cases evaluated during an ablation procedure, a ma-chine learning algorithm is applied for a supervised clas-sification with cross-validation performance assessment. Then, it is shown that with a limited number of features the prediction of the AFL localization can be performed.
2.
Methods
2.1.
F-waves alignment
For the one-dimensional case :
xi(n) = s(n−θi)+vi(n), n = 0, . . . , N −1; i = 1, . . . , M
(1) where s(n) is an unknown, deterministic signal, with en-ergy Esand energy of its first derivative Es0, θiis random,
zero mean, integer valued time delay with variance σ2
θ, and
vi(n) is a zero-mean, white noise with variance σv2,
uncor-related with θi. It is shown in [5] that the estimation of the
θi’s can be carried out by maximizing an eigenvalue-based
criteria. The eigenvalues λi are then computed from the
intra-signal correlation matrix. From this work, an easily interpretable similar criteria is used and defined by :
∆(θ) = λ1(θ) PM i=1λi(θ) = Es− σ 2 θEs0+ σ2v Es+ N σ2v = F (θ)+B(θ) (2)
Then ∆(θ) is maximized when σθ2 is minimized. This
minimization is indirectly performed by an iterative search
of the best individual θi that maximizes (2). This
expres-sion can also be interpreted as the sum of a true function F (θ) added to zero-mean uncertainty B(θ) coming from approximations and other departures from model (1). This uncertainty impede the correct estimation of θ.
It can be assumed that in 12-leads ECG, each individual
delay θi is equal across the different leads, even though
s(n) could be different. Then, these multiple observations
of each θi should lead to a more accurate estimation. In
order to benefit from for this property, it is proposed the following criteria : ∇(θ) = 1 12 12 X j=1 ∆j(θ) = 1 12 12 X j=1 Fj(θ) + 1 12 12 X j=1 Bj(θ) (3)
Where ∆j(θ) stands for criteria (2) applied to the jthlead.
Since each ∆j(θ) are bounded by (0,1), so will be the
∇(θ) values. The rational of this proposition is that since
all the Fj are maximum for the true θ and the averaging
of the uncorrelated Bj(θ) should tends toward zero as the
number of leads increases, the estimation of (θ) will be more accurate.
It is easy to check that the more one lead is noisy, the less it will contribute to the optimization. Furthermore,
because Es0stands for the energy of the signal first
deriva-tive, the lead with the sharpest waveform will contribute more to the estimation. Finally, the shape changes that could be observed on given lead, caused by baseline con-tribution for instance, may also explain a lower contribu-tion of the corresponding lead because of the spread of the
eigenvalues spectrum and then a lower λ1value.
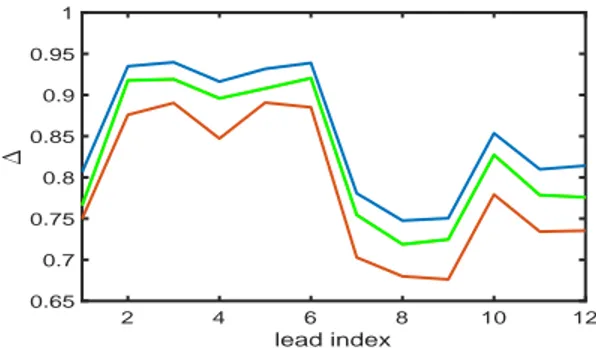
The performances of this approach can be depicted in Fig. 1 where the ∆ values computed as in (2) are plotted. The corresponding aligned F-waves are displayed in Fig. 2 through their respective synchronous averages. From Fig. 1 it is clear that the estimation of the delays by maximizing ∇ in (3) increases each individual ∆. However, these ∆ values are lower than the ones computed considering the leads as independent, providing different delays across the different leads. This latter result could appear better but is inconsistent with the underlying physical model.
2 4 6 8 10 12 lead index 0.65 0.7 0.75 0.8 0.85 0.9 0.95 1
Figure 1. ∆ values computed as in (2) over each lead, before (red), after (green) the proposed alignment and for the 12-leads plotted in Fig. 2. The blue trace corresponds to the ∆ values optimized considering the leads independently. 0 50 100 150 200 250 300 -0.8 -0.7 -0.6 -0.5 -0.4 -0.3 -0.2 -0.1 0 0.1 0.2
Figure 2. 12-leads averaged F-waves of a patient with left AFL. Traces from top to bottom correspond to I, II, III, aVR, aVL, aVF, V1, V2, V3, V4, V5, V6
2.2.
Supervised classification and features
selection
Many features could be extracted from the averaged F-waves, taking into account all the ECG leads even though they are correlated. The visual inspection performed by practitioners shows the efficiency of the knowledge in-volved in their AFL classification. The visual inspection combines several salient characteristics such as the nega-tive or posinega-tive peak values and also the isoelectric level for macro-reentry assessment. It is however difficult to visu-ally combine these information, more or less exploited in-dependently when the number of considered leads is large. The logistic regression classifier is a good candidate be-cause it linearly combines a set of features, assuming that the labeling (right or left AFL) is a priori known. Non lin-ear classifier are rejected in order to limit the overfitting due to the reduced number of observations.
Once the alignment process is achieved the averaged synchronous 12 leads F-waves are computed (see Fig. 2 and Fig. 3 for respective left and right AFL examples). For each lead and subject 3 groups (Gi) of features were extracted: G1-(min, max), G2-(integral of the negative, of the positive part), G3-(integral of the wave, integral of the absolute value of the wave). For each group Gi, 24 features are then computed to feed the learning algorithm. Combi-nations of features from different groups is not discussed in this study. A wrapper approach using an exhaustive search for feature selection is applied to maximize the mean clas-sification accuracy computed over one to five features for each group (Gi) applied to the 12 leads. The maximum number of features is also considered in the study. In or-der to assess the generalization ability of the best features combination a leave-one-out cross-validation (LOOCV) is also performed for comparison.
0 50 100 150 200 250 300 350 -1 -0.8 -0.6 -0.4 -0.2 0 0.2
Figure 3. 12-leads averaged ECG of a patient with right AFL. Traces from top to bottom correspond to I, II, III, aVR, aVL, aVF, V1, V2, V3, V4, V5, V6
3.
Material
A dataset of ECGs recorded from 56 subjects and com-prising 25 left AFL and 31 right AFL will train the clas-sifier. ECGs are acquired during catheter ablation opera-tions at Centre Hospitalier Princesse Grace, Monaco. All
signals were recorded at fs = 2000Hz. A finite-impulse
response notch filter at 50Hz was applied to these signals to remove powerline interference, and were then filtered at [0.5; 70]Hz using type II Chebyshev high- and low-pass filters to remove baseline wander and high-frequency noises. Records with missing leads, low F-wave ampli-tudes, low atrioventricular block ratio (< 2 : 1) were ex-cluded from the study. F-waves from each recording were detected and segmented, using a technique described in [4]. Only F-waves not overlapped within T waves were considered. The averaged number of segmented F-waves per subject is 64 with an average length of 360 samples. These segmented 12-leads F-waves are finally accurately aligned using the proposed method. It should be noticed that since the technique in [4] performs very well and the profiles of the F-waves are smooth, the impact of the align-ment method proposed in this paper over the features is very weak.
4.
Results
It is given in Fig. 4 the performances in term of ac-curacy of the classifier and for a variable number of tures. It can be noticed that regardless the number of fea-tures the group G1 (min,max) exhibits the best classifica-tion and that the larger the number of features is the higher is the performance. However, the highest increase of per-formance is from one feature to two features. The best G1 combinations and the respective classification accuracies (%) without or with LOOCV, for an increasing number of features is: [min(III)] (84, 80), [max(I), min(V5)] (89,85), [max(I), min(V3), min(V5)] (91,85), [max(I), max(aVL), min(V4), min(V5)] (93,82), [max(I), max(III), max(V3), min(aVL), min(V5)] (93,86) Also, for the full set of 24 fea-tures, the accuracy without validation is 93% and 67% for the LOOCV. It can be observed that max(I) and min(V5) play a key role in the classification since they appear in al-most all the best combinations. In addition, the result of the supervised classification is depicted in Fig. 5 where the result of the linear combination performed by the lo-gistic regression is given. It can be observed that the two populations are well separated by the optimal threshold.
5.
Discussion and conclusion
A new multi-leads method that extends a single lead alignement technique has been proposed with a high po-tential for applications in the field of ECG analysis. It has
1 2 3 4 5 Number of features 0.65 0.7 0.75 0.8 0.85 0.9 0.95
Mean and Max accuracy
G1 G2 G3
Figure 4. Mean and Max (*) accuracy for the Gi’s
5 10 15 20 25 30 35 40 45 50 55 subject index 0 0.5 1 1.5
Logistic Regression output
Figure 5. Output of the logistic regression for the best five features combination. The 56 subjects are depicted in red (right AFL) and blue (left AFL) colored circles. The black line stands for the optimal threshold separating the two classes.
been applied to F-waves recorded from right and left AFL subjects. It has been shown that based on a simple fea-tures extraction the classification of right and left AFL can be performed with high accuracy. The increase of the fea-tures number above two does not provide a real improve-ment with a risk of lack of generalization due to overfit-ting. These results need to be confronted to the expertise of practitioners even though the selected features are simi-lar to those involved in visual inspection.
References
[1] Barbato G, Carinci V, Tomasi C, Frassineti V, Margheri M, Pasquale GD. Is electrocardiography a reliable tool for iden- ti-fying patients with isthmus-dependent atrial flutter ? Europace 2009;1071–1076.
[2] Medi C, Kalman JM. Prediction of the atrial flutter circuit location from the surface electrocardiogram. Europace 2008 Jul;10(7):786-96.
[3] Kamarul Azman MH, Meste O, Kadir K, Latcu DG. Localizing Atrial Flutter Circuit using Variability in the Vectorcardiographic Loop Parameters. In Computing in Cardiology, vol. 45. Sept. 2018. [4] Kamarul Azman MH, Meste O, Kadir K. Detecting flutter waves in the electrocardiogram using generalized likelihood ratio test. In Computing in Cardiology, vol. 45. Sept. 2018.
[5] Laguna P, Garde A, Giraldo B, Meste O, Jané R, et al.. Eigenvalue-based time delay estimation of repetitive biomedical signals. Digi-tal Signal Processing, Elsevier, 2018; (75) 107-119
Address for correspondence: Pr. Olivier MESTE
Laboratoire I3S - CNRS - UNS 2000 route des Lucioles
06903 Sophia Antipolis cedex, FRANCE E-mail address: olivier.meste@univ-cotedazur.fr


![[PDF] Tutorial sur la poo appliquée au Langage C++ | Cours informatique](data:image/gif;base64,R0lGODlhAQABAIAAAP///wAAACH5BAEAAAAALAAAAAABAAEAAAICRAEAOw==)