© Mohammad Valiei, 2020
Improving Tribological and Mechanical Properties of
Copper-Based Friction Materials for Brake Pad
Applications
Mémoire
Mohammad Valiei
Maîtrise en génie des matériaux et de la métallurgie - avec mémoire
Maître ès sciences (M. Sc.)
Improving tribological and mechanical properties
of copper-based friction materials for brake pad
applications
Mémoire
Mohammad Valiei
Sous la direction de :
III
Résumé
Les matériaux de friction les plus populaires pour les applications de plaquettes de frein d’éolienne sont les composites à matrice métallique à base de cuivre fabriqués par la méthode de métallurgie des poudres. D'une part, le cuivre a une bonne conductivité thermique et disperse adéquatement la chaleur générée lors du freinage. D'autre part, la métallurgie des poudres permet une addition facile de diverses poudres avec une distribution uniforme, tout en limitant la ségrégation et les réactions indésirables. Ces matériaux incorporent des renforts (additifs) dans diverses fractions volumiques pour contrôler le coefficient de frottement, la résistance à l'usure ainsi que les propriétés mécaniques. La simple sélection de renforts selon diverses proportions n’est pas suffisante pour obtenir les propriétés mécaniques et tribologiques souhaitées. les propriétés suivants des additifs ont des effets significatifs sur les caractéristiques mécaniques et tribologiques de ces matériaux: leur 1) dureté, 2) résistance, 3) réactivité de surface, 4) taille, 5) forme, 6) ténacité et la conductivité thermique ainsi que 7) leurs liaisons à la matrice et les propriétés de leur interface avec la matrice. Ce projet porte une attention particulière à la modification des liaisons entre les additifs et la matrice et au choix des additifs de bons taille, forme et type. Ce travail de recherche met en évidence le développement d'une large gamme de nouveaux matériaux de friction pour les plaquettes de frein qui peuvent être adaptés à différentes applications en fonction des propriétés tribologiques et mécaniques requises. La comparaison avec le matériau commercial existant est présentée en termes de coefficient de frottement (COF), de taux d'usure et de propriétés mécaniques. Les nouvelles formulations permettent de réduire le taux d'usure moyen d’environ 6 fois et d'augmenter le COF de 55% allant de 0,28 à 0,43. La charge de cisaillement maximale et la dureté Brinell peuvent augmenter respectivement jusqu’à 3,5 fois et 47%.
IV
Abstract
The most popular friction materials for brake pad applications are copper-based metal matrix composites fabricated with the powder metallurgy process. On the one hand, copper has good thermal conductivity and disperses heat generated during braking. On the other hand, powder metallurgy (PM) allows easy addition of various powder additives with even distribution and limits segregation and undesirable reactions. These materials incorporate reinforcements (additives) in various volume fractions in order to control the coefficient of friction, wear resistance, and mechanical properties. To achieve the desired mechanical and tribological properties, selection of additives with their respective proportion is not sufficient. Hardness, strength, surface reactivity, size, shape, toughness, and thermal conductivity of the additives, as well as their adhesion strength to the matrix and the properties of their interface with the matrix have significant effects on the mechanical and tribological characteristics of the friction materials. Particular focus is made on modifying the bonds between the additives and the matrix and choosing the additives with the right size, shape, and chemistry. This research highlights the development of a wide range of novel PM brake pad lining materials, which can be tailored to different applications depending on the required tribological and mechanical properties. A comparison with existing commercial material is presented in terms of the coefficient of friction, wear rate, and mechanical properties. The new formulations allow reduction of the average wear rate by 6 times and increase the COF by 55 % ranging from 0.28 to 0.43. In addition, the maximum shear load and Brinell apparent hardness can increase by 3.5 times and 47 %, respectively.
V
Table of Contents
Résumé ... III Abstract ... IV List of figures ... VIII List of tables ... XI Dedications ... XII Acknowledgment ... XIII
Introduction ... 1
Chapter 1: Literature review ... 3
1.1 Tribology ... 3 1.2 Surface roughness ... 3 1.3 Friction ... 4 1.4 Wear ... 6 1.4.1 Wear mechanisms ... 6 1.4.1.1 Adhesive wear ... 6 1.4.1.2 Abrasive wear ... 6 1.4.1.3 Delamination wear ... 7 1.4.1.4 Fatigue wear ... 7 1.4.1.5 Oxidative wear ... 7
1.5 Factors affecting wear and friction properties ... 8
1.5.1 Surface roughness ... 8 1.5.2 Temperature ... 9 1.5.3 Environment ... 9 1.5.4 Hardness ... 9 1.5.5 Elastic modulus ... 9 1.5.6 Fracture toughness ... 9
1.5.7 Crystal structure and grain size ... 10
1.5.8 Thermal diffusivity ... 10
1.5.9 Subsurface zone... 11
1.6 Metal Matrix Composites (MMCs) ... 11
1.6.1 Factors affecting the tribological properties of MMCs ... 12
1.6.1.1 Sintering temperature ... 13 1.6.1.2 Porosity ... 13 1.6.1.3 Particle size ... 14 1.6.1.4 Particle shape ... 15 1.6.1.5 Normal load ... 15 1.6.1.6 Surface temperature... 16 1.6.1.7 Sliding speed ... 16
VI
1.6.2 Matrix and reinforcement types ... 17
1.6.2.1 Soft reinforcements (lubricants) for metal matrix composites ... 18
1.6.2.2 Hard reinforcements and other additives for metal matrix composites ... 20
1.6.3 Reinforcements-matrix interaction ... 24
1.6.3.1 Coated ceramic reinforcements in metal matrix composites ... 25
1.6.3.2 Coated graphite reinforcement in metal matrix composites ... 26
1.7 Electroless plating ... 26
1.7.1 Electroless plating of nickel (EN) ... 27
1.7.2 Substrate preparation for electroless plating ... 28
1.7.3 Microstructure and phases of Ni-P coating ... 28
1.7.4 Factors affecting electroless plating of nickel ... 29
Chapter 2: Methodology ... 32
2.1 Materials preparation for nickel coating of FeCr particles ... 32
2.2 Fabricating samples with the powder metallurgy method ... 33
2.2.1 Preparing powder premixes ... 33
2.2.2 Compaction ... 34
2.2.3 Sintering ... 35
2.3 Characterization methods and measurements ... 36
2.3.1 Measuring the density of the powders ... 36
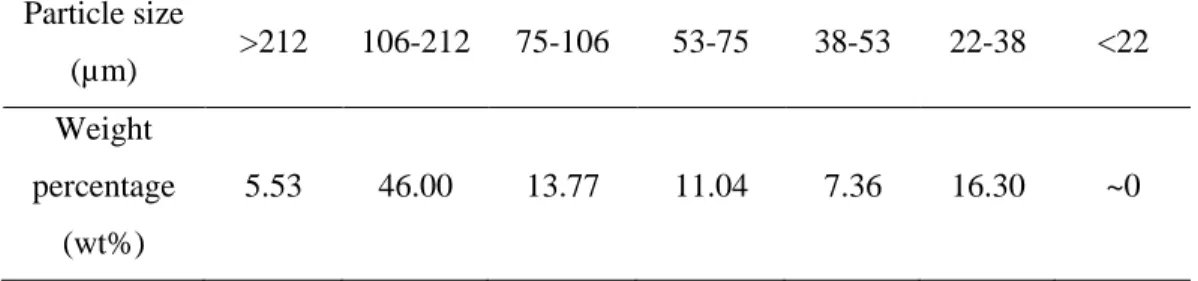
2.3.2 Determining the size distribution of FeCr particles ... 36
2.3.3 Characterizing friction and wear properties ... 37
2.3.4 Measuring the maximum shear load ... 38
2.3.5 Hardness measurements ... 39
2.3.6 SEM, EDS, and OM characterizations ... 39
Chapter 3: Results and discussion ... 41
3.1 Selection of the coating material ... 41
3.2 Coating method ... 42
3.3 Characterization of the coated particles ... 44
3.4 Sintered samples ... 48
3.4.1 Characterization of the nickel coating of sintered samples ... 49
3.4.2 SEM characterization of the sintered samples ... 52
3.4.3 Microstructure characterization of the samples ... 53
3.4.4 Characterization of the tribological properties of experimental samples ... 56
3.4.5 Surface roughness of sintered samples ... 62
3.4.6 Characterization of the wear surface of the samples and pins ... 64
3.4.7 Resistance to the shear force of the samples ... 74
3.4.8 Hardness of the samples ... 75
3.4.9 Relationship between tribological and mechanical properties ... 79
VII
VIII
List of figures
Figure 1-1- The brake pad system consisting of a) brake pad and b) disk brake [4]. ... 1
Figure 1-2- An example of a) surface roughness profile, b) Ra measurement [5]. ... 4
Figure 1-3- SEM images of the wear surfaces for a) adhesive wear [12], b) abrasive wear of bronze-based MMC reinforced with 1 % Al2O3 [13], c) delamination wear of Cu based composite [14], and d) oxidation wear of Al-l6 % Si alloy [15]. ... 8
Figure 1-4- A schematic diagram of subsurface zones observed beneath wear surface [34]. ... 11
Figure 1-5- Schematic illustration of hard second-phase particles protecting the ductile matrix from abrasion [40]. ... 13
Figure 1-6- The effect of reinforcements particle size on the friction coefficient of the Al based composites [52-59]. ... 14
Figure 1-7- The variation of wear rate of the copper MMCs with graphite content under different normal loads [107]. ... 19
Figure 1-8- The variation of the wear rate of the Cu-SiC composites with normal load under a) 0.5 ms-1, b) 1 ms-1, and c) 1.5 ms-1 sliding speeds [124]. ... 21
Figure 1-9- The variation of the coefficient of friction of Cu-SiC composites with normal load under a) 0.5 ms-1, b) 1 ms-1, and c)1.5 ms-1 sliding speeds [124]. ... 21
Figure 1-10- Nickel-phosphorous phase diagram [159]. ... 28
Figure 2-1- The press and tooling used to fabricate green samples. ... 35
Figure 2-2- Illustration of some green samples after pressing and ready for sintering. ... 35
Figure 2-3- Illustration of some sieve screens... 36
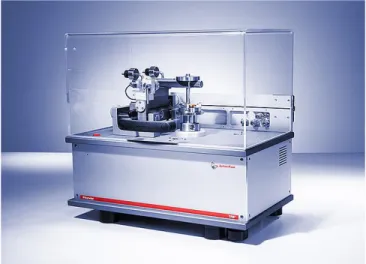
Figure 2-4- The pin-on-disk apparatus used to characterize the tribological properties of the samples. ... 37
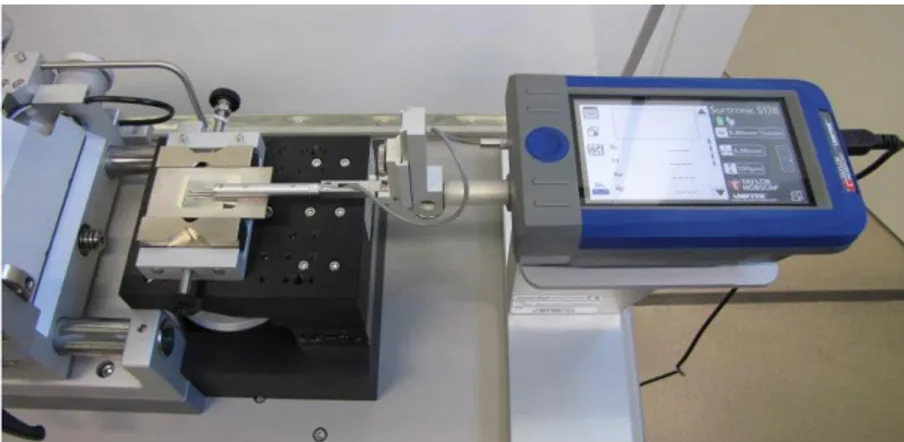
Figure 2-5- The profilometer device used to measure the mean wear rate and roughness of the samples. ... 38
Figure 2-6- a), and b) The machined pieces used to perform the shear test for the samples. ... 38
Figure 2-7- a) the setup for the shear test b) the machined pieces used to perform the shear test for the samples. ... 39
Figure 3-1- Cu-Ni binary phase diagram [164]. ... 42
Figure 3-2- Optical microscopy micrographs of the cross-section of commercial Ni coated graphite with a) 50x, b) 100x magnifications. ... 44
Figure 3-3- Optical microscopy micrographs of the cross-section of optimized Ni coated FeCr with a) 200x, b)1000x magnifications. ... 45
Figure 3-4- SEM secondary electrons micrographs of optimized Ni coated FeCr particles with a) 300x, b) 600x, c) 5000x, and d) 12000x magnifications. ... 46
Figure 3-5 a) SEM secondary electrons micrograph of a FeCr particle coated with Ni (2500x magnification), b) the EDS analysis of the selected zone ... 46
Figure 3-6- a) SEM cross-section image of a coated FeCr particle, b) EDS analysis of point 3. ... 47
Figure 3-7- a) SEM cross-section micrograph of a coated FeCr particle, b) EDS line analysis of this particle. ... 48
Figure 3-8- SEM secondary electrons micrograph of the cross-section of sample No. 4 with 200x magnification. ... 49
Figure 3-9- SEM backscattered micrographs of the cross-section of sintered sample 4, a) a coated FeCr particle 1500x, b) a coated graphite particle 3500x. ... 51
Figure 3-10- SEM micrographs of the cross-section of sintered samples, a) sample 2 (500x), b) backscattered image of sample 10 (250x). ... 53
IX
Figure 3-11- Optical microscopy cross-section micrographs of a) sample 1 with 100x magnification, b) sample 2 (only coated graphite) with 100x magnification, c) sample 4 (both coated graphite and FeCr) with 100x magnification, d) sample 4 with 400x magnification, e) sample 6 (with silica) with 100x magnification, f) sample 8 (with iron) with 200x magnification, and g) sample 10 (with iron and
silica) with 100x magnification. ... 55
Figure 3-12- Microstructure micrographs of a) the reference sample (400x), b) sample 4 (400x). .. 56
Figure 3-13a- COF of sample No. 1………...57
Figure 3-13b- COF of sample No. 2. ... 57
Figure 3-13c- COF of sample No. 3………...57
Figure 3-13d- COF of sample No. 4. ... 57
Figure 3-13e- COF of sample No. 5………...58
Figure 3-13f- COF of sample No. 6. ... 58
Figure 3-13g- COF of sample No. 7………..……….58
Figure 3-13h- COF of sample No. 8. ... 58
Figure 3-13i- COF of sample No. 9………..………..58
Figure 3-13j- COF of sample No. 10. ... 58
Figure 3-13k- COF of sample No. 11……….59
Figure 3-13l- COF of sample No. 12. ... 59
Figure 3-13 m- COF of sample No. 13……….………..59
Figure 3-13n- COF of sample No. 14. ... 59
Figure 3-13o- COF of sample No. 15……….59
Figure 3-13p- COF of sample No. 16. ... 59
Figure 3-13q- COF of sample No. 17……….………60
Figure 3-14- Average COF of the samples ... 61
Figure 3-15- Average wear rate of the samples. ... 62
Figure 3-16- a) The contact surface of the reference sample, b) surface roughness profile of the reference sample measured by profilometer on a radial path. ... 63
Figure 3-17- a) The contact surface of sample 4, b) surface roughness profile of sample 4 measured by profilometer on a radial path. ... 64
Figure 3-18- SEM micrographs of the wear surface of a, b, c, d) reference sample, e) the entire contact surface of the pin f) the pin. ... 66
Figure 3-19- SEM micrographs of a, b) the wear surface of sample 2, c) the entire pin wear surface, d) backscattered image of the pin wear surface. ... 68
Figure 3-20- SEM micrographs of wear surface of a, b) sample 4, c) the entire contact surface of the pin, d) pin. ... 70
Figure 3-21- SEM micrograph of a) wear surface of sample 6, b) more magnified image of the wear surface of sample 6, c) the entire contact surface of the pin, d) pin wear surface. ... 71
Figure 3-22- SEM micrographs of a, b) the wear surface of sample 8, c) the entire contact surface of the pin. ... 72
Figure 3-23- SEM micrographs of a) highly oxidized wear surface of sample 10, b) more magnified image of the wear surface of sample 10, c) the entire contact surface of the pin, d) pin wear surface. ... 73
Figure 3-24- SEM image of the wear surface of a) sample 16 with 500x magnification, b) the entire contact surface of the pin with 150x magnification. ... 74
Figure 3-25- Maximum shear load (N) that the samples with original FeCr powder can withstand. 75 Figure 3-26- a) the average wear rate of the samples, b) Brinell apparent hardness values of all the samples with original FeCr powder. ... 76
Figure 3-27- The indentions on the sample No.4 and HV values a) near coated graphite (115 HV), b) near coated FeCr (136 HV) and c) in the matrix (117 HV). ... 79
Figure 3-28- The variation of average coefficient of friction as function of Brinell apparent hardness. ... 80
X
Figure 3-29- Variation of average coefficient of friction as function of maximum shear load... 81
Figure 3-30- Variation of average coefficient of friction with average wear rate. ... 81
Figure 3-31- Variation of average wear rate as function of Brinell apparent hardness. ... 82
XI
List of tables
Table 1-1- Coefficient of friction of the copper MMCs under different normal loads [107]. ... 19
Table 1-2- The mechanical properties of the copper-based metal matrix composites reinforced with 20% Al2O3 and 20 wt% SiC [109]. ... 22
Table 1-3- The mechanical and physical properties of the copper matrix composite with nickel-coated SiC and uncoated SiC [109]. ... 26
Table 2-1- The weight fraction of powder components in the powder premixes... 34
Table 2-2- The density of powder components. ... 36
Table 3-1- Particle size distribution of original FeCr powder. ... 44
Table 3-2- Approximate elemental composition of the selected zone on the coated particle in Figure 3-5a. ... 47
Table 3-3- Approximative EDS elemental distribution results for point 3 in Figure 3-6a. ... 48
Table 3-4- Qualitative EDS analysis of the zone covering the entire surface of Figure 3-8. ... 50
Table 3-5- Qualitative EDS analysis of the points noted in Figure 3-9a. ... 51
Table 3-6- Qualitative EDS analysis of the points noted in Figure 3-9b. ... 52
Table 3-7- EDS results for the elements in zone 1 of Figure 3-35b. ... 68
XII
Dedications
To my parents who have supported me in any possible way to
achieve my goals.
To my brother and my sister-in-law who always encouraged me.
And to my girlfriend who has been giving me constant love and
XIII
Acknowledgment
First and foremost, I extend my strongest gratitude to my supervisor, Professor Carl Blais who gave me the opportunity to become his student and part of his research group and provided me with constant support, informative insights, and relentless motivation during my studies. Professor Blais not only helped me through the course of my studies but also taught me a lot of lessons that will guide me through my life as much as my professional career in the future. Broad knowledge, patience, good morals, and the unique personality of Professor Blais is what any student would ask for.
I also acknowledge the support from our industrial partner KUMA BRAKE PADS company members, especially Fèlix Belanger, Etienne Brisson, Pierre-Yves Trembley, and Christian Babin as well as NSERC for funding my research.
I would also like to thank all the technicians and lab members whose help was crucial for progressing my research, Vicky, Nathalie, Daniel, Guillaume, Suzie, Geneviève, and others. I appreciate your assistance.
Special thanks to Sara Alizadeh, who helped me a lot and contributed to my research. I also thank Justin, Simon, Geoffroy, Denis, Ebrahim, Hamidreza, Maryam, Hadi, and others.
To my parents who have always been the greatest source of motivation and support to me. Thank you for all the sacrifices that you made to give me all the means to be able to achieve my goals. I also thank my brother, who has always helped me with his knowledge and insights to pursue my studies.
I am so blessed that in the middle way of my master, I found the best company who has been on my side ever since and boosted my energy and motivation
1
Introduction
Brake pads are the primary constituents of the braking systems that are in contact with disk brakes during braking, as shown in Figure 1-1. The Coefficient Of Friction (COF) between the pairs during braking is reported to be between 0.1-0.7 in the literature [1, 2]. The magnitude of the heat energy absorbed by the emergency brake pads of a train moving at a speed of 300 km/h at the maximum permissible braking distance of 3800m is approximately 19MJ per disk in less than two minutes, and the flash temperature at the interface of the disk and pad is estimated to rise to 900˚C [3]. The friction materials that make up the brake pads are responsible for braking in different sliding speeds and loads and they undergo high wear-inducive conditions. As a result, they must have a formulation that offers a low wear rate and desirable friction performance involving a suitable and stable coefficient of friction.
The Metal Matrix Composites (MMCs) are considered appropriate as the friction materials. They provide the matrix with high toughness and ductility, as well as high thermal conductivity, which prevents local heat build-up and deterioration of mechanical and tribological properties. In brake pads industry, the reinforcements that are used in MMCs are categorized into hard (abrasive) reinforcements and solid reinforcements (lubricants). The hard reinforcements boost wear resistance and enhance the mechanical properties of the composite, such as strength and hardness up to a certain point. The solid lubricants reduce the wear rate and friction between surfaces. Incorporating the solid lubricants into the metal matrix through the powder metallurgy route produces self-lubricating metal matrix composites with superior lubrication effect compared to both solid and liquid lubricants.
Figure 1-1- The brake pad system consisting of a) brake pad and b) disk brake [4].
a) Friction b)
material Brake pads Disk brake
2
Powder Metallurgy (PM) process is one of the most popular ways to fabricate metal matrix composites due to the easy addition of various components with even distribution, limiting the segregation and undesirable reactions mostly involved in the liquid phase processes, and the ability to manufacture complex shapes. However, there are problems associated with the introduction of reinforcements to the matrix. The main problem is the weak sinterability of the reinforcements in the matrix, which leads to easy removal of the abrasive and solid reinforcements; therefore, resulting in an increase in wear rate as well as lower and less stable coefficient of friction. Furthermore, the mechanical and physical properties deteriorate because of the presence of weak interfacial bonds between the reinforcements and the matrix. Another problem is that sometimes unwanted reactions occur in the interface of the matrix and reinforcements.
3
Chapter 1: Literature review
1.1 Tribology
Tribology deals with wear, friction, lubrication, and in general, the surface interactions in the relative motion of solids, which are based on reaction and action forces. These interactions result in alterations in surface structure as well as transferring materials’ parts to either the counter surface or in the contact region [5].
1.2 Surface roughness
When analyzed under high magnifications, the entire solid surfaces are relatively rough. Roughness is generated by fluctuations of short wavelength characterized by asperities (local maxima) and valleys (local minima) with various amplitude and spacing parameters, which represent vertical and horizontal features, respectively. The surface roughness is either isotropic or anisotropic. The non-directional finishing processes, such as lapping, electropolishing, and sandblasting produce a homogenous surface. On the contrary, directional dependent finishing processes, such as milling and turning make the distribution of asperities directional. Apart from roughness, the surface structure may contain waviness, lay, and flaw. It is difficult to describe the surface feature with a limited number of parameters because of its sophistication [6, 7].
Average roughness (Ra) is the most popular surface roughness parameter, which is defined
by the arithmetic mean of the absolute values of vertical deviation from the neutral (mean) line in the roughness profile. The neutral line is a line below and above which the area of the profile is equal. Figure 2b shows the absolute values of the roughness profile in Figure 1-2a. Ra is expressed by equation 1-1; n is the number of data points on the profile, zi are the
data points of the profile and 𝑧̅ is the mean line position. Some of the Ra values after different
manufacturing processes are as follows. Coarse machining: 3–10 µm, fine machining: 1–3 µm, grinding and polishing: 0.2–1 µm, and lapping: 0.02–0.4 µm.
𝑅𝑎 =1
𝑛 ∑ |𝑧𝑖 − 𝑧̅| 𝑛
4
Figure 1-2- An example of a) surface roughness profile, b) Ra measurement [5].
1.3 Friction
Friction is defined as the resistance to the movement of bodies that are in contact and have relative motion. It is not a property of materials and depends on the tribological property of the system, composed of at least two bodies in contact; the interface of bodies, and the surrounding environment. The thin tribo-films formed at the interface of the two bodies strongly influence friction. Generally, if two parts are clean and smooth, they generate high friction, while low friction takes place for surfaces that have proper lubrication.
Bowden and Tabor [8] came up with a model that suggests the causes of friction. According to this theory, friction has adhesive (µa) and plowing component (µp), as indicated in equation
1-2. These components are independent of each other. The adhesive component depends on the material pair, lubrication, and the real area of contact, while the plowing component depends on the extent of plastic deformation at the asperity level. The real areas of contact, which are a small portion of the apparent (nominal) contact area, are the contact areas deformed at the tips of asperities when two surfaces are into contact. Even nominally flat surfaces are not perfectly smooth and have asperities at some length scale.
𝜇 = 𝜇𝑎+ 𝜇𝑝 equation 1-2
The contacts points between two clean materials are a good representative of adhesive friction. Since only the tips of asperities make contact as the metals’ surfaces are loaded against each other, the pressure that the asperities undergo is so high, due to their small surface area, that it results in plastic deformation. This plastic deformation develops the real area of contact until an adequate area sustains the load. The normal load (W) that is sustained
5
by the real contact area is calculated in equation 1-3; where the hardness of the softer material is denoted by H (Pa). Adhesive bonding occurs at the real contact area of asperities and must be overcome by a shear force, so that the relative motion of the sliding materials persists. The friction force and the coefficient of friction (COF) are determined by equation 1-4 and equation 1-5, respectively, if the work hardening and junction growth are ignored. The mean shear strength of the weakest joints at the real contact area is noted by S. For most metals, 𝑠 ≈𝐻
5; that is, the µa is expected to be around 0.2 for similar sliding pairs.
𝑊 = 𝐴𝐻 equation 1-3 𝐹 = 𝐴𝑆 equation 1-4 𝜇𝑎 = 𝐹 𝑊= 𝑆 𝐻 equation 1-5
Units: W: N, A: m2, S: N.m-2 (Pa), H: N.m-2 (Pa).
When the asperities of the harder material penetrate the softer material and plow out a groove by plastic deformation in the softer material, the plowing phenomenon happens. Plowing is the main friction component during abrasion processes and when the adhesion component is small. This component is expressed by equation 1-6. The harder material is assumed to have a lot of similar conical asperities of semi-angle 𝜃 that are in contact with the softer material with a relatively flat surface.
µp= 2
𝜋 cot 𝜃 equation 1-6
-Third-body mechanism
Wear and contamination particles that are trapped in the contact area of sliding pairs form a third body that strongly influences the tribological properties. They often increase the COF of the sliding pair via plowing. However, these particles may roll and act as rolling bearing particles leading to a decrease in COF. Only around 10 % of the particles roll, and thus the
6
1.4 Wear
Like friction, wear is the system property instead of the material property. It is described as the gradual material loss from the surface of sliding pairs. Usually, wear occurs because of surface interactions at the asperities level. During sliding, materials at the contact surfaces are likely to be displaced, which alters the properties of the material near the surface. The wear rate is defined as the loss of the material with time or sliding distance [5].
1.4.1 Wear mechanisms
Wear mechanisms are typically classified into abrasive, adhesive, delamination, oxidative, corrosive, fatigue, fretting and erosive wear. Adhesive and abrasive wear account for two-thirds of the entire wear mechanisms that take place in the industry. Based on the wear debris sizes and degree of damage, the wear process is also categorized into mild wear and severe wear [5].
1.4.1.1 Adhesive wear
Adhesive wear is characterized by adhesion bonding, shear and material transfer. When the surface asperities come in contact with each other, strong short-range forces are formed, which produce firm adhesive junctions at the real contact area. These junctions are broken if they are subject to enough shear forces, which mainly leads to the transfer of softer material to the surface of the harder material. Adhesive wear is also referred to as galling, scuffing, cold welding, or smearing [5]. Figure 1-3a shows an adhesive wear surface. Archard [10], using some assumptions, proposed equation 1-7 to calculate the adhesive wear rate.
𝑄 = 𝐾𝑊𝑋
𝐻 equation 1-7
Q: Wear volume (m3), W: Normal load (N), H: Hardness of the softer material (Pa), X: Sliding distance (m), and K: Wear coefficient.
1.4.1.2 Abrasive wear
When the asperities of hard materials or the abrasive particles are pressed into the softer surface, plastic deformation occurs. Sliding causes a fraction of soft materials to be eliminated via plowing and consequently leaves grooves in them. This wear mechanism
7
comprises deformation modes such as plowing, wedge formation and cutting. If abrasive wear debris exist between two surfaces making up a three-body abrasion, the wear rate is typically 10 to 1000 times higher than the two-body abrasion wear where only hard material asperities are in contact. The equation for abrasive wear is the same as adhesive wear (equation 1-7) [5]. Figure 1-3b shows an abrasive wear surface.
1.4.1.3 Delamination wear
Delamination wear involves several steps, namely plastic deformation, crack nucleation, and propagation. The shear and normal forces transferred at the contact points by asperities result in small plastic deformation that builds up in the subsurface area with continued loading. Subsequently, the micro-cracks and defects are formed at the subsurface. Finally, these cracks propagate parallel to the wear surface until the surface shears and cracks, leading to long and thin laminate wear debris under the surface and in the subsurface region that characterize the delamination wear. The pits shown in Figure 1-3c and the flake-like fragments are also the characteristics of the delamination wear mechanism [5].
1.4.1.4 Fatigue wear
Fatigue wear is characterized by cyclic loading and fatigue crack propagation. Unlike adhesive and abrasive wear that gradually cause destruction from the beginning of sliding, fatigue wear happens when the contact surfaces have undergone consecutive cycles of loading and unloading. This wear mechanism is identified by large pits and broken parts on the surface [5].
1.4.1.5 Oxidative wear
The oxidative wear is characterized by the formation of a weak oxide layer in the contact area of the sliding pairs. The formation of the oxide films is often advantageous since they inhibit the direct contact of the surfaces. It is reported that the oxide layer can diminish the wear rate of metallic materials by two orders of magnitude. Nonetheless, it undergoes deformation and cracking. The adhesion between the oxide layer and metals, the oxidation rate, the properties, and the composition of this film strongly affect wear and friction of the materials [5]. If the oxide film is thin and compact, the friction and wear rate decrease markedly, but, if it is too thick, the surface of the film undergoing high stress and deformation generates cracks and peels off, and thus the oxidation wear persists [11]. Figure 1-3d
8
illustrates the oxidative wear surface for aluminum alloys with oxide films which prevent severe wear in low sliding speeds.
1.5 Factors affecting wear and friction properties
1.5.1 Surface roughness
For smooth surfaces, friction increases rapidly during sliding since the real contact area develops rapidly. The roughness theory assumes that the friction force is equal to the force required to climb up the asperity of slope θ, and the coefficient of friction is described as a function of tan θ. Therefore, on very rough surfaces, friction is high due to the need to lift one surface over the asperities on the other. [16]. In the intermediate range of roughness, the friction is minimum and almost independent of the roughness [5].
Figure 1-3- SEM images of the wear surfaces for a) adhesive wear [12], b) abrasive wear of bronze-based MMC reinforced with 1 % Al2O3 [13], c) delamination wear of Cu based composite [14], and d) oxidation wear of Al-l6 % Si alloy [15].
9
1.5.2 Temperature
Temperature is an essential factor in altering the microstructure response of the metals to wear, causing phase transformations, and changing the physical and mechanical properties of the contact materials. It also affects the chemical reactivity of the surface, accelerates the oxide layer formation, and increases the oxidization rate [17]. The wear rate of the cobalt-steel sliding pair is 100 times higher at 653 K than 553 K, which is attributable to phase transformation from HCP to FCC lattice structure [18]. Furthermore, high temperature may promote other phenomena, such as recovery and recrystallization in work-hardened pieces. Hence, it can contribute to higher ductility and more plastic deformation in asperities [5].
1.5.3 Environment
In ambient conditions, unlike vacuum, most metals oxide and form oxide films that reduce the asperity contacts, thereby reducing COF and wear rate. In some cases, the COF is almost ten times higher in the vacuum than in air [19].
1.5.4 Hardness
Hard materials are more resistant to abrasive wear since they oppose to the cutting and plowing mechanisms. According to Archard’s model [10] in equation 1-7, the abrasive and adhesive wear resistance of the metals enhances by increasing the hardness. Based on studies, in general, the COF value is inversely proportional to the metal hardness resulting from the low surface deformation of hard materials, which produces less real contact area and less adhesion [20-22]. Nevertheless, this does not translate into lower COF for harder materials since other factors also contribute to the magnitude of COF [23].
1.5.5 Elastic modulus
The COF and adhesive wear rate are inversely proportional to the elastic modulus since higher elastic modulus results in lower adhesion. The abrasive wear rate is proportional to the elastic modulus/hardness ratio [24, 25].
1.5.6 Fracture toughness
According to Hornbogen [26], the wear phenomena are classified into three phases as a function of fracture toughness. In the first phase, the Archard law applies and wear is independent of the fracture toughness since, during the interaction of the asperities, the
10
applied strain is smaller than the critical strain at which the crack growth happens. In the second phase, mild wear makes a transition to severe wear, which is induced by the elevated strain rate, pressure, and reduction in fracture toughness. Finally, the third phase entails high embrittlement with elevated wear rate resulting from a drastic reduction in the fracture toughness [5].
1.5.7 Crystal structure and grain size
Crystal structure influences friction and wear properties via the number of slip systems for each crystalline structure, which affects the extent of plastic deformation. It is established that at least five independent slip systems are mandatory for the occurrence of plastic deformation by slip mechanism. The materials with HCP crystalline structures like graphite undergo less plastic deformation than the materials with FCC and BCC crystalline structures because of a smaller number of slip systems. Hence, there is less likelihood of the formation of large real contact areas for them. Consequently, they have lower COF and wear rate [12, 27-29]. Buckley [13] found that the wear rate of metals with SC crystalline structure is approximately two times the wear rate of metals with HCP crystalline structure. Numerous studies have demonstrated that the COF is directly proportional to grain size [14, 15, 30, 31].
The lattice parameters of the HCP metals affect the number of operating slip systems. HCP metals with the stacking ratio close to the ideal stacking ratio of 𝑐
𝑎= 1.633 such as Co, Mg,
and Rh primarily undergo slip along the basal planes and have lower COF, whereas the metals such as titanium with 𝑐
𝑎= 1.587 represent a non-basal slip mechanism, and thus have higher
COF [5].
1.5.8 Thermal diffusivity
Wear resistance is directly proportional to thermal diffusivity. The local thermal concentration that results from low thermal diffusivity of materials compromises mechanical strength and increases wear rate. Abdel-Aal [32] linked the heat dissipation capacity of metals to wear transition. He demonstrated that if the amount of generated heat is higher than the amount of the dissipated heat, mild wear transforms to severe wear. He also found out that if the heat build-up reaches a critical value, the oxide layer delaminates and consequently, the wear rate rises [5].
11
1.5.9 Subsurface zone
The large strain gradients in the zones near the surface, as well as their properties and structure play an important role in the formation of wear debris since they directly come from these zones. The morphology and composition of subsurface zones depend on the material of the sliding pairs, the geometry, the environment, and the mechanical conditions of contact. As shown in Figure 1-4, the properties and structure of zone 1, which is subject to elastic deformation and thermal cycling during tribo-contact, are preserved. In contrast, zone 2 is characterized by altered properties because of the recurring tribo-contact. In many cases, crack nucleation, crystallite reorientation and degeneration are observed in this zone. By approaching the contact surface, microstructure refinement occurs. At the interface of zone 2 to zone 1, the plastic deformation reaches zero, while in the interface of zone 2 to zone 3 the plastic deformation is maximized. Zone 3, being a tribo-layer created in situ, embodies the contact surface, materials of sliding pairs, and environment inclusions. The morphology and composition of this zone are different from zone 1 and zone 2. It also seems to be homogeneous and have a fine structure [33].
1.6 Metal Matrix Composites (MMCs)
Metal matrix composites (MMCs) are characterized by enhanced strength relative to weight, increased ductility, toughness, thermal stability and tribological properties. They are utilized
Figure 1-4- A schematic diagram of subsurface zones observed beneath wear surface [34].
12
in aerospace, automotive, and a multitude of applications. For instance, they are widely used as friction materials in braking systems [5, 35, 36]. The parameters that affect their performance are (1) material factors namely their microstructure and composition, their surface roughness, the properties of their reinforcements such as volume, size, shape, and distribution; the interfacial properties between matrix and reinforcements, as well as defects such as porosities that significantly influence the tribological properties, (2) mechanical factors such as normal load, sliding distance, and sliding velocity, (3) physical factors like temperature and environmental conditions.
1.6.1 Factors affecting the tribological properties of MMCs
1.6.1.1 Volume fraction of hard reinforcements
Hard reinforcements generally enhance the mechanical and tribological properties of MMCs [37, 38]. Increase in the volume fraction of hard reinforcements improves these properties due to their high hardness and strength, which tends to lower the plastic deformation of the friction material during sliding. They may also be effective in hindering abrasive wear in the ductile matrix, as depicted in Figure 1-5. Zou et al. [39] realized that as the volume fraction of SiC particle reinforcement increases, the wear resistance of monolithic Al-Si-Cu alloy improves. Nonetheless, it is reported that a critical reinforcement fraction exists for each MMC at which the wear resistance is maximized. Beyond this point, the wear rate increases due to three-body abrasion caused by hard reinforcements. Generally, a volume fraction of hard reinforcements over 20 vol% has proven ineffective and volume fraction over 30 vol % has shown to be counterproductive. The improvement in wear resistance of Al based MMCs with 5 vol%, 10 vol%, and 15 vol% fine SiC reinforcement is 26 %, 55 %, and 75 %, respectively compared to Al based MMCs without SiC [40].
13
Figure 1-5- Schematic illustration of hard second-phase particles protecting the ductile matrix from abrasion [40].
1.6.1.1 Sintering temperature
The sintering temperature affects the hardness, wear rate and friction coefficient of the metal matrix composites fabricated by PM via its influence on the fraction of residual porosity. Sintering Cu-based metal matrix composites at temperatures of 850 °C, 900 °C, and 950 °C showed that the friction coefficient, hardness, and wear resistance increase with increasing temperature, whereas the porosity volume decreases. At the sintering temperature of 850 °C and 900 °C, delamination and abrasive wear mechanisms accounted for the low wear resistance [41].
1.6.1.2 Porosity
The effect of porosity content on the tribological properties of sintered materials is complex. It is found that a certain level of porosity can be beneficial for reducing the wear rate of MMCs fabricated by PM. This effect strongly depends on the extent of the normal load. The level of porosity, on the one hand, reduces the cross-section that bears the load and, on the other hand, may give rise to debris trapping mechanism. The wear debris trapped on the surface pores reduce the wear rate by 1) decreasing contact pressure in comparison with the porous material without debris in the pores, 2) decreasing the probability of the formation of large abrasive agglomerates during sliding, 3) decreasing the plastic deformation near the pores and reducing the metallic debris [42]. One study stated that the materials with 10 % porosity and a homogeneous microstructure have the best wear resistance [43]. Another study suggested that at relatively low normal loads, e.g. 10 N, the positive effect of the porosity exists for the MMCs with up to around 12 % porosity, while at higher normal loads, this value is up to about 7 % [42].
14 1.6.1.3 Particle size
The size of particle reinforcement affects hardness, ductility, toughness, ultimate tensile strength, wear resistance and COF of MMCs. The effect of particle size on the tribological properties of MMCs is controversial. On the one hand, some studies demonstrate enhancement in the wear resistance of MMCs with larger reinforcements [38, 44-47]. For instance, the wear rate of AA7075 Al MMC containing SiC particles with 100 mesh size is 20 mg/km while the wear rate of the one which has SiC particles with 325 mesh size is 40 mg/km under the same conditions [48]. Zou et al. [39] realized that the wear resistance of SiC reinforced aluminum matrix composite with an average SiC particle size of 57 µm is almost ten times as much as the one that contains SiC particles with the average particle size of 5.5 µm. On the other hand, some researches discovered that MMCs with larger reinforcements have higher wear rates [48, 49]. For example, it is reported that the wear rate increases with increase in the size of SiC particles in the 20 µm-60 µm size range for Mg-based MMCs [50].
Studies show that at a critical reinforcement particle size, the effect of particle size on wear rate changes [50, 51]. For instance, the critical SiC size is 20 µm for Al MMCs. The wear rate of this composite reduces with increase in particle size up to 20 μm, and then it rises with increase in particle size up to 167 μm [51]. For Al MMCs reinforced with 15 wt% Al2O3, the
wear rate and COF decrease markedly when particle size reduces below 1 µm [52]. Several studies indicated that the COF rises with increase in particle size, as shown in Figure 1-6 [53-60]. F rictio n c o efficie n t Particles size (nm)
Figure 1-6- The effect of reinforcements particle size on the friction coefficient of the Al based composites [52-59].
15 1.6.1.4 Particle shape
The percentage of the improvement in the wear resistance of MMCs consisting of 10 vol% SiC with coarse particles is 15 %, while for the fine particles is 55 % compared to the unreinforced MMCs. The MMCs with graphite fibers have shown to have higher wear resistance than the ones with graphite flakes [61]. The addition of 5 wt% granular and 5 wt % flake graphite to copper-based MMCs for high-speed railway train brake pads showed the highest and most stable COF as well as the highest wear resistance [62].
1.6.1.5 Normal load
In general, it has been agreed that with increasing normal load, the wear rate of MMCs increases [40, 48, 53, 61, 63-68]. It is concluded that a critical normal load threshold exists during the sliding of MMCs [69]. Below this critical load, the wear rate is mostly mild and steady with mainly oxidation wear mechanism, whereas above this critical point, the wear rate increases with dominant delamination and adhesive wear mechanisms. At higher contact surface temperatures, the critical normal load diminishes [70].
Generally, it has been indicated that the COF of MMCs diminishes with normal load increase [53, 71-73]. This is thought to be due to a large amount of wear debris and high surface roughness that result from a high normal load [74, 75].The COF of the nickel matrix composite reinforced with 6-12 wt% graphite drops from about 0.4 to about 0.3 with an increase in normal load from 50 N to 150 N, which is attributable to compact tribo-films that are preserved during sliding. Nevertheless, in 200 N normal load case, the COF increases drastically since the tribo-films deteriorate due to the high normal load. It is also concluded that the effect of the normal load on the tribological properties strongly depends on the contact surface temperature [76]. The study of Ramesh et al. [77] on the copper-based MMCs shows that the COF gradually declines with increase in normal load up to 30 N after which the COF becomes constant. This behaviour is due to the softening of copper and its high ductility under severe deformation which lead to the transfer of the copper film to the surface of the other sliding body, thus inhibiting the direct contact and reducing COF of the friction material. By contrast, Pei et al. [11] studies on the effect of normal load on the tribological behaviors of copper-based MMCs indicate that by increasing the normal load, the COF
16
increases. At constant sliding speed, under 50 N, 75 N, 100 N and 150 N normal load, the coefficients of friction are 0.4, 0.42, 0.44, and 0.48, respectively.
1.6.1.6 Surface temperature
The surface temperature is a factor that strongly influences the tribological behaviours of materials. Some research discovered that there is a critical temperature below which temperature rise leads to an insignificant decrease or almost constant wear rate and COF and above which, temperature rise results in a marked increase in wear rate and COF. The reduced wear rate is attributable to the promotion of oxidation wear, and the increased wear rate is due to the deterioration of mechanical properties at high temperatures [78, 79]. Several studies have shown that the wear rate of MMCs initially decreases and then increases with temperature rise [80-82]. Besides, thermal properties such as thermal conductivity influence the wear resistance. It is demonstrated that improved thermal conductivity contributes to lowering the wear rate [83].
Generally, temperature rise results in reduction of the COF. For example, Boz and Kurt [84] concluded that COF falls with increase in temperature for Al2O3 reinforced MMCs. High
temperatures may also prompt the oxidization of graphite and thus cause higher COF. At high temperatures, the mechanically mixed layer on the surface falls off; consequently, the new surface is exposed and the COF increases. Subsequently, a new layer is formed on the exposed surface. The COF becomes stable when the formation rate of the new layer is equal to its shedding speed.
1.6.1.7 Sliding speed
Several studies demonstrated that the wear rate rises with increase in sliding speed [53, 65, 68, 85]. For instance, Xu [86] et al. showed that by increasing the sliding speed of C/C composites, the wear rate rises. Some other studies show that usually, the wear rate and the sliding speed are linearly proportional [87, 88]. However, below a critical sliding speed, the sliding speed rise results in a decrease of the wear rate due to promotion of the formation of an oxide layer with increasing temperature [89]. Above this point, the wear rate increases with increasing sliding speed due to elevated temperature. Increased temperature can promote the plastic deformation of the asperities by lowering the yield strength, dissolution of precipitates, microthermal softening of the matrix, reduction in flow stress of the materials
17
and even microstructure transformation [89].These phenomena, which affect the tribological behaviours of MMCs, take place at different temperatures depending on the mechanical and physical properties of the matrix’s material. Therefore, the effect of sliding speed on the tribological properties differs from one material to another and strongly depends on the surface temperature. Based on studies, Al-SiC and Al-Fe composites show an initial decrease in the wear rate at low sliding speed, while they show a significant rise in the wear rate at higher sliding speeds. For these composites, the critical sliding speeds are around 10 m/s and 2.5 m/s, respectively [90, 91].
It is concluded that the COF of MMCs generally declines with increasing sliding speed [53, 63, 64, 72, 92, 93]. For instance, for 17 wt% SiC reinforced Al matrix composite, the COF decreases from 0.3 to around 0.23 as sliding speed increases from 0.5 m/s to 1.5 m/s [93]. Similarly, the COF decreases from about 0.15 to 0.05 as sliding speed rises from 0.06 m/s to 0.18 m/s for 4.5 vol% Carbon Nano-Tubes (CNTs) reinforced Al MMCs [92]. Xu [86] et al. showed that by increasing the sliding speed of C/C composites, the COF rises first and then decreases. Holinski [94] and Pei et al. [11] suggest that the temperature elevation with increase in sliding speed results in the softening of the matrix and a decrease of its yield strength as well as promoting the formation of the oxide film layer in the contact area which tends to reduce the COF. Pei et al. [11] showed that by increasing sliding speed from 200 r/min to 600 r/min, under 50 N, 75 N, 100 N, and 150 N normal load, the COF of copper-based MMCs decreases from 0.58, 0.59, 0.60, and 0.62 to 0.4, 0.42, 0.44, and 0.48 respectively. The study of Han [95] on the copper-based MMCs with C-SiO2 reinforcements
suggested that the third body of the friction surface alters from granular to dense, micro-hardness rises, and the COF declines as the sliding speed increases.
1.6.2 Matrix and reinforcement types
The metals making up the matrix of the MMCs for friction applications are primarily copper, steel, iron, bronze, and aluminum. The wear and friction properties of these friction materials are influenced by the overall properties of the matrix materials such as type, hardness, and particle morphology [2].Copper and its alloys such as bronze have been broadly used as the matrix component to enhance thermal diffusivity at the friction interface. The copper oxides formed at the friction interface control the friction level and maintain the friction stable at
18
high temperatures as well as preventing aggressiveness against the counter surface [2]. Copper possesses high corrosion resistance, thermal and electrical conductivity, and melting point. It is reported that based MMCs are advantageous as compared to Fe-based and Cu-Fe based MMCs since they have better heat conductivity, wear, and friction resistance [96, 97]. A large fraction (20 wt% - 50 wt%) of the worn materials during braking become airborne particles [98-100]. The airborne particles generated during the braking of railway vehicles consisting of iron-based MMCs contain a large amount of iron oxide, which is very toxic and induces oxidative stress in human lung cells [101].
Unlike copper-based MMCs, the precipitation hardened copper alloys fabricated by Cr, Zr, Ag, or Fe addition destabilize in high temperatures, usually around 500 ˚C due to precipitation particle coarsening, thereby compromising mechanical and tribological properties. They also have lower heat conductivity than MMCs [102, 103].
1.6.2.1 Soft reinforcements (lubricants) for metal matrix composites
-Graphite
Graphite is the most broadly used solid lubricant because of its low price and outstanding performance [104, 105]. The weak van der Waals bonds between the interlayers of the HCP crystalline structure of graphite account for its low shear strength. As a result, it is sheared easily along the basal plane. The sheared graphite particles become finer in the wear process and tend to form compact tribo-films by increasing sliding speed. The tribo-films are composed of the fine graphite particles filled into the interspaces of wear debris. The highly compact tribo-films that prevent direct contact between the sliding surfaces as well as decreasing the stress that is applied to them explain the superiority of graphite compared to other solid lubricants [106].
The copper-based metal matrix composites with graphite volume fractions larger than 40 vol% can have a COF as low as 0.15, which remains almost constant by further increasing graphite and sliding distance because of a stable graphite film in the contact area, despite significantly deteriorating the mechanical properties of the composites. By contrast, composites with 10 vol% graphite displays higher COF starting from 0.2 and rises as the sliding distance increases and reaches about 0.35 for a sliding distance of 1100 m [107]. In a study on copper-based metal matrix composites with SiC and graphite particles, it is
19
suggested that the effect of graphite on the tribological properties is dependent on the normal load, as illustrated in Figure 1-7 and Table 1-1 [105].Under low normal loads, the formation and partial detachment of graphite-rich mechanically mixed layer controls the wear process. However, in high normal loads conditions, because of remarkable deterioration in the mechanical properties of the composites with high graphite content, intensely deformed graphite particles are favourable locations for micro-crack initiation, which results in delamination with large wear debris. The three-body abrasive wear mechanism resulting from the presence of large debris in the tribo-surface is therefore responsible for the high wear rate and COF of the tribo-system [105].
Table 1-1- Coefficient of friction of the copper MMCs under different normal loads [107].
Load (N) Percentage of graphite (vol %)
0 3 7 10
20 0.498 0.358 0.343 0.311
50 0.510 0.346 0.341 0.337
110 0.542 0.343 0.342 0.523
-MoS2
MoS2 is the second most popular solid lubricant after graphite in fabricating self-lubricating
MMCs. However, due to the formation of brittle CuMo2S3 in the sintered copper matrix
composites, the wear rate increases by adding a certain amount of MoS2. For this reason,
Figure 1-7- The variation of wear rate of the copper MMCs with graphite content under different normal loads [107].
20
their application in these composites is limited. Above 5 vol% MoS2 in the copper matrix
composite increases the wear rate. The coefficient of friction of the copper matrix composites reinforced with MoS2 is relatively higher than the ones with graphite reinforcement.
Increasing MoS2 up to 20 vol% decreases COF, which becomes about 0.3 for 20 vol% MoS2,
but then it increases above this value. Samples with 40 vol% MoS2 exhibit the COF of about
0.55 [107].
-Hexagonal boron nitride (h-BN)
Despite the similar crystalline structure of hexagonal boron nitride (h-BN) and graphite, the wear rate of Cu-based composites with 10 wt% h-BN is three times higher than the ones with 10 wt% graphite. Due to discontinuous and less compact h-BN tribo-films during sliding, which stems from higher shear strength than graphite, the MMCs containing h-BN have more contacts with the counter material in asperities level. As a result, they are exposed to severe plastic deformation and have larger real contact and wear rate [106].
1.6.2.2 Hard reinforcements and other additives for metal matrix composites
Hard reinforcements for MMCs usually consist of ceramics such as carbides (SiC, B4C, etc.),
oxides (Al2O3, SiO2, etc.), and nitrides (Si3N4, AlN, etc.).
-SiC
The wear rate and COF of copper-based metal matrix composites reinforced with 10 wt%, 15 wt% and 20 wt% SiC, under 10 N, 20 N, and 30 N normal loads and 0.5 ms-1, 1 ms-1, and 1.5 ms-1 constant sliding speeds, are shown in Figure 1-8 and Figure 1-9. By increasing SiC
content from 10 wt% to 20 wt%, the wear rate and COF of these composites decreases. Pure Cu has the highest wear rate and COF, followed by Cu-10 wt% SiC. Cu-20 wt% SiC has the lowest wear rate and COF. By adding 20 wt% SiC, the tensile strength and hardness rise by 24 % and 48 %, respectively, compared to pure Cu.
21
Figure 1-8- The variation of the wear rate of the Cu-SiC composites with normal load under a) 0.5 ms-1, b) 1 ms-1, and c) 1.5 ms-1 sliding speeds [124].
Figure 1-9- The variation of the coefficient of friction of Cu-SiC composites with normal load under a) 0.5 ms-1, b) 1 ms-1, and c)1.5 ms-1 sliding speeds [124].
22
-Al2O3
It is reported that the wear loss of copper-based MMCs with 0 wt%, 0.5 wt%, 1 wt%, 2 wt%, and 4 wt% Al2O3 is 22.46 %, 17.26 %, 15.77 %, 14.60 %, and 14.15 % and their average
friction coefficients are 0.2-0.25, 0.170-0.195, 0.18-0.21, 0.25-0.3, and 0.362-0.402, respectively[2]. Wang et al. [108] discovered that the COF of the copper-based MMCs increases by increasing the Al2O3 fraction. Nevertheless, the wear rate decreases first and
then rises by increasing the Al2O3 fraction. They also stated that the optimum fraction of
Al2O3 is 9 wt%. The mechanical properties of copper-based MMCs with 20 wt% Al2O3 and
20 wt% SiC are presented in Table 1-2.
Table 1-2- The mechanical properties of the copper-based metal matrix composites reinforced with 20% Al2O3 and 20 wt% SiC [109].
Materials
composition Yield strength Fracture strength Elongation
Cu–20 wt% Al2O3 14 MPa 112 MPa 33.2 %
Cu–20 wt% SiC 16 MPa 135 MPa 30.4 %
-SiO2
Among the hard reinforcements, SiO2 has the advantage of relatively low price, very low
thermal expansion, and relatively less abrasive effect on the composites. Several studies have reported that SiO2 particles can improve the mechanical and wear properties of metal matrix
composites [110-115]. However, SiO2 particles have many voids in their inference with the
copper matrix due to almost no mutual diffusion and stay in the matrix via physical combination. Under low sliding speed, since the friction film cannot form because of low surface temperature, the addition of SiO2 to copper-based MMCs increases COF due to
projection on the friction surface. The projecting SiO2 particles are easily broken and crushed
into fine particles that roll against the sliding pairs; thus, they increase wear rate by three-body abrasion wear [116]. At high sliding speeds, Xiong et al. [117] found out that SiO2
23
-Ferrochrome (FeCr)
FeCr alloys are solid solutions alloys in which chromium is dissolved in the iron matrix under high temperature. FeCr has the benefits of chromium, such as high abrasion and corrosion resistance, high melting point, and hardness. The resistance to oxidation of FeCr overcomes the low oxidation resistance of chromium. Hence, by incorporating FeCr powder to copper-based MMCs, the hardness, strength, and corrosion resistance of copper enhance [118].
In the copper-based MMCs reinforced with FeCr, FeCr has a similar elastic modulus to copper, unlike SiO2 and Al2O3 additives in copper based MMCs. The interface of FeCr with
the copper matrix is almost free of voids due to the mutual diffusion of chromium, iron, and copper in their interface. Besides, chromium and iron have certain solubility in the copper matrix under high temperatures and form a solid solution in the proximity of their interface with copper. The stronger adhesion of FeCr to copper matrix compared to SiO2 and Al2O3
reduces the elimination of FeCr particles from the matrix with less reduction in COF under high-speed friction conditions [118]. Zhao et al. [119] stated that the incorporation of FeCr powder to copper-based MMCs can enhance the COF by 12 %-27 % and decrease the wear rate by 20 %-70 %.
-Iron reinforcement
Iron is incorporated to Cu-based MMCs to increase their strength. Numerous studies show that increasing Fe content often increases COF and wear resistance. Therefore, it is added to enhance the tribological properties of MMCs [113, 117, 120-123]. Xiong et al. [117] concluded that raising Fe fraction from 0 wt% to 12 wt% increases COF. Based on the molecular and mechanical binding theory, it can be explained that increase in iron content increases the COF. Iron particles tend to project on the friction surface since the copper matrix undergoes abrasion and iron has higher strength and hardness than copper. Due to the projection of iron particles, the coarseness of the surface increases and as a result, the working force between the sliding surfaces strengthens which increases COF [117].
It is reported that composites containing high iron levels show low mean COF and wear rate since high Fe levels promote the formation of a tribo-oxide film, which strongly influences tribological properties [124]. Peng et al. [124] investigated the effect of the Cu/Fe weight ratio on the tribological behaviours of copper-based MMCs. Based on their findings, the
24
highest COF belongs to the composite with Cu to Fe weight ratio of 7.5 varying from 0.4 to 0.42, followed by the one with Cu to Fe weight ratio of 2.4 with 0.39-0.41 COF in different braking speeds. The composite with Cu to Fe weight ratio of 0.26 has the lowest wear rate, followed by the one with Cu to Fe weight ratio of 0.79 with friction coefficients of 0.28–0.36 and 0.33-0.39 in different braking speeds, respectively. These results show that by increasing the iron fraction, the COF and wear rate diminish.
1.6.3 Reinforcements-matrix interaction
The performance of MMCs is considerably affected by the interfacial bonding between the reinforcements and the matrix [125]. Although powder metallurgy is a beneficial method to manufacture MMCs and is broadly utilized in mass production levels, it also has its share of downsides. The MMCs fabricated by this method have relatively weak physical, mechanical, and tribological properties, which are due to the presence of a vast number of porosities, particularly in the interface between the metal matrix and the reinforcements [109, 126]. Due to chemical incompatibility, mismatch in thermal expansion and elastic properties, the interfacial bonding is weak [127].
-Ceramics-matrix
The ceramic reinforcements have a weak adhesion to the metal matrix. For example, it is cited that the contact angle of SiC in copper at 1100 ˚C is 140˚, which reveals its extremely weak wettability. The weak adhesion of ceramic particles to the metal matrix in MMCs can cause the pulling out of ceramic particles from the matrix during braking. As a result, three-body abrasive wear can occur by these hard ceramic particles therefore resulting in severe wear rate and unstable friction [116].
-Graphite-matrix
The problems associated with using graphite in the metal matrix composites are 1) interfacial reactions with the matrix and graphite loss in high temperatures, 2) high reactivity with oxygen in high temperatures, 3) weak adhesion to the matrix, and 4) reducing apparent density and weakening the mechanical properties. Also, the rapid elimination of graphite from the matrix due to its low adhesion strength to the matrix causes an unstable coefficient of friction and weak tribological properties. All these reasons necessitate the modification of the interface of graphite with the matrix.
25
1.6.3.1 Coated ceramic reinforcements in metal matrix composites
In order to solve the problems associated with ceramic-matrix interactions, several experiments indicated that an intermediate nickel layer could improve ceramic–metal adhesion in the powder metallurgical process [128].It is widely cited that by strengthening the interfacial bonding between the ceramic reinforcement and the metal matrix, the wear rate of the composites diminishes because of less pull-out of the ceramic reinforcements, which could, otherwise, trigger three-body abrasion. Wan et al. [129] concluded that copper matrix composites with nickel and copper coated alumina reinforcement have 40 % and 20 % higher wear resistance than the ones with uncoated alumina, respectively, which stems from stronger interfacial bonding between matrix and reinforcement [125].
-Copper coating on SiO2
Due to poor interfacial bonding between the SiO2 particles and the copper matrix, the relative
density of the copper matrix reinforced with SiO2 diminishes. SiO2 particles tend to fall off
the matrix, which reduces their function. By coating the SiO2 particles, not only the relative
density and hardness enhance, but also the removal of SiO2 particles from the matrix
decreases [116].
-Coated SiC as reinforcement particles in copper matrix
Apart from the low wettability of SiC in the copper matrix, SiC tends to react with copper at the temperatures around 850 °C [130]. Moreover, undesirable reactions between copper and SiC reinforcement have been reported in many cases at 900 ˚C [131, 132]. Molybdenum coating on SiC particles in copper matrix composites manufactured by powder metallurgy has been used to solve the problems associated with interfacial interactions between SiC and copper [130].
20 wt% nickel-coated SiC in the copper matrix shows improved bonding between SiC and copper. Table 1-3 shows the difference between the mechanical and physical properties of the copper based MMCs with 20 wt% SiC reinforcement and 20 wt% nickel-coated SiC. The latter has a lower porosity due to enhanced sinterability of SiC in the copper matrix. Furthermore, the mechanical properties of the composite with coated SiC are much better [109].
26
Table 1-3- The mechanical and physical properties of the copper matrix composite with nickel-coated SiC and uncoated SiC [109].
Materials composition Porosity Yield strength Fracture
strength elongation Cu-20 wt% nickel-
coated SiC 5% 83 MPa 344 MPa 43.6 %
Cu-20 wt% SiC 13% 16 MPa 135 MPa 30.4 %
1.6.3.2 Coated graphite reinforcement in metal matrix composites
The problems associated with graphite reinforcement and copper matrix, such as low wettability of graphite in the matrix, can be solved by metal coating on graphite powders. Besides, nickel-coated graphite powders are vastly used in metal matrix composites because of the appropriate properties obtained from the combination of graphite and nickel [133-139]. Nickel provides high corrosion and temperature resistance, and graphite offers desirable anti-friction properties. The Ni coating on graphite particles can be implemented by methods such as immersion (chemical) plating, chemical vapour deposition [133], gas suspension coating [137], electroplating [140], and electroless nickel plating [134, 138, 139]. Electroless nickel plating is proven to be one of the most effective and convenient coating methods [141-145].
1.7 Electroless plating
Electroless plating is a sort of electrochemical process during which the metal cations are reduced to metal atoms via the oxidization of the reducing agent and the coating is formed autocatalytically on the substrate [146, 147].
Although neither the electroless plating nor the chemical (immersion) plating require external current, in chemical plating, unlike electroless plating, the substrate on which deposition occurs is dissolved and loses mass resulting in weak adhesion and inferior properties of the coating. The chemical plating method is limited to metallic substrates, contrary to electroless plating, which can coat numerous substrates [146, 148]. The electroless plating of Ni-P on various ceramic powders like Si3N4, SiC, Al2O3, ZrO2, and diamond powder has been
![Figure 1-1- The brake pad system consisting of a) brake pad and b) disk brake [4].](https://thumb-eu.123doks.com/thumbv2/123doknet/2895446.74171/14.918.289.711.540.652/figure-brake-pad-consisting-brake-pad-disk-brake.webp)
![Figure 1-3- SEM images of the wear surfaces for a) adhesive wear [12], b) abrasive wear of bronze- bronze-based MMC reinforced with 1 % Al 2 O 3 [13] , c) delamination wear of Cu based composite [14], and d) oxidation wear of Al-l6 % Si alloy [15]](https://thumb-eu.123doks.com/thumbv2/123doknet/2895446.74171/21.918.162.756.216.682/figure-surfaces-adhesive-abrasive-reinforced-delamination-composite-oxidation.webp)
![Figure 1-7- The variation of wear rate of the copper MMCs with graphite content under different normal loads [107].](https://thumb-eu.123doks.com/thumbv2/123doknet/2895446.74171/32.918.220.700.460.861/figure-variation-copper-mmcs-graphite-content-different-normal.webp)
![Table 1-2- The mechanical properties of the copper-based metal matrix composites reinforced with 20% Al 2 O 3 and 20 wt% SiC [109]](https://thumb-eu.123doks.com/thumbv2/123doknet/2895446.74171/35.918.130.795.450.570/table-mechanical-properties-copper-based-matrix-composites-reinforced.webp)
![Table 1-3- The mechanical and physical properties of the copper matrix composite with nickel-coated SiC and uncoated SiC [109]](https://thumb-eu.123doks.com/thumbv2/123doknet/2895446.74171/39.918.137.789.157.310/table-mechanical-physical-properties-copper-matrix-composite-uncoated.webp)