HAL Id: hal-02141867
https://hal-univ-perp.archives-ouvertes.fr/hal-02141867
Submitted on 20 Dec 2019
HAL is a multi-disciplinary open access
archive for the deposit and dissemination of
sci-entific research documents, whether they are
pub-lished or not. The documents may come from
teaching and research institutions in France or
abroad, or from public or private research centers.
L’archive ouverte pluridisciplinaire HAL, est
destinée au dépôt et à la diffusion de documents
scientifiques de niveau recherche, publiés ou non,
émanant des établissements d’enseignement et de
recherche français ou étrangers, des laboratoires
publics ou privés.
Distributed under a Creative Commons Attribution| 4.0 International License
Arachis hypogaea
David Bertioli, Jerry Jenkins, Josh Clevenger, Olga Dudchenko, Dongying
Gao, Guillermo Seijo, Soraya Bertioli, Longhui Ren, Andrew Farmer, Manish
Pandey, et al.
To cite this version:
David Bertioli, Jerry Jenkins, Josh Clevenger, Olga Dudchenko, Dongying Gao, et al.. The genome
sequence of segmental allotetraploid peanut Arachis hypogaea. Nature Genetics, Nature Publishing
Group, 2019, 51 (5), pp.877-884. �10.1038/s41588-019-0405-z�. �hal-02141867�
1Center for Applied Genetic Technologies, University of Georgia, Athens, GA, USA. 2Institute of Plant Breeding, Genetics and Genomics, University of Georgia, Athens, GA, USA. 3Department of Crop and Soil Science, University of Georgia, Athens, GA, USA. 4HudsonAlpha Institute of Biotechnology, Huntsville, AL, USA. 5The Center for Genome Architecture, Baylor College of Medicine, Houston, TX, USA. 6Instituto de Botánica del Nordeste (CONICET-UNNE), Corrientes, Argentina. 7FACENA, Universidad Nacional del Nordeste, Corrientes, Argentina. 8Department of Plant Pathology, University of Georgia, Tifton, GA, USA. 9Interdepartmental Genetics Graduate Program, Iowa State University, Ames, IA, USA. 10National Center for Genome Resources, Santa Fe, NM, USA. 11Center of Excellence in Genomics & Systems Biology, International Crops Research Institute for the Semi-Arid Tropics (ICRISAT), Hyderabad, India. 12Department of Computer Science, Iowa State University, Ames, IA, USA. 13Department of Horticulture, University of Georgia, Tifton, GA, USA. 14UMR5096, Laboratoire Génome et Développement des Plantes, CNRS, Perpignan, France. 15UMR5096, Laboratoire Génome et Développement des Plantes, Université de Perpignan, Perpignan, France. 16Crop Protection and Management Research Unit, US Department of Agriculture, Agricultural Research Service, Tifton, GA, USA. 17Corporate R&D, LG Chem, Seoul, Republic of Korea. 18UMR232, Diversité, Adaptation et Développement des Plantes, IRD, Montpellier, France. 19UMR232, Diversité, Adaptation et Développement des Plantes, Université de Montpellier, Montpellier, France. 20Embrapa Genetic Resources and Biotechnology, Brasília, Brazil. 21Department of Frontier Research and Development, Kazusa DNA Research Institute, Kisarazu, Japan. 22National Institute of Plant Genome Research, New Delhi, India. 23Corn Insects and Crop Genetics Research Unit, US Department of Agriculture Agricultural Research Service, Ames, IA, USA. 24Henan Provincial Key Laboratory for Genetic Improvement of Oil Crops, Industrial Crops Research Institute, Henan Academy of Agricultural Sciences, Zhengzhou, China. 25Key Laboratory of Oil Crops in Huanghuaihai Plains, Ministry of Agriculture and Rural Affairs, Zhengzhou, China. 26Genome Center, University of California, Davis, Davis, CA, USA. 27Crop Genetics and Breeding Research Unit, US Department of Agriculture Agricultural Research Service, Tifton, GA, USA. 28Genomics and Bioinformatics Research Unit, US Department of Agriculture Agricultural Research Service, Stoneville, MS, USA. 29Department of Energy, Joint Genome Institute, Walnut Creek, CA, USA. 30These authors contributed equally: David J. Bertioli, Jerry Jenkins, Josh Clevenger. 31These authors jointly supervised this work: Steven B. Cannon, Scott A. Jackson, Jeremy Schmutz. *e-mail: [email protected]; [email protected]; [email protected]
T
he domestication of plants, thousands of years ago, increased
food supply and allowed the formation of large, complex
human societies. Out of many thousands of wild species,
only a few became domesticated crops and they now provide most
of the food consumed by humans. It has long been noted that
many of these crops are polyploid: their nuclei have more than
two sets of chromosomes that are often derived from different
species. Although it has been surprisingly difficult to rigorously
demonstrate, it has long been thought that domestication may
favor polyploids
1,2.
Peanut (also called groundnut; Arachis hypogaea L.) is an
impor-tant food crop (annual production of ~44 million tons based on
The genome sequence of segmental allotetraploid
peanut Arachis hypogaea
David J. Bertioli
1,2,3,30*, Jerry Jenkins
4,30, Josh Clevenger
1,2,3,30, Olga Dudchenko
5, Dongying Gao
1,
Guillermo Seijo
6,7, Soraya C. M. Leal-Bertioli
1,2,8, Longhui Ren
9, Andrew D. Farmer
10, Manish K. Pandey
11,
Sergio S. Samoluk
6,7, Brian Abernathy
1, Gaurav Agarwal
8, Carolina Ballén-Taborda
2, Connor Cameron
10,
Jacqueline Campbell
12, Carolina Chavarro
1,2, Annapurna Chitikineni
11, Ye Chu
13, Sudhansu Dash
10,
Moaine El Baidouri
14,15, Baozhu Guo
16, Wei Huang
12, Kyung Do Kim
1,17, Walid Korani
1,
Sophie Lanciano
15,18,19, Christopher G. Lui
5, Marie Mirouze
15,18,19, Márcio C. Moretzsohn
20,
Melanie Pham
5, Jin Hee Shin
1,17, Kenta Shirasawa
21, Senjuti Sinharoy
22, Avinash Sreedasyam
4,
Nathan T. Weeks
23, Xinyou Zhang
24,25, Zheng Zheng
24,25, Ziqi Sun
24,25, Lutz Froenicke
26,
Erez L. Aiden
5, Richard Michelmore
26, Rajeev K. Varshney
11, C. Corley Holbrook
27,
Ethalinda K. S. Cannon
12, Brian E. Scheffler
28, Jane Grimwood
4, Peggy Ozias-Akins
2,13,
Steven B. Cannon
23,31, Scott A. Jackson
1,2,3,31* and Jeremy Schmutz
4,29,31*
Like many other crops, the cultivated peanut (Arachis hypogaea L.) is of hybrid origin and has a polyploid genome that contains
essentially complete sets of chromosomes from two ancestral species. Here we report the genome sequence of peanut and show
that after its polyploid origin, the genome has evolved through mobile-element activity, deletions and by the flow of genetic
information between corresponding ancestral chromosomes (that is, homeologous recombination). Uniformity of patterns of
homeologous recombination at the ends of chromosomes favors a single origin for cultivated peanut and its wild counterpart
A. monticola. However, through much of the genome, homeologous recombination has created diversity. Using new polyploid
hybrids made from the ancestral species, we show how this can generate phenotypic changes such as spontaneous changes in
the color of the flowers. We suggest that diversity generated by these genetic mechanisms helped to favor the domestication of
the polyploid A. hypogaea over other diploid Arachis species cultivated by humans.
FAOSTAT data for 2016 (
http://www.fao.org/faostat/en/#home
)).
Whereas almost all related species in the genus Arachis are diploid
(two sets of ten chromosomes; mostly 2n
= 2× = 20 chromosomes),
A. hypogaea is polyploid
3,4. The seeds of all of these species are an
attractive food, and several have been cultivated for thousands of
years
5(Supplementary Note 1). Indeed, the action of humans was
key to the formation of A. hypogaea itself. About 9,400 years ago
(estimated by nucleotide divergence
6), the human transport of
the ‘B’ genome species, A. ipaensis Krapov. & W.C. Greg., into the
range of the ‘A’ genome species A. duranensis Krapov. & W.C. Greg.
enabled their hybridization and the formation of A. hypogaea
6. It has
two sets of chromosome pairs, one from each of the ancestral
spe-cies: a type of polyploid termed allotetraploid (AABB-type genome;
2n = 4× = 40 chromosomes; genome size of ~2.7 Gb).
The origin of A. hypogaea was associated with a particularly
severe population bottleneck
7–9. This could, in principle, have
reduced the variability on which, over generations, human
selec-tion could act. However, A. hypogaea evolved, becoming completely
dependent on cultivation and morphologically very diverse
5. Two
subspecies (hypogaea and fastigiata) and six botanical varieties
(hypogaea, hirsuta, fastigiata, vulgaris, aequatoriana and peruviana)
are recognized
5,10,11. Different grain colors and sizes, pod shapes
and growth habits distinguish thousands of landraces and
culti-vars
5,11(see also United States Department of Agriculture (USDA)
Germplasm Resources Information Network (
https://www.ars-grin.
gov
)). It seems notable that, in spite of the higher genetic
diver-sity of the diploid species
7,9, and their cultivation starting earlier
(Supplementary Note 1), it was the derived allotetraploid, A. hypo
-gaea, that underwent the transformation to become the crop of
worldwide importance.
Some time ago, while planning to sequence and assemble the
peanut genome, we realized that it would not be possible using the
short-read data (~100–200 bp DNA) that were generated by the
only technology that was economically feasible at the time; such
sequences were too short to reliably resolve the very similar A and
B genomes, which frequently have more than 98% DNA identity
between corresponding genes
6,12,13. This level of similarity is due to
the progenitor species that gave rise to the two subgenomes having
diverged only around 2.2 million years ago (refs.
6,9,14). Therefore, as
a foundation for understanding the genome of cultivated peanut, we
first sequenced the genomes of both the diploid ancestral species
6.
These diploid genomes afforded new insights into peanut genetics.
Notably, it was possible to infer that some chromosome ends of A.
hypogaea had changed from the expected AABB structure to AAAA
or BBBB, implying a particular complexity in peanut genetics
6,15–18.
Here, using the much longer-read data obtained with PacBio
technology
19, and scaffolding using Hi-C
20,21, a method used for
determining the conformation of DNA in the nucleus, we report
the complete chromosome-scale genome sequence of A. hypo
-gaea cv. Tifrunner, a runner-type peanut. We also characterize the
genomes of a diverse selection of cultivated peanuts, together with
its wild counterpart, A. monticola Krapov. & Rigoni, and induced
allotetraploid hybrids derived from the ancestral species. We are
able to visualize, in considerable detail, the products of variable
deletions from, and genetic recombination between, the A and B
subgenomes. It seems likely that these variations in genome
struc-ture generated phenotypic variation on which selection could act,
and helped to favor A. hypogaea over its diploid relatives during the
process of domestication.
Results
Sequencing and assembly of the peanut genome. Arachis hypogaea
cv. Tifrunner
22, a runner-type peanut (registration number CV-93,
PI 644011) was sequenced using whole-genome shotgun
sequenc-ing. Twenty chromosome sequences were produced (for assembly
metrics see Supplementary Tables 1 and 2). They were numbered
Arahy.01–Arahy.20, where the A subgenome is represented as
Arahy.01–Arahy.10 and the B subgenome as Arahy.11–Arahy.20. The
chromosome sequences contain 99.3% of the assembled sequence
and are 2.54 Gb, 93% of the size estimated by flow cytometry
23.
Chromosome architecture. The chromosomes of A. hypogaea
cv. Tifrunner largely reflect their ancestral structures; the
home-ologous chromosomes mostly have a one-to-one correspondence:
Arahy.02/12, 03/13, 04/14 and 10/20 are almost completely
col-linear; 06/16 and 09/19 are differentiated by a large inversion
in one arm; 05/15 are differentiated by two large inversions; and
01/11 are differentiated by three large inversions. Chromosomes
17/18 have undergone reciprocal translocations relative to 07/08
(Supplementary Figs. 1–12). Gene densities are highest in distal
chromosome regions (Supplementary Fig. 13). Gene counts are 11%
higher in the B subgenome, with 35,110 predicted genes, compared
to 31,359 genes in the A subgenome. Long terminal repeat (LTR)
retrotransposons are highly abundant in pericentromeric regions,
whereas DNA transposons are more frequent in euchromatic arms
(Supplementary Fig. 14). Other transposable elements, together
with approximately 3,300 pararetrovirus sequences account for 74%
of the assembled genome sequence (Supplementary Tables 3 and 4).
Notably, this compares to 64% repetitive content estimated by
reas-sociation kinetics
24, indicating the high quality and relative lack of
collapse of repeats in this long read-based assembly. The chloroplast
genome of A. hypogaea and a chloroplastic plasmid were inherited
from A. duranensis (Supplementary Fig. 15).
DNA methylation and small RNAs. Genic methylation patterns
were typical for plants, with lower methylation in transcribed
regions and characteristic dips in methylation at transcription start
and end sites (Supplementary Fig. 16). Genome-wide methylation
per cytosine content was higher in pericentromeric regions than
chromosome arms (Supplementary Fig. 17). Methylation was lower
in the A subgenome than the B subgenome; with 76.0% and 80.5%
methylation at CG sites, 61.7% and 65.1% methylation at CHG sites
(where H is an A, T or C) and 5.14% and 5.51% methylation at
CHH sites, respectively (Supplementary Table 5 and Supplementary
Fig. 18a). Greater densities of DNA sequences corresponding to
small RNAs were found in proximal, repetitive-rich regions of
chro-mosomes (Supplementary Fig. 19). However, greater densities of
DNA sequences that corresponded to uniquely mapping small RNAs
were found in gene-rich chromosomal regions (Supplementary
Fig. 20). Within genes, the B subgenome was enriched relative to the
A subgenome for DNA sequences that corresponded to small RNAs
(Supplementary Fig. 18b).
Comparison of gene expression in subgenomes. The expression
of homeologous gene pairs (dataset 1a in ref.
25) from the A and
B subgenomes of Tifrunner was investigated in diverse tissues and
developmental stages (dataset 1b,c in ref.
25). As has been reported
in other recent polyploids
26,27, overall, the number of homeologous
gene pairs with expression biased towards the A subgenome was
not significantly different from the number biased towards the B
subgenome (P = 0.2, two-sided binomial test; n = 3,648 and 3,759
for A and B, respectively). However, when tissues were considered
separately, all but one had slightly more B than A subgenome-biased
genes from homeologous pairs. In three reproductive tissues and in
roots this difference was significant (P < 0.05, one-sided binomial
test; Supplementary Fig. 21; dataset 1 in ref.
25).
Broadly, homeologous pairs with the highest asymmetry in
expression (log
2(expression ratios)
> 3,
Benjamini–Hochberg-adjusted P < 0.05, Wald test; Supplementary Fig. 22) were more
commonly involved in oxidation–reduction processes, pollen
rec-ognition, lipid and chitin metabolic processes and response to biotic
stimulus (Supplementary Fig. 23a; dataset 1c in ref.
25).
Taking the example of the subterranean peg tip (a unique
repro-ductive structure in peanut), the A subgenome-biased
homeolo-gous pairs were enriched for genes involved in mannose metabolic
processes, nitrate assimilation and cell wall assembly, whereas the
B subgenome-biased homeologous pairs were enriched for genes
involved in the response to biotic stimulus, sucrose transport and
glucan metabolic processes. In the maturing pericarp (Pattee stage
6), the A subgenome-biased homeologous pairs were enriched for
genes involved in phosphorylation signal transduction,
carbohy-drate metabolism and cell wall biogenesis, whereas B
subgenome-biased homeologous pairs were enriched for genes involved in
inorganic ion transport and response to biotic stimulus (dataset 1d,e
in ref.
25). Additionally, we identified homeologous gene pairs with
the highest asymmetry in expression (n = 4,062; log
2(expression
ratios) > 3, Benjamini–Hochberg-adjusted P < 0.05, Wald test;
Supplementary Fig. 22) and a set of 394 pairs that displayed
consis-tent asymmetrical expression patterns in at least half of the evaluated
tissues (Supplementary Fig. 23b). Highly asymmetrically expressed
homeologous pairs were more commonly involved in oxidation–
reduction processes, pollen recognition, lipid and chitin metabolic
processes and response to biotic stimulus (Supplementary Fig. 23a,
dataset 1c in ref.
25) and, as might be expected, the consistently
asymmetrically expressed homeologous pairs were mainly enriched
for functions associated with fundamental biological processes such
as organelle organization, molecular transport and protein complex
biogenesis (dataset 1c in ref.
25).
Changes following polyploidy. Genetic exchange between
sub-genomes and deletions. For allotetraploids, chromosome
associa-tions during meiosis and genetic exchange are mostly limited to
corresponding chromosomes within the same subgenome (that is,
homologous chromosomes); however, as has been characterized in
other plants such as Brassica
26,28,29, these may also occur at lower
fre-quency between corresponding chromosomes from the other
sub-genome (that is, homeologous chromosomes)
3,6,16. We investigated
genetic exchange between the subgenomes and deletions in more
than 200 diverse genotypes comprising the wild tetraploid peanut
(A. monticola), landraces and cultivars of A. hypogaea, and new
allotetraploid hybrids made from the ancestral species (dataset 2 in
ref.
25). Two different approaches were used: observation of mapping
densities of short-read whole-genome sequences onto the combined
sequenced diploid ancestral species genomes, and analysis of the
Or thologous gene A / B pairs ordered by chromosome positions in A. ipaensis 10,000 12,000 14,000 16,000 6,000 8,000 4,000 2,000 0 10,000 12,000 14,000 16,000 6,000 8,000 4,000 2,000 0 10,000 12,000 14,000 16,000 6,000 8,000 4,000 2,000 0 10,000 12,000 14,000 16,000 6,000 8,000 4,000 2,000 0 10,000 12,000 14,000 16,000 6,000 8,000 4,000 2,000 0
Overview of whole genome composition
A. monticola Tifr unner va r. per uviana A. ipaensis × A. duranensis Diploid a b c d e f g A. monticola
Pl497260 A. hypogaeacv. Tifrunner subsp. fastigiata var. peruvianaA. hypogaea Pl590455 120.44 Mb Arah y.12 Arah y. 19 120.45 Mb 51 kb 73 kb 0 –5 01 02 03 04 05 06 07 08 09 10 B >A A =BA >B 5 –5 0 B >A A =B A >B 5 0
Ratio of mapping densities onto orthologous genes A/B
–5 B >A A =B A >B 5 –5 0 B >A BBBB A =B AAAA A >B 5 –5 0 B >A A =BA >B 5 Tetraploid
Fig. 1 | Visualizations of genome compositions of A. hypogaea, A. monticola and hybrids derived from the peanut’s ancestors. a–e, Overviews of genetic exchange between ancestral A and B genomes; f,g, visualization of fine-scale exchange at the ends of chromosomes. In a–e, data are of log2-transformed values of ratios of mapping densities of whole-genome sequences onto 17,373 orthologous A/B gene pairs from A. ipaensis and A. duranensis, ordered according to chromosome number and position in A. ipaensis. Where values cluster around zero, as is the case in the diploid hybrid in a, A and B genes are present in equal number and are unaltered by genetic flux between them; in tetraploid genotypes this indicates a genome structure of AABB. Deviations from zero indicate genetic flux between the orthologous gene pairs, or complete replacement of A genes by B, or vice versa. b, The ninth generation tetraploid hybrid shows such deviations, with a change in genome structure from AABB to AAAA for chromosomes A04/B04 and the upper regions of B07/A08. c–e, These patterns are very different from those of A. monticola and A. hypogaea, which are similar to each other (and throughout diverse genotypes). Note deviations are mostly at chromosome ends. f,g, Fine-scale recombination (fingerprints) between A and B subgenomes are shown in two distal chromosome regions in which the genome structure approximates AAAA; the presence of SNPs characteristic of the ancestral B that form barcode-like patterns that are uniform in all A. monticola and A. hypogaea are observed. These patterns emphasize the similarities between A. monticola and A. hypogaea and favor a single polyploid origin (Supplementary Fig. 25; dataset 4a in ref. 25).
short-read whole-genome sequences for single-nucleotide
poly-morphisms (SNPs) that consistently differentiate representatives of
A and B genome diploid species
5,9,30–32(Supplementary Fig. 24). (It
should be noted that, except for the assembled reference genotype
of Tifrunner, these methods are not capable of detecting genome
changes that result from balanced homeologous exchanges or
chro-mosome rearrangements.)
Genetic exchange between ancestral genomes could be inferred
towards the ends of colinear pairs of homeologous chromosomes.
In these regions, the genome structure was not the expected AABB,
but may be better described as AAAA or BBBB, that is,
‘tetraso-mic’ conformations. The abrupt junctions of these segments
indicate that they may have occurred by crossover (Figs.
1
and
2
and Supplementary Figs. 1–12 and 25; datasets 3–5 in ref.
25).
In Tifrunner, 14.8 Mb of the A genome has been transferred, in
blocks, into B chromosomes, and 3.1 Mb of the B genome has
been transferred, in blocks, into A chromosomes (Supplementary
Tables 6 and 7). Most of these tetrasomic regions are at the very
distal ends of chromosomes—for example, the lower regions of
Arahy.02/Arahy.12, Arahy.04/Arahy.14, Arahy.06/Arahy.16 and the
upper regions of Arahy.05/Arahy.15—and these were present in all
of the A. hypogaea and A. monticola genotypes surveyed (but not
in induced allotetraploids derived from the same diploid ancestral
species; Fig.
1
; dataset 4a,b in ref.
25). However, in slightly more
proximal regions, the tetrasomic regions were variable. Notably,
in different accessions, in some genome regions, genetic exchange
had occurred in opposite directions, creating AAAA structures
in some accessions, and BBBB structures in others (Fig.
2
and
Supplementary Fig. 25; dataset 4a,b in ref.
25). Although clearly
identifiable as A or B, these tetrasomic regions contain a significant
number of SNPs that are characteristic of the corresponding
sub-genome (Supplementary Table 7). This may be the result of genetic
exchange by gene conversion prior to the large-scale transfer of
genetic material between subgenomes. The fine-scale patterns of
these SNPs represent substantially fixed, or fossilized, genetic
sig-nals (‘fingerprints’) from past events. Their uniformity in all six
botanical varieties and the wild counterpart of peanut A. monticola
favors a single polyploid origin for the two species (Fig.
1f,g
;
data-set 5 in ref.
25). In Tifrunner, chromosome segments transferred
between subgenomes mostly form tetrasomic regions, although
one region at the lower end of Arahy.16 contains a chromosome
segment with predominantly ancestral A genome characteristics
that is absent from Arahy.06 itself (Supplementary Fig. 6). This
region on Arahy.16 forms a peculiar structure in which B and A
homeologous chromosome segments are retained in tandem.
The signals of disperse genetic exchange were also detectable
through the bodies of chromosomes. Overall, this dispersed genetic
exchange has had a greater total effect than the transfer of
chromo-some segments. In Tifrunner, almost twice as many B alleles have
been transferred to A chromosomes than vice versa (Supplementary
Table 6; dataset 3 in ref.
25). In addition, variable deletions were
fre-quent in proximal chromosome regions (Fig.
2
; dataset 4c in ref.
25).
Notably, a large deletion (around 10 Mb) was common on Arahy.14
of botanical varieties fastigiata and vulgaris (e.g., Fig.
2b
).
In Tifrunner, genome deletions have disproportionately affected
some gene families. The genes most frequently lost were members
of the serine/threonine-protein phosphatase (around 89 genes) and
FAR1-related families (around 83 genes). Genes in these families
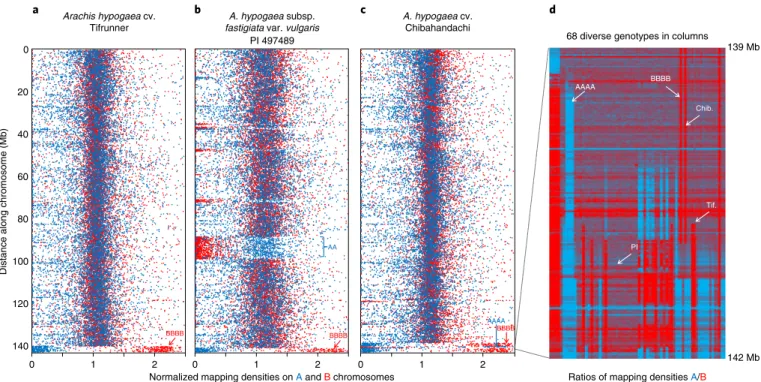
Genome composition Arahy.04/Arahy.14
68 diverse genotypes in columns
AAAA BBBB Chib. Tif. PI 139 Mb 142 Mb PI 497489 Arachis hypogaea cv. Tifrunner 0 a b c d 20 40 60
Distance along chromosome (Mb)
80
100
120
140
0 1 2 0 1
Normalized mapping densities on A and B chromosomes
2 0 1 2
Ratios of mapping densities A/B
A. hypogaea subsp.
fastigiata var. vulgaris A. hypogaea cv.Chibahandachi
AA
AAAA
BBBB BBBB BBBB
Fig. 2 | Structural variation generated by deletions and recombination between ancestral genomes (or subgenomes) of A. hypogaea. a–c, Genetic exchange between Arahy.04 and Arahy.14 in three A. hypogaea, visualized by mapping the densities of short-read whole-genome sequences onto A. duranensis and A. ipaensis (normalized values, in blue and red respectively; distances scaled to Arahy.14). Where mapping densities cluster around the expected value of one, the genome composition is AABB. Where mapping densities on one genome increase to approximately two and on the other genome decrease to near zero, the genome composition is better described as AAAA or BBBB. Mapping densities decrease to around zero on one genome and remain around one on the other indicate a deletion (common in b). d, A panel of 68 representative diverse genotypes in a region of Arahy.04 and Arahy.14 in which hypervariability has been created by differential recombination between subgenomes. The panel represents a heat map of log2 -transformed ratios of mapping densities on the B and A genomes; blue represents AAAA and red represents BBBB, Tif., PI and Chib. are the genotypes repesented in a–c, respectively (for full visualizations, see dataset 4b in ref. 25).
tend to occur in large genomic clusters or arrays, which can expand
or contract through slipped-strand mispairing
33. There have also
been apparent increases in gene families; these include an increase
of around 118 SAUR-like auxin-responsive protein family genes and
around 50 NBS-LRR–encoding genes (the latter family of genes
encode plant nucleotide-binding-site leucine-rich repeats and are
associated with pest and disease resistance). For an overview of loss
of ancestral SNP alleles through homeologous recombination and
deletions in 39 diverse genotypes, see Supplementary Fig. 26.
Mobile-element activity. Transposable elements generate
extra-chromosomal circular DNAs when active
34. Circular DNAs were
detected from a MUTATOR (MU4) and TY3-GYPSY (ZUHE)
ele-ment in A. duranensis, A. ipaensis, their hybrids and A. hypogaea,
and from a TY1-COPIA element (YARA) in A. duranensis and
A. hypogaea. However, no abundant circular DNAs were detected
in induced allotetraploids or A. hypogaea that were not detected
in one or both of the ancestral diploids (Supplementary Fig. 27).
This indicates that after hybridization and polyploidy, somatic
transposable element regulation was not heavily disturbed and no
new large-scale mobilization of transposable elements occurred.
Comparisons of genome sequences of the ancestral species and
A. hypogaea support this; we could not identify any large-scale
insertions. Consistent with previous findings
35, most newly inserted
elements are MUTATOR-like elements (Supplementary Fig. 28).
Inversions. Comparisons of Tifrunner subgenomes showed three
more major chromosome inversions than were observed when
comparing the sequenced accessions of the two ancestral diploid
species: two in the A subgenome, on Arahy.05 and Arahy.07, and
one in the B subgenome, on Arahy.11 (Supplementary Figs. 1, 5
and 8). We consider it likely that at least two of these three extra
inversions were already present in the diploid ancestors. The
alter-native chromosomal arrangement of Arahy.07 is indicated by a
genetic map derived from a cross of two different A. duranensis
accessions (see the genetic map of a previously published study
36,
which is presented relative to the sequenced genome of A. dura
-nensis V14167 in the supplementary dataset of another study
6).
Furthermore, significantly higher DNA identity between Arahy.07
and five A. duranensis accessions (including the closest ones to the
A subgenome ancestor; see below) is observed when compared to
others (Supplementary Tables 8 and 9). Similarly, for Arahy.05,
markedly higher identities to three A. duranensis accessions may
indicate the presence of the inversion in some representatives of
A. duranensis, possibly including the ancestral A subgenome donor
(Supplementary Table 8 and 9).
We previously reported that inversions move repeat-rich DNA
to more distal chromosome regions where DNA is lost by
recom-bination, thus reducing genome size (although regions moved
to more proximal positions gain DNA, this effect is smaller)
6,37.
Following this pattern, the inverted region in Arahy.05 has shrunk
relative to A. duranensis V14167 (tetraploid size/diploid size = 0.89;
Supplementary Table 10). We found that removal of LTR
retrotrans-posons is the predominant cause of this reduction (Supplementary
Fig. 29). Furthermore, the presence of repeats in A. duranensis, at
the ends of the regions, which are missing in A. hypogaea, clearly
implicate unequal intrastrand recombination in about 20% of cases
(107 out of 502 regions). By contrast, there is little difference in
rela-tive sizes of the inversions on Arahy.07 and Arahy.11.
Observations of independent polyploidy events. We used
allote-traploids derived by colchicine treatment of hybrids of the peanut’s
ancestral diploid species
38to investigate genome changes that
fol-lowed independent polyploidy events. We studied 37 different
lin-eages from two independent induced polyploidy events. Genetic
exchange between subgenomes occurred in large blocks and
inter-spersed alleles along chromosome segments; these events seem at
least partly stochastic, and were different between different lineages
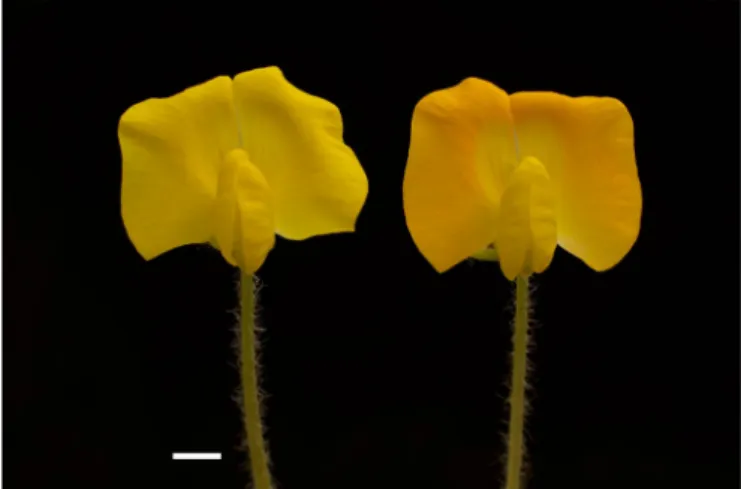
and from A. hypogaea. Spontaneous changes in flower color in some
lineages (Fig.
3
) could be ascribed to genetic exchange between
sub-genomes; the A genome region that confers the yellow flower color
had been replaced by the homeologous B genome region that
con-fers orange flower color (dataset 6 in ref.
25). This provides a simple
demonstration of phenotypic change as a consequence of genetic
exchange between subgenomes.
A closer representative of the A subgenome ancestor. Because
their seeds develop underground, wild Arachis populations are
unusually static over time
5. In addition, they typically have very
high rates of self-pollination. This, and a serendipitous collection by
pioneering botanical collectors, enabled our previous discovery that
the sequenced A. ipaensis K30076 was very likely a descendant of
the same population that donated the B subgenome to A. hypogaea
6.
Here we endeavored to identify the extant A. duranensis
popula-tion that is closest to the A subgenome donor. We characterized
55 accessions, representative of all known major populations of
A. duranensis, by sequencing DNA enriched for genic regions (using
exome capture methods). A selection of these accessions was
cho-sen for whole-genome re-sequencing. The A. duranensis accessions
that were most similar to the Tifrunner A subgenome were from
Rio Seco (Argentina), a location previously indicated as the likely
origin of the A subgenome ancestor on the basis of chloroplast and
ribosomal DNA haplotypes
39(Fig.
4
and Supplementary Tables 8, 9
and 11). However, in some cases, the ranking of similarity changed by
chromosome (especially for Arahy.05), possibly reflecting variations
in chromosomal arrangements in different accessions of A. duranensis
(as discussed above; Supplementary Table 9). Comparisons of the
Tifrunner A subgenome with the whole-genome sequences of
A. duranensis accessions indicated median DNA identities of 99.76%
for the Rio Seco accessions (KGBSPSc 30065, PI 468201 and KGBSPSc
30067, PI 468202); 99.61% for the sequenced V14167 (ref.
6);
and 98.23% for PI 475845 from the northern range of the species
and with a partially assembled genome
40(Supplementary Table 8
and Supplementary Fig. 30; dataset 7 in ref.
25).
Fig. 3 | Homeologous recombination generates diversity in early generation tetraploid hybrids derived from peanut’s ancestors. The initial allotetraploid, A. ipaensis × A. duranensis (2n = 4× = 40) has yellow flowers (left), as expected. However, after several generations some lineages spontaneously began to bear orange flowers (right). By genotyping, this could be assigned to homeologous recombination, where in alleles that confer yellow flowers (from A. duranensis) are replaced by alleles that confer orange flowers (from A. ipaensis; see dataset 6 in ref. 25).
The A subgenome chromosomes are, in general, less similar to
their A. duranensis counterparts than the B subgenome
chromo-somes are to their A. ipaensis counterparts. This is consistent with
the greater flow of alleles from the B subgenome into the A
sub-genome than vice versa (as described above, see also a previously
published study
6).
Discussion
A genome sequence is a landmark for the research of the biology of
a crop. It provides a catalog of gene content, with chromosomal
con-text and a unified framework for biological investigations and
cross-species comparisons. In the case of peanut, a polyploid of recent
hybrid origin, the previous sequencing of very close representatives
of its diploid ancestors provides the opportunity to investigate more
generally applicable principles regarding the genetics of polyploidy
and its importance to crop domestication.
Polyploidy has long been recognized as an important feature of
plant evolution; it has occurred multiple times during the evolution
of almost all flowering plants. Following each polyploidy event, over
tens of millions of years, deletions, divergence of duplicated genes
and rearrangements return the genome to a diploid state. The
recur-rence of these ‘wondrous cycles’ is thought to have played an
impor-tant part in diversification and adaptation during plant evolution
41–43.
It has also long been recognized that many crop plants are recent
polyploids; and, although the matter has generated decades of debate,
it does seem that polyploids are favored for domestication
1,2.
We consider the evidence that polyploid A. hypogaea was
favored for domestication over its diploid relatives very
persua-sive. Archaeological remains and remnant populations of Arachis
species far from their natural distributions, and the existence of a
diploid domesticated species (A. villosulicarpa) testify to
wide-spread and large-scale cultivation of at least four diploid species
(Supplementary Note 1). Indeed, the hybridization that gave rise
to A. hypogaea was only possible because of human transport of
A. ipaensis into the range of A. duranensis
6. It seems important that,
in spite of higher genetic diversity of the diploid species and their
cultivation having started earlier, it was—in fact—the allotetraploid
A. hypogaea that became the crop of worldwide importance.
Following trends seen in many plants, Arachis allotetraploids are
larger than their diploid progenitors. The tetraploids also have
differ-ent transpiration characteristics
44and produce more photosynthetic
pigments
45. These traits—or other ploidy-related changes—may
have been advantageous; however, contrary to common
expecta-tions, the seeds of the allotetraploid ancestor of peanut seem likely
to have been similar size to those of its diploid progenitors
45. The
increased number of alleles associated with being a ‘fixed hybrid’
would have increased heterosis and therefore probably
adaptabil-ity. However, the extreme genetic bottleneck that accompanied the
polyploid origin may have been expected to reduce variability on
which artificial selection could act. We investigated genome changes
after polyploidy that could have generated variation. We found no
evidence for widespread mobilization of transposable elements
(Supplementary Fig. 27). However, we could identify some mobile
element insertion polymorphisms and some of these are likely to
have influenced gene activity (Supplementary Fig. 28). In addition,
variable deletions, especially in proximal chromosome regions, have
occurred since polyploidy and these also must have generated
varia-tion. However, it was a different genetic phenomenon, associated
with harboring full chromosome complements from two species,
that most drew our attention: genetic exchange between
subge-nomes
3,6,15,16,26,28,29.
We identified two patterns of homeologous recombination.
One involves the transfer of chromosome segments between distal
collinear regions of chromosomes mostly resulting in tetrasomic
genome structures (AAAA and, to a lesser extent, BBBB; Figs.
1
and
2
and Supplementary Figs. 1–12, 25). The other involves transfer
of dispersed alleles that has occurred throughout the chromosomes;
it is strongly biased, with much more transfer of alleles from B
sub-genome to A subsub-genome (Supplementary Tables 6 and 7). Overall,
the genetic flux seems to have caused a greater erosion of
similar-ity of the A subgenome to its progenitor A. duranensis than of the
B subgenome to its progenitor A. ipaensis (even though the distal
regions of the B chromosomes are more invaded by segments of
the A genome than vice versa). Collections from Rio Seco were the
closest representatives of the A subgenome ancestor, although
sev-eral accessions from Salta (including the sequenced V14167 (ref.
6))
showed quite similar degrees of identity (Fig.
4
, Supplementary
Tables 8, 9 and 11 and Supplementary Fig. 30).
On the whole-genome scale, the effects of homeologous
recom-bination appear similar in diverse peanut accessions. Most of the
tet-rasomic structures were present in all A. hypogaea and A. monticola
analyzed; furthermore, fingerprint-like fine-scale patterns of
inter-spersed homeologous alleles within the distal tetrasomic regions
were also found to be uniform (Fig.
1
; datasets 4a and 5 in ref.
25).
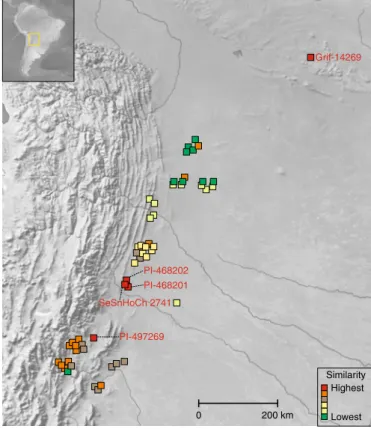
Grif-14269 PI-468202 PI-468201 PI-497269 SeSnHoCh 2741 Similarity Highest Lowest 0 200 km
Fig. 4 | Similarity of A. duranensis from different locations to the A subgenome of Tifrunner. Genomic DNAs of 55 accessions, representing all known major populations of A. duranensis, were compared to the A subgenome of Tifrunner. Similarity is strongly influenced by hydrographic basins. Accessions with the highest similarity (in red) are concentrated around Rio Seco, a tributary of the Rio San Francisco; next in similarity (in orange) are accessions concentrated around Jujuy, a region that drains into the Rio San Francisco and the Lerma valleys; followed by accessions from the Rio Juramento (in light brown), a region that receives water from the Lerma valley. Following these in similarity are accessions from the endorreic basins that occasionally drain in the Bermejo River (northwest Argentina and south Bolivia) (in yellow) followed by accessions in the basins of the Rio Pilcomayo (in light green) and finally accessions from the Rio Parapetí basin, Izozog Swamps and West Paraguay sand dunes (in dark green). Outliers to this general pattern are likely to represent populations that have resulted from the occasional human movement of seeds among basins (most of these movements are likely to have occurred long ago). The maps were generated using Natural Earth.
By contrast, homeologous recombination patterns in allotetraploid
hybrids were completely distinct (Fig.
1
; dataset 4a,b in ref.
25). This
emphasizes the close relationship of A. hypogaea and A. monti
-cola, and favors a single polyploid origin of both species. However,
when observed on a finer scale in other genome regions, it becomes
apparent that homeologous recombination in A. hypogaea has
gen-erated new diversity (Fig.
2
). Some tetrasomic regions differ in
dif-ferent accessions of A. hypogaea; in certain genome regions some
peanut accessions have an AAAA genome structure, whereas others
have BBBB (Fig.
2
and Supplementary Fig. 25). Our observation for
flower color, although a simple trait, provides a proof-of-principle
link between homeologous recombination and generation of
phe-notypic diversity (Fig.
3
; dataset 6 in ref.
25).
In summary, we determined the genome sequence of one
ref-erence peanut cultivar, and surveyed the genome structures of a
diverse sample of landraces and cultivars. The genome structure
of peanut is segmental allotetraploid (as defined by Stebbins
46). We
suggest that genetic deletions and exchange between the
subge-nomes generated variation that helped to favor the domestication
of A. hypogaea over its diploid relatives. These results highlight a
possible wider importance of these genetic mechanisms in
account-ing for the higher than expected frequency of polyploids in
domes-ticated plants.
Online content
Any methods, additional references, Nature Research reporting
summaries, source data, statements of code and data availability and
associated accession codes are available at
https://doi.org/10.1038/
s41588-019-0405-z
.
Received: 30 July 2018; Accepted: 28 March 2019;
Published online: 1 May 2019
References
1. Hilu, K. W. Polyploidy and the evolution of domesticated plants. Am. J. Bot.
80, 1494–1499 (1993).
2. Salman-Minkov, A., Sabath, N. & Mayrose, I. Whole-genome duplication as a key factor in crop domestication. Nat. Plants 2, 16115 (2016).
3. Husted, L. Cytological studies of the peanut Arachis. II. Chromosome number, morphology and behavior, and their application to the problem of the origin of the cultivated forms. Cytologia 7, 396–423 (1936).
4. Fernández, A. & Krapovickas, A. Cromosomas y evolución en Arachis (Leguminosae). Bonplandia 8, 187–220 (1994).
5. Krapovickas, A. & Gregory, W. C. Taxonomy of the genus Arachis (Leguminosae). Bonplandia 16, 1–205 (2007).
6. Bertioli, D. J. et al. The genome sequences of Arachis duranensis and
Arachis ipaensis, the diploid ancestors of cultivated peanut. Nat. Genet. 48,
438–446 (2016).
7. Kochert, G. et al. RFLP and cytogenetic evidence on the origin and evolution of allotetraploid domesticated peanut, Arachis hypogaea (Leguminosae). Am.
J. Bot. 83, 1282–1291 (1996).
8. Seijo, G. et al. Genomic relationships between the cultivated peanut (Arachis
hypogaea, Leguminosae) and its close relatives revealed by double GISH. Am. J. Bot. 94, 1963–1971 (2007).
9. Moretzsohn, M. C. et al. A study of the relationships of cultivated peanut (Arachis hypogaea) and its most closely related wild species using intron sequences and microsatellite markers. Ann. Bot. 111, 113–126 (2013). 10. Bertioli, D. J. et al. An overview of peanut and its wild relatives. Plant Genet.
Resour. 9, 134–149 (2011).
11. Krapovickas, A., Vanni, R. O., Pietrarelli, J. R., Williams, D. E. & Simpson, C. E. Las Razas de Maní de Bolivia. Bonplandia 18, 95–189 (2009).
12. Ramos, M. L. et al. Chromosomal and phylogenetic context for conglutin genes in Arachis based on genomic sequence. Mol. Genet. Genomics 275, 578–592 (2006).
13. Bertioli, D. J. et al. The repetitive component of the A genome of peanut (Arachis hypogaea) and its role in remodelling intergenic sequence space since its evolutionary divergence from the B genome. Ann. Bot 112, 545–559 (2013).
14. Nielen, S. et al. Matita, a new retroelement from peanut: characterization and evolutionary context in the light of the Arachis A–B genome divergence. Mol.
Genet. Genomics 287, 21–38 (2012).
15. Leal-Bertioli, S. et al. Tetrasomic recombination is surprisingly frequent in allotetraploid Arachis. Genetics 199, 1093–1105 (2015).
16. Clevenger, J. et al. Genome-wide SNP genotyping resolves signatures of selection and tetrasomic recombination in peanut. Mol. Plant 10, 309–322 (2017).
17. Nguepjop, J. R. et al. Evidence of genomic exchanges between homeologous chromosomes in a cross of peanut with newly synthetized allotetraploid hybrids. Front. Plant Sci. 7, 1635 (2016).
18. Leal-Bertioli, S. C. M. et al. Segmental allopolyploidy in action: increasing diversity through polyploid hybridization and homoeologous recombination.
Am. J. Bot. 105, 1053–1066 (2018).
19. Eid, J. et al. Real-time DNA sequencing from single polymerase molecules.
Science 323, 133–138 (2008).
20. Dudchenko, O. et al. De novo assembly of the Aedes aegypti genome using Hi-C yields chromosome-length scaffolds. Science 356, 92–95 (2017). 21. Lieberman-Aiden, E. et al. Comprehensive mapping of long-range
interactions reveals folding principles of the human genome. Science 326, 289–293 (2009).
22. Holbrook, C. C. & Culbreath, A. K. Registration of ‘Tifrunner’ peanut. J.
Plant Regist. 1, 124 (2007).
23. Samoluk, S. S., Chalup, L., Robledo, G. & Seijo, J. G. Genome sizes in diploid and allopolyploid Arachis L. species (section Arachis). Genet. Resour. Crop
Evol. 62, 747–763 (2015).
24. Dhillon, S. S., Rake, A. V. & Miksche, J. P. Reassociation kinetics and cytophotometric characterization of peanut (Arachis hypogaea L.) DNA. Plant
Physiol. 65, 1121–1127 (1980).
25. Bertioli, D. Supplementary material for "The genome sequence of segmental allotetraploid peanut Arachis hypogaea". CyVerse Data Commons https://doi.
org/10.25739/hb5x-wx74 (2019).
26. Chalhoub, B. et al. Early allopolyploid evolution in the post-Neolithic Brassica
napus oilseed genome. Science 345, 950–953 (2014).
27. Zhang, T. et al. Sequencing of allotetraploid cotton (Gossypium hirsutum L. acc. TM-1) provides a resource for fiber improvement. Nat. Biotechnol. 33, 531–537 (2015).
28. Gaeta, R. T. & Pires, C. J. Homoeologous recombination in allopolyploids: the polyploid ratchet. New Phytol. 186, 18–28 (2010).
29. Hurgobin, B. et al. Homoeologous exchange is a major cause of gene presence/absence variation in the amphidiploid Brassica napus. Plant
Biotechnol. J. 16, 1265–1274 (2018).
30. Robledo, G., Lavia, G. I. & Seijo, G. Species relations among wild Arachis species with the A genome as revealed by FISH mapping of rDNA loci and heterochromatin detection. Theor. Appl. Genet. 118, 1295–1307 (2009). 31. Robledo, G. & Seijo, G. Species relationships among the wild B genome of
Arachis species (section Arachis) based on FISH mapping of rDNA loci and
heterochromatin detection: a new proposal for genome arrangement. Theor.
Appl. Genet. 121, 1033–1046 (2010).
32. Moretzsohn, M. C. et al. A linkage map for the B-genome of Arachis (Fabaceae) and its synteny to the A-genome. BMC Plant Biol. 9, 40 (2009). 33. Levinson, G. & Gutman, G. A. Slipped-strand mispairing: a major
mechanism for DNA sequence evolution. Mol. Biol. Evol. 4, 203–221 (1987). 34. Lanciano, S. et al. Sequencing the extrachromosomal circular mobilome
reveals retrotransposon activity in plants. PLoS Genet. 13, e1006630 (2017). 35. Shirasawa, K. et al. Characterization of active miniature inverted-repeat
transposable elements in the peanut genome. Theor. Appl. Genet. 124, 1429–1438 (2012).
36. Nagy, E. D. et al. A high-density genetic map of Arachis duranensis, a diploid ancestor of cultivated peanut. BMC Genomics 13, 469 (2012).
37. Ren, L., Huang, W., Cannon, E. K. S., Bertioli, D. J. & Cannon, S. B. A mechanism for genome size reduction following genomic rearrangements.
Front. Genet. 19, 454 (2018).
38. Fávero, A. P., Simpson, C. E., Valls, F. M. J. & Velo, N. A. Study of evolution of cultivated peanut through crossability studies among Arachis ipaensis, A.
duranensis and A. hypogaea. Crop Sci. 46, 1546–1552 (2006).
39. Grabiele, M., Chalup, L., Robledo, G. & Seijo, G. Genetic and geographic origin of domesticated peanut as evidenced by 5S rDNA and chloroplast DNA sequences. Plant Syst. Evol. 298, 1151–1165 (2012).
40. Chen, X. et al. Draft genome of the peanut A-genome progenitor (Arachis
duranensis) provides insights into geocarpy, oil biosynthesis, and allergens. Proc. Natl Acad. Sci. USA 113, 6785–6790 (2016).
41. Blanc, G. & Wolfe, K. H. Widespread paleopolyploidy in model plant species inferred from age distributions of duplicate genes. Plant Cell 16, 1667–1678 (2004).
42. Soltis, D. E., Soltis, P. S. & Tate, J. A. Advances in the study of polyploidy since plant speciation. New Phytol. 161, 173–191 (2004).
43. Wendel, J. F. The wondrous cycles of polyploidy in plants. Am. J. Bot. 102, 1753–1756 (2015).
44. Leal-Bertioli, S. C. et al. The effect of tetraploidization of wild Arachis on leaf morphology and other drought-related traits. Environ. and Exp. Bot
45. Leal‐Bertioli, S. C. et al. Phenotypic effects of allotetraploidization of wild
Arachis and their implications for peanut domestication. Am. J. Bot. 104,
379–388 (2017).
46. Stebbins, G. L. Types of polyploids: their classification and significance. Adv.
Genet. 1, 403–429 (1947).
Acknowledgements
We thank G. Birdsong, V. Nwosu, J. Elder, D. Smyth, H. Valentine, F. Luo, D. Hoisington, H. Shapiro, D. Ward, S. Knapp, R. Wilson and S. Brown for their support of, and work for, the Peanut Genome Initiative. Major financial contributors for this work were from Mars-Wrigley Confectionary, US peanut sheller associations, the National Peanut Board and other industry groups. A full list can be downloaded at https://peanutbase.org/IPGI. D.J.B. thanks the Georgia Peanut Commission and the Georgia Research Alliance for support. The genome sequencing was funded from grant 04-852-14 from The Peanut Foundation to J.S. and B.E.S., characterization of diverse genotypes was funded from grant 04-805-17 to D.J.B. The work conducted by the US Department of Energy Joint Genome Institute is supported by the Office of Science of the US Department of Energy under contract number DE-AC02-05CH11231. The work done at the DNA Technologies and Expression Analysis Cores at the UC Davis Genome Center was supported by NIH Shared Instrumentation Grant 1S10OD010786-01. We thank the US National Science Foundation for support from grant number 1339194 to S.A.J. This research was funded in part by the US Department of Agriculture Agricultural Research Service, projects 5030-21000-069-00-D, 6048-21000-028-00-D, 6048-21000-029-00-D, 6066-21310-005-00-D and NIFA Award no. 2018-67013-28139. We also grateful for funding granted to X.Z. and Z.Z. from the Henan Province Open Cooperation Project of Science and Technology (172106000007), the Henan Science and Technology Major Project of the Ministry of Science and Technology of China (161100111000), the China Agriculture Research System (CARS-13), and Henan Agriculture Research System (S2012-5). We thank the Indian Council of Agricultural Research, National Agricultural Science Funds, Government of India and the CGIAR Research Program on Grain Legumes and Dryland Cereals for grants to R.K.V. and M.K.P. ICRISAT is a member of the CGIAR. S.S. was supported by the Ramalingwaswami Re-entry Grant (BT/RLF/Re-entry/41/2013) from the Ministry of Science and Technology, India. We thank D. Kudrna at the University of Arizona for high-molecular-weight DNA extractions, S. Simpson of USDA ARS GBRU for valuable support with PacBio sequencing and the USDA National Plant Germplasm System for Arachis seeds.
Author contributions
Project planning and coordination: J.S., S.A.J., B.E.S., S.B.C., P.O.-A., D.J.B., C.C.H., J.G., E.K.S.C., R.K.V., R.M., S.C.M.L.-B., L.F. and A.D.F. Production of base genetic material (including mapping populations and allotetraploid hybrids): C.C.H., Y.C., P.O.-A., S.C.M.L.-B., D.J.B. and M.C.M. Tifrunner genome sequencing (including BACs and
quality control): J.J., A.S., J.S., J.G. and B.E.S. Hi-C libraries and sequencing: O.D., C.G.L., M.K.P. and E.L.A. Genome assembly: J.J., J.S., O.D. and D.J.B. Transcriptome assembly, gene, mobile element and repeat annotation: D.G., J. Campbell, C. Cameron, S.D., A.D.F., N.T.W., P.O.-A., D.J.B. and S.A.J. Comparison of gene expression in subgenomes: A.S. and J.S. Extra chromosomal circular DNAs: M.M. and S.L. Small RNAs and methylation: K.D.K., J.H.S., M.E.B., S.A.J., S.C.M.L.-B. and D.J.B. Structural analysis of Tifrunner genome: L.R., S.B.C., E.K.S.C., D.G., D.J.B., J. Clevenger and B.A. Data preparation and data basing, visualizations and expression analysis: S.B.C., E.K.S.C. and W.H. Genotyping and linkage mapping: C.B.-T., C. Chavarro, Y.C., J. Clevenger, S.C.M.L.-B., G.A., B.G., P.O.-A., S.A.J. and D.J.B. Analysis of homeologous recombination: B.A., J. Clevenger, S.C.M.L.-B. and D.J.B. Diverse tetraploid samples and data: S.C.M.L.-B., X.Z., Z.Z., Z.S., A.C., M.K.P., R.K.V., K.S., P.O.-A., S.A.J. D.J.B. and C. Chavarro. Analysis of variations in tetraploid genome structure: B.A., J. Clevenger, W.K. and D.J.B. Curation and sequencing of A. duranensis accessions: S.S.S., G.S., S.C.M.L.-B. and D.J.B. Exome capture and analysis: L.F., R.M., S.S., S.S.S., G.S., J. Clevenger, S.C.M.L.-B. and D.J.B. Biogeography: G.S., S.S.S. and D.J.B. Manuscript: D.J.B., G.S., S.B.C, M.M., J.J., P.O.-A., J. Campbell, J. Clevenger, S.C.M.L.-B, R.M., D.G., M.E., S.S.S., L.R. and S.A.J.
Competing interests
The authors declare no competing interests.
Additional information
Supplementary information is available for this paper at https://doi.org/10.1038/ s41588-019-0405-z.
Reprints and permissions information is available at www.nature.com/reprints. Correspondence and requests for materials should be addressed to D.J.B., S.A.J. or J.S. Publisher’s note: Springer Nature remains neutral with regard to jurisdictional claims in published maps and institutional affiliations.
© The Author(s), under exclusive licence to Springer Nature America, Inc. 2019 Open Access This article is licensed under a Creative Commons Attribution 4.0 International License, which permits use, sharing, adap-tation, distribution and reproduction in any medium or format, as long as you give appropriate credit to the original author(s) and the source, provide a link to the Creative Commons license, and indicate if changes were made. The images or other third party material in this article are included in the article’s Creative Commons license, unless indicated otherwise in a credit line to the material. If material is not included in the article’s Creative Commons license and your intended use is not permitted by statu-tory regulation or exceeds the permitted use, you will need to obtain permission directly from the copyright holder. To view a copy of this license, visit http://creativecommons. org/licenses/by/4.0/.