HAL Id: hal-01005063
https://hal.archives-ouvertes.fr/hal-01005063
Submitted on 11 Jun 2014
HAL is a multi-disciplinary open access
archive for the deposit and dissemination of sci-entific research documents, whether they are pub-lished or not. The documents may come from teaching and research institutions in France or abroad, or from public or private research centers.
L’archive ouverte pluridisciplinaire HAL, est destinée au dépôt et à la diffusion de documents scientifiques de niveau recherche, publiés ou non, émanant des établissements d’enseignement et de recherche français ou étrangers, des laboratoires publics ou privés.
How to assign a value to soil sustainability? An example
based on water erosion modeling
Frédéric Darboux, Jean-Baptiste Paroissien, Alain Couturier, Benoît Devillers,
Joël Daroussin, Yves Le Bissonnais, Damien Raclot
To cite this version:
Frédéric Darboux, Jean-Baptiste Paroissien, Alain Couturier, Benoît Devillers, Joël Daroussin, et al.. How to assign a value to soil sustainability? An example based on water erosion modeling. Land-Con1010: International Conference on Combating Land Degradation in Agricultural Areas, institute of soil and water conservation, CAS (ISWC - CAS). Shaanxi, CHN. Chinese Academy of Sciences (CAS), CHN. Ministry of Water Resources (MWR)., Oct 2010, Xi’an, Shaanxi, China. �hal-01005063�
How to assign a value to soil sustainability? An
example based on water erosion modeling.
Frédéric DARBOUX1, Jean-Baptiste PAROISSIEN1, Alain COUTURIER1, Benoît DEVILLERS1,
Joël DAROUSSIN1
, Yves LE BISSONNAIS2
, Damien RACLOT3
1 National Institute for Agronomical Research (INRA), UR 0272 Science du sol, Centre de recherche d'Orléans, CS 40001, F-45075 Orléans Cedex 2, France
2 National Institute for Agronomical Research (INRA), LISAH, Campus AGRO, Bât. 24, 2 place Viala, F-34060 Montpellier Cedex 1, France
3 Research Institute for Development (IRD), LISAH, Centre IRD TUNIS, 5 impasse Chehrazade, Menzah 4, BP 434, 1004 Tunis, Tunisia
Abstract: Water erosion is a major threat to soil
sustainability. In the context of global change, erosion intensity could be dramatically increased, hence decreasing the capability of soils to sustain agriculture. We evaluated soil sustainability to water erosion in a watershed (about 100 km2) located in Southern France. Spatial pattern of soil
erosion was assessed using the STREAM model. The CLUE model was used for land-use change scenarios. Results show soil sustainability can be dramatically affected by decisions about watershed management. Results also show a large spatial variability of soil sustainability inside the watersheds, with small areas of low sustainability. As a consequence, targeted decisions should be more efficient than general policies. Usually, soil sustainability to water erosion is gauged through erosion rates (T.ha-1
.y-1
) or changes in soil thickness (mm/y). However, because life expectancy is a familiar concept, it can be understood easily by non-specialists, such as decision-makers. Life expectancy of soils thus appears to be a valuable indicator of soil sustainability.
Keywords: soil sustainability, water erosion, modeling, life
expectancy
I. INTRODUCTION
Soil erosion is an example of natural phenomenon that can be greatly accelerated by the global change but that can also be mitigated by better practices. In order to setup environmental and land use management plans, many methods have been developed for assessing soil erosion: soil erosion hazard which refers to the probability of the soil erosion phenomena and the soil erosion risk which requires a combination between the soil vulnerability and the soil erosion hazard [1]. Hazard maps are produced at different scales [2, 3, 4] and based on empirical and expert model as RUSLE and MESALES [3]. Most of studies use indicators of soil erosion such as soil erosion rate (expressed T.ha-1
.y-1
)
or changes in soil thickness (mm/y). However, more advanced concepts have been proposed, such as soil loss tolerance [5] and soil life time for an agricultural production [6]. These two concepts use the vulnerability of the soil production capacity to assess the soil erosion risk, the soil being considered as an economical resource. Nevertheless, some of basic soil functions can be depleted, or destroyed due to an increase in soil erosion [7] (e.g., soil fertility, soil structure, carbon storage…), limiting future developments of human activities. Thus, it appears important to assess the soil erosion risk by considering the soil as a patrimonial resource for future generation. For such purpose the concept of Safe Minimum Standards and Environmental Minimum Requirements [8] may be better suited. Soil erosion risk can be taken into account in the assessments of environmental problems [9, 10]. They used the soil regeneration capacity to define the Environmental Minimum Requirements for soil erosion.
The aim of this paper is to develop and apply a method to evaluate soil erosion risk. It is applied in a catchment located in the South-East of France. It uses two models, one to generate land-use change scenarios and one to assess consequences for soil sustainability to soil erosion. It shows the concept of life expectancy of soil is a valuable indicator of soil sustainability, both for soil specialists and decision makers.
II. MATERIAL AND METHODS
Study catchment
The study catchment is located in the South-East of France, close to the Mediterranean sea. The catchment is along the Peyne river. The valley covers an area of about 75 km2
, encompassing two contrasted zones: The northern part of the Peyne catchment is hilly and consists of Palaeozoic rocks covered by lithosols (0 to 30 cm deep). Land use is
mostly shrubs with few arable lands. The southern part is made of small hills consisting of Neogene formations covered by deeper soils (> 80 cm) classified as Fluvisols, Calcisols and Brunisols. Land use is vines (75%) and cereals (20%). The climate is Mediterranean sub-humid with a long dry summer season. The average annual temperature is 14°C and annual rainfall varies between 500 and 1400 mm, showing a bimodal temporal distribution with two major rainy periods, one in spring and another in autumn. Storms with high rainfall intensity may occur in summer.
Materials and Methods
Map of current land use
The land use map was established by using air photo interpretation of IGN (National Institute of Geography) orthophotographies taken in the spring 2005. The land use classes differentiate the vine (vine and orchard), the arable land, the forest (grouping abandonment land, scrubland and pine forest), and urban areas (road network, natural and artificial hydrological network, villages). The cultural practices of the vineyard are added owing to their important impacts on the soil surface characteristics on water erosion. The main cultural practices are (i) chemical weeding (62.5%), (ii) mechanical weeding (27.5%) and (iii) permanent intercrop (10%) [11]. These practices are attributed randomly on vine-classed areas.
Scenarios of land use change with CLUE-s
Land use changes are simulated with the CLUE-s (“Conversion of Land-Use and its Effects”) model [12, 13]. The model is based on an empirical analysis created by the user who specifies the relations between the spatial distribution of land use and a series of factors that drive and constrain land use (e.g. slope, distance to a river). In addition, a set of function is specified by the user to address a hierarchic organization of land use change, a spatial connectivity between the destinations of land use change and stability to the change of certain land use type. It enabled to generate land use map for future scenarios. These scenarios were design to encompass possible changes and were established under the general basis of the work of Kok
et al. [14]. These general scenarios allow positioning the
evolutions of land use in a global context linked to economical, social and climatic context of the region. Four land use change scenarios are considered : (i) Accentuation. This scenario is similar to the scenario
Convulsive Changes of Kok et al. It expresses a irreversible
climate change acceleration with the formation of permanent desert in the South of Europe. Rainfed agricultures decreases sharply and cultural practices of viticulture are more and more linked to the chemical weeding to compensate the hydric and nitrogenous impact
of weeds.
(ii) Production. This scenario is based on the scenario Big is
Beautiful of Kok et al. It transcribes an increase in market
liberalization. This causes an increase competition of agriculture with a severe impact on smaller farmers,
wine-growers and forest.
(iii) Protection. This scenario is based on the scenario
Knowledge is King of Kok et al. It marks a rapid increase in
the importance of information and communication technologies and large developments in techniques (e.g., water desalination techniques, high-yielding crop varieties). In this context, cultural practices respectful to the environment develop and forests are protected. (iv) Environmental law. Close to the Protection scenario, it is based on the use of law to enforce the use of permanent intercrop by farmers in vineyards.
Modeling soil erosion with STREAM
The STREAM model (Sealing and Transfer by Runoff and Erosion related to Agricultural Management) is used to model soil erosion by water. It is a non dynamic model that uses a raster-based distributed approach to calculate total runoff volume and soil erosion for a given rainfall event [15]. This expert-based model assumes that the main factors of runoff and infiltration at the field scale are the surface characteristics: soil crusting, surface roughness, total cover and moisture content. For each combination of surface characteristics an infiltration rate is attributed. The flow network is obtained from a digital elevation model. The soil erosion is simulated by two dedicated modules: The module for sheet erosion relies on a table assigning a sediment concentration according to the soil surface characteristics. This module takes into account the sediment deposit. The module for rill erosion, based on the slope value and parameters affecting flow velocity and soil resistance (vegetation type, vegetable cover, surface roughness, soil crusting). In this module, the sediment deposit is not taken accounted for.
The main results are maps of soil erosion rate (expressed in T.ha-1
.y-1
). 9 years of rainfalls are simulated and an average map of soil erosion rate is computed for each scenario. Results are aggregated at the scale of a several fields to avoid over-interpretation that may result from pixel map. This leads to maps consisting of polygons. Considering that polygon containing large erosion rates should be put forward, the 9th
decile of soil erosion rate is considered.
Map of life expectancy of soils
The soil erosion risk is estimated through the life expectancy of soils and calculated using the soil erosion rate map, the soil depth map and the soil bulk density map:
Ser
Sbd
Sd
SLE
=
with Sd the soil depth (m), Ser the soil erosion rate (T.ha-1
.y-1
), Sb the soil bulk density (kg.m-3
) and SLE the soil life expectancy (y). Soil production is not accounted for because of too much uncertainty on this variable. One map of soil life expectancy is computed for each scenario. It represents the amount of time remaining before the soil completely disappears. Thus, it is a reasonable proxy for estimating long-term erosion impact [6] from a patrimonial point of view. As for maps of soil erosion rates, results are aggregated at the scale of several fields. For the same reasons, the first decile of life expectancy is considered. Results are aggregated at the scale of a several fields to avoid over-interpretation that may result from pixel map. This leads to a map consisting on polygons. Considering that polygon containing large erosion rates should be put forward, the 9th decile of soil life expectancy is plotted.
III. RESULTS AND DISCUSSION
Scenarios of land use change
The four scenarios give contrasted results in term of land use (fig. 1), even if the main features of the watershed are preserved. Specifically, the Northern part remains mostly with forests while the Southern part remains predominantly with agriculture.
FIGURE 1: CURRENT LANDUSE AND SCENARIOS OF FUTURE LANDUSES
Soil erosion rates
In the current situation, the highest soil erosion rates are encountered in the Southern area (fig. 2): the highest soil erosion rates are scattered among soil erosion rates of 3-5 T.ha-1
.y-1
. In this Southern part, some areas with erosion
rates lower than 3 T.ha-1
.y-1
exists. An opposite situation is encountered in the northern area, with a few large erosion rate areas scattered among a large area with low erosion rates. The scenario Production does not alter much this spatial pattern. On the contrary, the scenario Accentuation increases the surface area with high erosion rates. Both the scenarios Protection and Environmental law cause a decrease in soil erosion rates, but this decline is much sharper for the scenario Environmental law. Using soil erosion rates as a index of soil sustainability, it looks like the scenario Environmental law is able to alleviate all the erosion problems in the watershed.
FIGURE 2: SOIL EROSION RATES FOR CURRENT LANDUSE AND SCENARIOS OF FUTURE LANDUSES
Life expectancy of soils
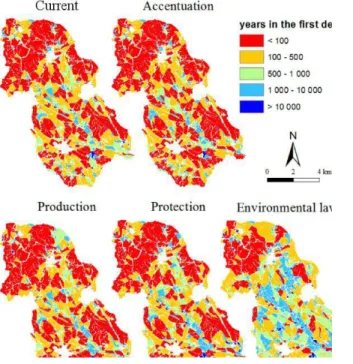
When concerned with life expectancy (fig. 3), the current situation looks rather alarming, with large areas having life expectancy lower than 100 years. It must be noticed that the Northern part has low life expectancies. This result contrasts with its low erosion rates (comparison of fig. 2 and 3). This is explained by the shallow soils encountered in this area of the watershed. The scenarios Accentuation, Production and
Protection do not give results very different from the
current situation. Soil sustainability is lower than 100 years in most of the watershed whatever the scenarios. Only the scenario Environmental law appears different, with a noticeable increase in life expectancy in the Southern part of the area. This scenario is the only one enabling a more sustainable soil management.
To assert sustainability of soils concerned with water erosion, the use of soil erosion rate can be misleading because it does not account for the soil thickness. Hence, life expectancy is a better index of soil sustainability from a scientific point of view. Moreover, soil erosion rate is difficult to grasp by non-specialists such as decision-makers. Because the concept of life expectancy is part of the regular knowledge, and expressed directly in years, its use should not lead to misunderstanding by decision-makers.
FIGURE 3: SOIL LIFE EXPECTANCYFOR CURRENT LANDUSE AND SCENARIOS OF FUTURE LANDUSES
IV. CONCLUSIONS
The method presented here allows assessing soil erosion risk caused by global change. The coupling between STREAM model and CLUE-s model allows the analysis of the effect of land use change on the soil erosion. The method asserts soil sustainability with a patrimonial point of view by using life expectancy as an index of soil sustainability. For this purpose, life expectancy appears better suited that soil erosion rate. Applied on a watershed located in France as a test-case, the method can be used in other countries.
ACKNOWLEDGMENT
This study is part of the ANR - MESOEROS21 project, granted by the French National Agency for Research.
Authors are grateful to the LAD group of Wageningen
University for making CLUE-s available to them. REFERENCES
[1] Taubenböck, H., Post, J., Roth, A., Zosseder, K., Strunz, G., Dech, S., 2008. A conceptual vulnerability and risk framework as outline to identify capabilities of remote sensing. Natural Hazards and Earth System Science 8 (3), 409–420.
[2] Renschler, C. S., Mannaerts, C., Diekkrüger, B., Feb. 1999. Evaluating spatial and temporal variability in soil erosion risk–rainfall erosivity and soil loss ratios in andalusia, spain. CATENA 34 (3-4), 209–225.
[3] Le Bissonnais, Y., Montier, C., Jamagne, M., Daroussin, j., King, D., Jan. 2001. Mapping erosion risk for cultivated soil in France. Catena 46 (2-3), 207–220.
[4] van Rompaey, A., Bazzoffi, P., Jones, R., Montanarella, L., Govers, G., 2003. Validation of soil erosion risk assessments in Italy. Tech. Rep. 12, European Soil Bureau Research Report, Office for Official Publications of the European Communities, Luxembourg.
[5] Stamey, W., Smith, R., 1964. A concervation definition of erosion tolerance. Soil Sciences 97, 183–186.
[6] Sparovek, G., Schnug, E., 2001. Temporal erosion-induced soil degradation and yield loss. Soil Science Society of American Journal 65 (5), 1479–1486.
[7] Lal, R., Jul. 2003. Soil erosion and the global carbon budget. Environment International 29 (4), 437–450.
[8] Bastian, O., Corti, C., Lebboroni, M., 2007. Determining environmental minimum requirements for functions provided by agro-ecosystems. Agron. Sustain. Dev. 27 (4), 279–291.
[9] Bazzoffi, P., 2009. Soil erosion tolerance and water runoff control: minimum environmental standards. Regional Environmental Change 9, 169–179.
[10] Neumann, B., Lütz, M., Schüpbach, B., Szerencsits, E., 2009. Spatial modelling for the development of agrienvironmental programs. Regional Environmental Change 9 (3), 197–207.
[11] Biarnès, A., Rio, P., Hocheux, A., 2004. Analyzing the determinants of spatial distribution of weed control practices in a languedoc vineyard catchment. Agronomie 24, 187–196.
[12] Veldkamp, A., Fresco, L. O., Nov. 1996. Clue-cr : An integrated multi-scale model to simulate land use change scenarios in costa rica. Ecological Modelling 91 (1-3), 231–248.
[13] Verburg, P., Veldkamp, W., Espaldon, R., Mastura, S., 2002. Modeling the spatial dynamics of regional land use: The clue-s model. Environmental Management 30, 391–405.
[14] Kok, K., Rothman, D., Patel, M., Apr. 2006. Multi-scale narratives from an ia perspective : Part i. european and Mediterranean scenario development. Futures 38 (3), 261–284.
[15] Souchère, V., Cerdan, O., Dubreuil, N., Le Bissonnais, Y., King, C., Jun. 2005. Modelling the impact of agrienvironmental scenarios on runoff in a cultivated catchment (normandy, france). CATENA 61 (2-3), 229–240.