HAL Id: cea-01588291
https://hal-cea.archives-ouvertes.fr/cea-01588291
Preprint submitted on 15 Sep 2017
HAL is a multi-disciplinary open access
archive for the deposit and dissemination of
sci-entific research documents, whether they are
pub-lished or not. The documents may come from
teaching and research institutions in France or
abroad, or from public or private research centers.
L’archive ouverte pluridisciplinaire HAL, est
destinée au dépôt et à la diffusion de documents
scientifiques de niveau recherche, publiés ou non,
émanant des établissements d’enseignement et de
recherche français ou étrangers, des laboratoires
publics ou privés.
Photospheric activity of the Sun with VIRGO and
GOLF Comparison with standard activity proxies
David Salabert, Rafaël García, A Jiménez, L Bertello, E Corsaro, P Pallé
To cite this version:
David Salabert, Rafaël García, A Jiménez, L Bertello, E Corsaro, et al.. Photospheric activity of the
Sun with VIRGO and GOLF Comparison with standard activity proxies. 2017. �cea-01588291�
Astronomy& Astrophysics manuscript no. ms_accepted ©ESO 2017 September 15, 2017
Photospheric activity of the Sun with VIRGO and GOLF
Comparison with standard activity proxies
D. Salabert
1, 2, R. A. García
1, 2, A. Jiménez
3, 4, L. Bertello
5, E. Corsaro
1, 2, 3, 4, 6, and P. L. Pallé
3, 41 IRFU, CEA, Université Paris-Saclay, F-91191 Gif-sur-Yvette, France
e-mail: david.salabert@cea.fr
2 Université Paris Diderot, AIM, Sorbonne Paris Cité, CEA, CNRS, F-91191 Gif-sur-Yvette, France 3 Instituto de Astrofísica de Canarias, E-38200 La Laguna, Tenerife, Spain
4 Departamento de Astrofísica, Universidad de La Laguna, E-38205 La Laguna, Tenerife, Spain 5 National Solar Observatory, 3665 Discovery Drive, Boulder, CO 80303, USA
6 INAF - Observatorio Astrofisico di Catania, Via S. Sofia 78, I-95123 Catania, Italy
Received XXXXX; accepted XXXXX
ABSTRACT
We study the variability of solar activity using new photospheric proxies originally developed for the analysis of stellar magnetism with the CoRoT and Kepler photometric observations. These proxies are obtained by tracking the temporal modulations in the observations associated to the spots and magnetic features as the Sun rotates. We analyze here 21 years, spanning solar cycles 23 and 24, of the observations collected by the space-based photometric VIRGO and radial velocity GOLF instruments on board the SoHO satellite. The photospheric activity proxy Sphis then calculated for each of the three VIRGO photometers as well as the associated Svelproxy
from the radial velocity GOLF observations. Comparisons with several standard solar activity proxies sensitive to different layers of the Sun demonstrate that these new activity proxies, Sphand Svel, provide a new manner to monitor solar activity. We show that
both the long- and short-term magnetic variabilities respectively associated to the 11-year cycle and the quasi-biennial oscillation are well monitored, and that the magnetic field interaction between the subsurface, the photosphere, and the chromosphere of the Sun, was modified between Cycle 24 and Cycle 23. Furthermore, the photometric proxies show a wavelength dependence of the response function of the solar photosphere among the three channels of the VIRGO photometers, providing inputs for the study of the stellar magnetism of Sun-like stars.
Key words. Sun: activity – Methods: observational
1. Introduction
The space-based, Sun-as-a-star Variability of Solar Irradiance and Gravity Oscillations (VIRGO; Fröhlich et al. 1995) and Global Oscillations at Low Frequency (GOLF; Gabriel et al. 1995) instruments on board the Solar and Heliospheric Obser-vatory (SoHO; Domingo et al. 1995) satellite were designed to study the internal structure and rotation of the Sun by measur-ing the low-degree oscillations over the entire disc in intensity and radial velocity, respectively (e.g., in the following early ref-erences Turck-Chièze et al. 1997; Fröhlich et al. 1997). The first reliable signatures of the existence of gravity modes in the Sun (and by consequence in Sun-like stars) were also detected with the GOLF instrument (García et al. 2007; Fossat et al. 2017). Moreover, by adding three polarizing elements at the entrance of the instrument, GOLF was able to measure the two circular polarized components of the solar light and thus to estimate the solar mean magnetic field (SMMF). Unfortunately, due to a mal-function of the motors moving the polarizers, only 26 days of SMMF observations were acquired. From those observations, an average value of 0.120 ± 0.002 G was determined (García et al. 1999).
Long and continuous helioseismic observations offer a unique opportunity to monitor and study solar activity at dif-ferent temporal scales. The response of the acoustic oscillations to solar activity, through the variability of the eigenfrequencies,
was proven to provide insights on the structural and magnetic changes in the sub-surface layers of the Sun along the solar cy-cle (see Basu et al. 2012; Salabert et al. 2015, and references therein). However, while the frequency shifts varied with very high levels of correlation with surface activity over the last three solar cycles 21, 22, and 23 (Chaplin et al. 2007), significant dif-ferences were observed between frequency shifts and solar ac-tivity during the unusual long and deep minimum of Cycle 23 (Salabert et al. 2009; Tripathy et al. 2010) related to magneti-cally weaker shallow layers of the Sun. In addition, a faster tem-poral modulation of the acoustic frequency shifts with a period of about two years was also observed (Fletcher et al. 2010). This quasi-biennial oscillation (QBO) is measured in various activ-ity proxies (see e.g., Bazilevskaya et al. 2015, and references therein), and is characterized by intermittence in periodicity and with amplitudes that vary with time, being largest at solar max-imum. In addition, the other acoustic parameters, like the mode powers and lifetimes, were also observed to vary with magnetic activity in relation with the 11-year solar cycle (Chaplin et al. 2000; Salabert et al. 2003).
Space-based photometric and radial velocity helioseismic observations provide an unexplored way yet to monitor solar ac-tivity. In the stellar context, García et al. (2010) showed, in the case of the F-star HD 49933 observed with the Convection, Ro-tation, and planetary Transits (CoRoT; Baglin et al. 2006) space telescope, that the fluctuations associated to the presence of spots
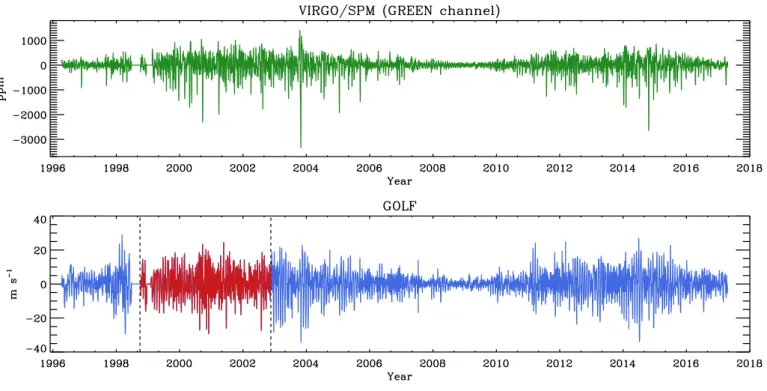
Fig. 1. 21 years of space-based observations of the Sun collected by the photometric VIRGO/SPM (top panel, here the green channel) and the radial velocity GOLF (bottom panel) instruments on board the SoHO satellite between 1996 April 11 and 2017 April 11. The missing data shown at zero between the years 1998 and 1999 correspond to the two temporary losses of SoHO. The GOLF red-wing period from mid 1998 to end 2002, denoted by the two vertical dashed lines, is represented in red (see Section 2).
or magnetic features rotating on the surface of the star can be analyzed to derive a global proxy of stellar magnetic activity. Nevertheless, as the variability in the data can have different ori-gins with various timescales, such as convective motions, oscil-lations, stellar companion, or instrumental problems, the rotation period of the star needs to be taken into account in calculating such a magnetic activity proxy. Mathur et al. (2014a) demon-strated that the measured fluctuations estimated as the standard deviations calculated over sub series of length 5×Prot, where Prot
is the rotation period of the star in days, provide a global proxy only related to magnetism. It is referred since then to the so-called photospheric activity proxy Sph. Initially developed to be
applied to the photometric observations collected by the Kepler (Borucki et al. 2010) and CoRoT satellites to study the signature of stellar magnetic activity of main-sequence stars (García et al. 2014; Mathur et al. 2014b; Ferreira Lopes et al. 2015; Salabert et al. 2017), the Sph proxy was used to show that the activity
of seismic solar analogs is comparable to the Sun, within the maximum-to-minimum temporal variations of the 11-year so-lar cycle (Salabert et al. 2016). Moreover, Salabert et al. (2016) show the complementarity between the solar photospheric Sph
proxy and the chromospheric activity such as the Ca K-line emis-sion index. Furthemore, the photospheric Sphproxy can be easily
estimated for a large number of stars with known rotation period from space photometric observations, unlike the standard chro-mospheric S index (Wilson 1978) whose estimation requires a lot of time of ground-based telescopes to collect enough spec-troscopic data for each individual bright target only. We note that the Sph index is dependent on the inclination angle of the
rotation axis in respect to the line of sight and thus provides a lower limit of stellar activity, assuming that the starspots are formed over comparable ranges of latitude as in the Sun. Never-theless, if the distribution of the spin orientation in space is
ran-dom, then the most observed inclination angle would be close to 90◦, hence perpendicular to the line of sight (see Corsaro et al. 2017). This implies, assuming this hypothesis is verified, that the Sph index thus measured represents then the actual level of
activity for most of the stars and not a lower limit.
In this work, we analyzed 21 years of the space photomet-ric VIRGO and radial velocity GOLF observations to show that such photospheric proxies can be used to monitor the solar activ-ity and its long- and short-term temporal evolutions. In Section 2, we describe the set of observations used in this analysis. In Sec-tion 3, we analyze the temporal variaSec-tions of these photospheric activity proxies over the solar cycles 23 and 24 and we com-pare them to standard activity proxies. In Section 4, we study the wavelength dependence of the photospheric Sph proxy
de-rived from the VIRGO observations. Conclusions are presented in Section 5.
2. Observations
The space-based VIRGO and GOLF instruments on board SoHO are collecting continuous observations of the Sun since the be-ginning of 1996, with temporal cadences of 60 and 10 seconds respectively. However, we note that two temporary losses of the SoHO spacecraft result in two extended gaps in the VIRGO and GOLF acquisition. The first gap of about 100 days happened dur-ing the summer of 1998 after a bad maneuver of the SoHO ro-tation. The second gap, about a month long, occurred in January 1999 while a new software was being uploaded to the spacecraft that caused the SoHO gyroscopes to fail. In this work, we used a total of 21 years of VIRGO and GOLF data from 1996 April 11 to 2017 April 11 spanning solar cycles 23 and 24. The associated duty cycles are 94.7% and 96.6% respectively.
D. Salabert et al.: Photospheric activity of the Sun with VIRGO and GOLF
The VIRGO instrument is composed of three Sun photome-ters (SPM) at 402 nm (blue channel), 500 nm (green channel), and 862 nm (red channel). The VIRGO/SPM photometric obser-vations were calibrated as described in Jiménez et al. (2002). In addition, a composite photometric time series was also obtained by combining the observations from the green and red VIRGO channels, whose combination has the closest bandwidth to the Keplerinstrument (see Basri et al. 2010). This composite series should be used when comparing the Sun with the stars observed by Kepler.
The GOLF instrument was designed to measure the Doppler wavelength shift integrated over the solar surface in the D1 and D2 Fraunhofer sodium lines at 589.6 and 589.0 nm respectively. Unfortunately, due to a malfunction in its polarization mecha-nism, the GOLF instrument has not been working in its nomi-nal configuration since shortly after the launch of SoHO (Gar-cía et al. 2004). Instead, only one side of the sodium doublet is observed, from which a proxy of the Doppler velocity signal is produced (García et al. 2005). Moreover, the GOLF observations have been collected from each side of the doublet as follows: in the blue-wing configuration from 1996 April 11 until 1998 June 24 (i.e., 805 days), and later on from 2002 November 19 until now (the so-called blue-wing periods); in the red-wing config-uration of the sodium doublet between 1998 October 30 until 2002 November 18 (i.e., 1481 days) (the so-called red-wing pe-riod).
The VIRGO/SPM and GOLF instruments are sensitive to the conditions at different heights in the solar atmosphere. In the case of the photometric VIRGO/SPM observations, the re-sponse functions of the three channels peak around the base of the photosphere (Fligge et al. 1998), the blue and green chan-nels at −20 km, and the red channel at +10 km (Jiménez et al. 2005). On the other hand, Jiménez-Reyes et al. (2007) showed that the response function of the Doppler velocity GOLF mea-surements in the sodium Fraunhofer line is different between the blue- and the red-wing configurations, with averaged heights in the solar atmosphere of 322 km and 480 km respectively. Then, the measurements obtained in the red-wing configuration origi-nate higher up in the solar atmosphere with larger contributions from the chromosphere.
In order to monitor the long-lived features on the solar sur-face, the VIRGO/SPM and GOLF data were processed and high-pass filtered through the Kepler Asteroseismic Data Analysis and Calibration Software (KADACS, García et al. 2011). We recall that a great care is needed in the choice of the high-pass filter as it affects the absolute values of the measured photospheric activ-ity proxies. Here, a cut-off of 70 days was used, the impact of the filter being thus within the errors as shown in Salabert et al. (2016). Finally, the VIRGO/SPM and GOLF data were rebinned at 30 min to mimic the Kepler long-cadence data having a tem-poral sampling of 29.4244 min. Figure 1 shows the 21 years of the photometric VIRGO/SPM (green channel) and radial veloc-ity GOLF observations thus obtained and analyzed in this work. 3. Photometric and velocity activity proxies
The photospheric activity proxy Sph was calculated for the
VIRGO/SPM blue, green, and red channels independently, as well as for the composite data, over sub series of 125 days, cor-responding to 5 × Prot , for a solar rotation at the equator Prot
of 25 days. An overlap of 15.625 days between consecutive sub series was also introduced. Only non-zero data points (i.e. no missing data) were used in the computation of Sph. The
associ-ated standard errors of the mean values were taken as estimates
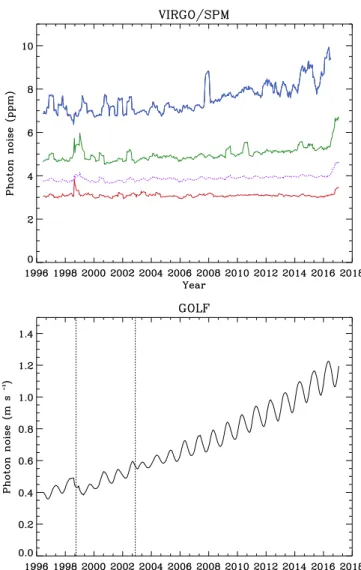
Fig. 2. Top panel: Photon noise in ppm as a function of time of the photometric VIRGO/SPM observations (color-coded blue, green, and red channels, and composite in dotted purple). Bottom panel: Same as the top panel but for the radial velocity GOLF observations in m s−1.
The vertical dashed lines indicate the GOLF red-wing period from mid 1998 to end 2002.
of the errors on Sph. A similar analysis of the radial velocity
GOLF observations provided the so-called Svelactivity proxy.
3.1. Photon noise correction
The Sph and Svel activity proxies were corrected from the
as-sociated photon noise estimated from the high-frequency region (over 8000 µHz) of the power spectrum of the corresponding observations. Figure 2 shows the photon noise as a function of time for VIRGO/SPM and GOLF. It was estimated from the un-filtered observations with their original temporal cadence, i.e. 60 and 10 seconds respectively (see Section 2), in order to have ac-cess to the frequency regime of the photon noise with the high-est Nyquist frequency possible. In the case of VIRGO, the ca-dence of 60 seconds gives a Nyquist frequency of 8333.33 µHz, which is close to the pseudo-mode regime between the acoustic cut-off frequency at ∼ 5500 µHz and about 7500 µHz (García et al. 1998; Jiménez et al. 2005). The power spectrum reaches the Gaussian distributed white noise regime above 8000 µHz which
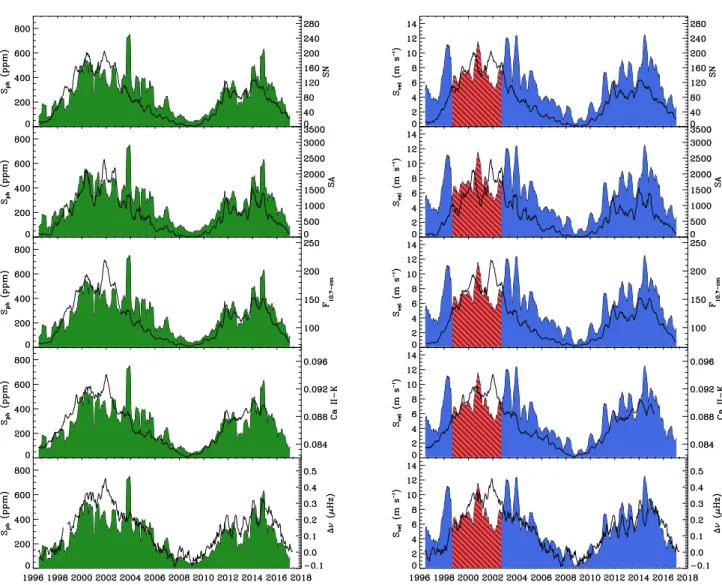
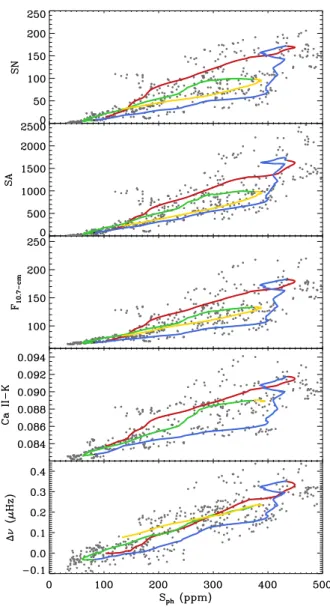
Fig. 3. Magnetic activity proxies Sph,green(in ppm) and Svel(in m s−1) measured from the photometric VIRGO/SPM green channel (green filled,
left panels) and the radial velocity GOLF (blue filled, right panels) observations as a function of time and compared to standard indices of solar activity (solid black lines). From top to bottom: the total sunspot number (SN); the total sunspot area (SA); the 10.7-cm radio flux (F10.7-cm) in
10−22s−1m−2Hz−1
; the Ca ii K-line line emission index in Å; and the mean frequency shifts of the l = 0, 1, and 2 acoustic oscillations (∆ν) in µHz. The red shaded areas on the right-hand panels represent the period when GOLF was observing in the red wing of the sodium line.
allows to estimate the photon noise up to 8200 µHz. We checked that over that frequency range the mean and the standard devia-tion of the power spectrum return similar values. We note that the signature of the Data Acquisition System (DAS) of the VIRGO instrument with a 3-min cadence at 5555.55 µHz has two impor-tant harmonics at 2777.78 µHz in the p-mode region and at the 8333.33 µHz Nyquist frequency. For the latter reason, we thus limited the calculations of the VIRGO/SPM photon noise to the upper limit of 8200 µHz.
For validation purposes, we also have calculated the VIRGO/SPM photon noise by performing a Bayesian analysis of the background using the DIAMONDS code (Corsaro & De Rid-der 2014). The background profile, P, of the unsmoothed power spectra was modeled as described in Corsaro et al. (2015)
fol-lowing:
P(ν)= B(ν) + L(ν) + N, (1)
where, B(ν) includes the contribution of the different time scales of granulation and the signature of activity at low frequency, and L(ν) corresponds to the Lorentzian-like power excess envelope of the solar oscillations over the entire p-mode region. The vari-able N represents the flat photon noise at high frequency. We note that the background of asteroseisimic targets is obtained in a similar manner (see e.g., Kallinger et al. 2014). We compared Nto the estimates of the photon noise obtained as the mean value of the power spectra between 8000 µHz and 8200 µHz as ex-plained above. We found that the values of the photon noise thus measured correspond to within 1.0, 0.7, and 0.4 ppm to the ones
D. Salabert et al.: Photospheric activity of the Sun with VIRGO and GOLF
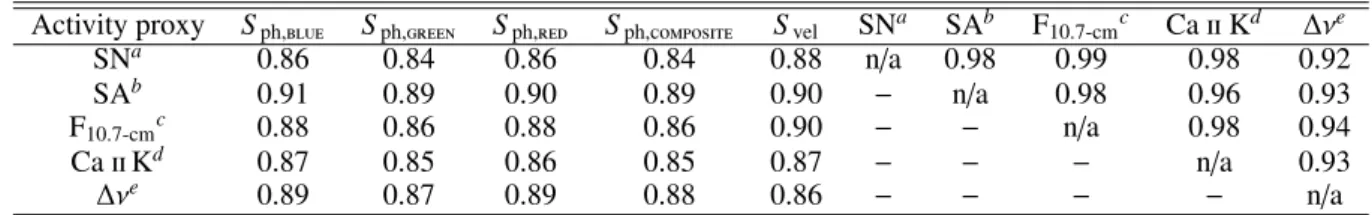
Table 1. Spearman’s correlation coefficients between the photometric VIRGO/SPM Sphand the radial velocity GOLF Svelmagnetic proxies and
standard indices of solar activity over 21 years during Cycles 23 and 24.
Activity proxy Sph,blue Sph,green Sph,red Sph,composite Svel SNa SAb F10.7-cmc Ca ii Kd ∆νe
SNa 0.86 0.84 0.86 0.84 0.88 n/a 0.98 0.99 0.98 0.92
SAb 0.91 0.89 0.90 0.89 0.90 − n/a 0.98 0.96 0.93
F10.7-cmc 0.88 0.86 0.88 0.86 0.90 − − n/a 0.98 0.94
Ca ii Kd 0.87 0.85 0.86 0.85 0.87 − − − n/a 0.93
∆νe 0.89 0.87 0.89 0.88 0.86 − − − − n/a
Notes.aTotal sunspot number;bTotal sunspot area;c10.7-cm radio flux;d
Ca ii K-line emission index; andeMean l= 0, 1, and 2 frequency shifts
Table 2. Spearman’s correlation coefficients between the photometric VIRGO/SPM Sphmagnetic proxies and standard indices of solar activity
during Cycle 23.
Activity proxy Sph,blue Sph,green Sph,red Sph,composite SNa SAb F10.7-cmc Ca ii Kd ∆νe
SNa 0.85 0.83 0.86 0.84 n/a 0.98 0.99 0.98 0.93
SAb 0.89 0.88 0.90 0.88 − n/a 0.98 0.96 0.93
F10.7-cmc 0.86 0.84 0.87 0.84 − − n/a 0.98 0.94
Ca ii Kd 0.85 0.83 0.86 0.84 − − − n/a 0.93
∆νe 0.88 0.86 0.88 0.87 − − − − n/a
Notes.aTotal sunspot number;bTotal sunspot area;c10.7-cm radio flux;d
Ca ii K-line emission index; andeMean l= 0, 1, and 2 frequency shifts
Table 3. Spearman’s correlation coefficients between the photometric VIRGO/SPM Sphmagnetic proxies and standard indices of solar activity
during Cycle 24.
Activity proxy Sph,blue Sph,green Sph,red Sph,composite SNa SAb F
10.7-cmc Ca ii Kd ∆νe SNa 0.92 0.88 0.86 0.87 n/a 0.98 0.97 0.93 0.86 SAb 0.94 0.90 0.89 0.90 − n/a 0.97 0.93 0.86 F10.7-cmc 0.94 0.92 0.90 0.92 − − n/a 0.96 0.91 Ca ii Kd 0.89 0.89 0.83 0.87 − − − n/a 0.94 ∆νe 0.87 0.88 0.87 0.89 − − − − n/a
Notes.aTotal sunspot number;bTotal sunspot area;c10.7-cm radio flux;d
Ca ii K-line emission index; andeMean l= 0, 1, and 2 frequency shifts
inferred from the bayesian analysis respectively for the blue, green, and red channels. Although they should be considered as upper limits of the VIRGO/SPM photon noise, the differences are well within the mean errors on the Sph proxy of 5, 4, and
2 ppm respectively. Furthermore, they represent an easy and re-producible way to obtain the VIRGO/SPM photon noise.
The top panel of Fig. 2 shows that the temporal evolution of the VIRGO/SPM photon noise is different between the three SPM channels. The blue channel is the noisier and shows a clear increase with time starting from the beginning of the mission for a total of about 30% between 1996 and 2016, while over the same period the photon noise of the green channel increases by about 10%. On the other hand, the photon noise of the red chan-nel remains quite constant with an overall variation of less than 1%. We interpret these results as a consequence of the degra-dation of the filters due to the incoming radiation that increases the photon noise level as a function of the wavelength associ-ated to a probable degradation of the detectors. This was verified by looking at the original signals which show similar behaviors between channels. We also note a sharp increase of the photon noise in the three channels from ∼ 2017 which could indicate a new degradation of the instrument. Future observations will help to understand its origin.
In the case of the GOLF observations, the original tem-poral sampling of 10 seconds (i.e., a Nyquist frequency at 50000.00 µHz) is short enough to have undoubtedly access to the photon noise regime. Due to its single-wing configuration,
the GOLF velocity data are sensitive to the photon counting, and thus to the orbital period as we can see on the bottom panel of Fig. 2 with a clear 365-day signature. This dependence is added to the aging of the instrument (García et al. 2005). The config-uration changes between blue-wing and red-wing observations are also visible as denoted by the vertical dashed lines.
For each VIRGO/SPM and GOLF datasets, the photon noise was thus determined over the same 125-day sub series and sub-tracted to the associated Sphand Svelactivity proxies.
3.2. Long-term variability
The temporal evolution of the Sph, greenand Svelactivity proxies
calculated over 21 years of the photometric VIRGO/SPM green channel and radial velocity GOLF observations respectively and covering the solar cycles 23 and 24 are shown on Fig. 3. We see that they follow a clear 11-year modulation being larger at times of maxima. We note also that comparable temporal vari-ations are obtained for the Sph, blue and Sph, red proxies from the blue and red observations, but different sensitivity is observed between the three VIRGO/SPM channels. The wavelength de-pendence of the Sphproxy is discussed in Section 4. We note as
well that smaller values of Svelare obtained when GOLF was
ob-serving in the red wing of the sodium line in comparison of the blue wing. This is confirming that the red-wing configuration has contributions from regions higher in the solar atmosphere than the blue-wing configuration.
Fig. 4. Standard proxies of solar activity as a function of the photo-spheric magnetic proxy of the Sun, Sph, green(in ppm), measured from
the VIRGO/SPM green channel observations. From top to bottom, the y axis represents the sunspot number, the sunspot area, the 10.7-cm radio flux, the Ca ii K emission, and the mean frequency shifts of the l = 0, 1, and 2 acoustic oscillations. Individual measurements are shown in gray dots and the solid lines represent a smooth over 2.5 years in order to re-move short-term variations for illustrative purpose. The different colors correspond to different phases in solar activity: in red and blue, the ris-ing and declinris-ing phases of Cycle 23 respectively; in green and yellow, the rising and declining phases of Cycle 24 respectively.
In the following, both the Sphand Svelproxies are compared
to standard solar activity indices, whose daily values were av-eraged over the same 125-day sub series: (1) the total sunspot
number1; (2) the total sunspot area2; (3) the 10.7-cm radio flux3; and (4) the chromospheric Ca ii K-line emission4. (5) The
pho-tometric and velocity proxies are also compared to the temporal variations of the l= 0, 1, and 2 acoustic oscillation frequencies averaged over the range 2650 and 3450 µHz and extracted from the GOLF observations over the same 125-day sub series follow-ing the methodology described in Salabert et al. (2015). We note however that the sub series around the temporary losses of SoHO in summer 1998 and beginning of 1999 with a filling factor lower than 50% were disregarded as the p-mode frequencies cannot be estimated with sufficient accuracy. These standard proxies are sensitive to different layers of the Sun. The sunspot number and area are associated to the photospheric magnetic flux, while the radio flux is an activity proxy of the upper chromosphere and lower corona and the Ca ii K-line emission a proxy of the strength of plasma emission in the chromosphere. As for the fre-quency shifts, they reveal inferences on the sub-surface changes with solar activity not detectable at the surface by other activ-ity proxies. We note as well that Ca ii K observations up to June 10, 2015 only were used here as instrumental problems need to be addressed with the latest data. These proxies are compared to Sphand Svelon Fig. 3.
Table 1 gives the Spearman’s correlation coefficients be-tween the photometric Sph of the three VIRGO/SPM channels,
the associated Kepler-like composite VIRGO/SPM time series, and the GOLF radial velocity Svelactivity proxies and the
stan-dard proxies monitoring solar activity represented in Fig. 3. The correlations between the common activity indices are given as well for comparison. In the case of GOLF, the correlation co-efficients were calculated only for the blue-wing period starting on 2002 November 19 in order to avoid the change between the blue and red wings of the sodium line between 1998 and 2002. We note also that independent points only were used. Both the Sphand Svelproxies are well correlated with the standard solar
activity proxies with degrees of correlation around 0.9 with no noticeable difference between the different analyzed datasets.
Figure 4 shows the standard activity proxies illustrated in Fig. 3 as a function of the corresponding photospheric activ-ity index Sph calculated from the VIRGO/SPM green channel
observations. Similar results are obtained with the two other VIRGO/SPM channels. We note that such representation for the GOLF Svelis more difficult to interpret because the changes in
the side of the observing wings. For illustrative purpose and in order to remove short-term variability, the data points were smoothed over a period of 2.5 years. The different colors corre-spond to different phases in solar activity: in red and blue, the rising and declining phases of Cycle 23 respectively; in green and yellow, the rising and declining phases of Cycle 24 respec-tively. The individual data points before smoothing are repre-sented by the gray dots. There is a clear relationship between the photospheric index Sphand the others activity proxies from one
cycle to the next. The Sphalso shows a smaller variation during
the weaker Cycle 24 as it observed in the other activity proxies, which is interestingly not as noticeable for the frequency shifts which are sensitive to the sub-layers of the Sun. Such differences of behavior of the frequency shifts at the beginning of the new
1 Source: WDC-SILSO, Royal Observatory of Belgium, Brussels at
http://www.sidc.be/silso/datafiles
2 Source: http://solarcyclescience.com/activeregions.
html
3 Source: National Geophysical Data Center at http://www.ngdc.
noaa.gov/stp/solar/solardataservices.html
4 Source: composite data from NSO/Sacramento Peak and SOLIS/ISS
D. Salabert et al.: Photospheric activity of the Sun with VIRGO and GOLF
Fig. 5. Same as Fig. 3 but once the signature of the 11-year solar cycle is removed with a Gaussian filtering (see Section 3.3). On the right panels, the two vertical dashed lines indicate the GOLF red-wing period from mid 1998 to end 2002.
Cycle 24 were already reported in Salabert et al. (2009) and Tri-pathy et al. (2010). Salabert et al. (2015) also show that these dif-ferences are a function of frequency. Indeed, the frequency shifts of the low-frequency modes, less sensitive to the upper layers of the Sun, show almost no difference between Cycles 23 and 24 while the frequency shifts of the high-frequency modes are smaller during Cycle 24. Furthermore, Fig. 4 shows that the rela-tionship between the Sphproxy and the standard activity proxies
is not fully linear and that it follows an hysteresis pattern. Such hysteresis have already been observed between several solar ob-servations of photospheric and chromospheric activity (see e.g., Bachmann & White 1994; Özgüç et al. 2012), as well as with frequency shifts (see e.g., Jiménez-Reyes et al. 1998; Tripathy et al. 2001). Recently, Salabert et al. (2016) have already shown the existence of such hysteresis between the Sph and the Ca K-line
emission. Time delays are thus clearly present among the di ffer-ent solar activity proxies associated to the distribution in latitude of the surface magnetic flux and of its temporal evolution.
Finally, we checked if any differences can be measured be-tween Cycle 23 and the weaker Cycle 24. Again, we focused here on Sph from VIRGO observations as the results with the
GOLF Svelbetween Cycles 23 and 24 are more difficult to
in-terpret because the change in the operation of the instrument throughout the mission. The obtained correlation coefficients are given in Tables 2 and 3. As in Table 1, independent points only were used in the calculations. The Sph proxies for the blue and
green channels are observed to be better correlated with the sunspot number, the sunspot area, the radio flux, and the Ca ii K emission during Cycle 24 than during Cycle 23. On the other hand, the Sph proxy for the red channel does not show
differ-ences between the two solar cycles. That could indicate changes in the photospheric response of these activity proxies during Cy-cle 24 and not in the chromospheric one as the sensitivity of the blue and green VIRGO channels peaks below the photo-sphere. Besides, correlations between standard activity proxies are comparable during the two last solar cycles, except with the
p-mode frequency shifts and somehow the Ca ii K emission. In-deed, the frequency shifts show lower degree of correlation with the sunspot number, the sunspot area, the radio flux, and the Ca ii K during Cycle 24 than during Cycle 23 indicating that the sub-surface layers have not changed (see Salabert et al. 2015). To summarize, Tables 2 and 3 indicate that modifications of the magnetic field interaction with the solar photosphere and chro-mosphere, but also with the inner upper layers of the Sun, are taking place between the two last solar cycles.
3.3. Short-term variability
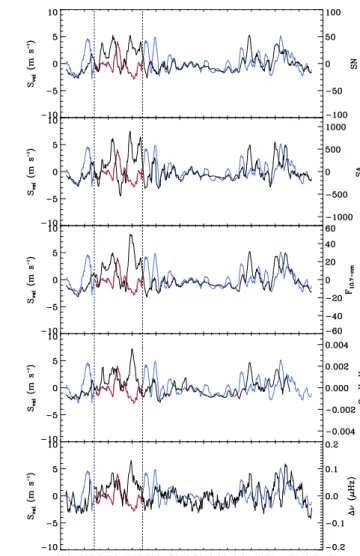
Short-term variations in the solar activity of about 2 years (QBO) coexist on top of the 11-year cycle and are observed by intermit-tence with time-dependent amplitudes (see e.g., Bazilevskaya et al. 2015, and references therein). Furthermore, these quasi-periodic variations are observed to be stronger during solar max-ima. Figure 5 shows the activity proxies Sph (green channel)
and Svel, and the standard activity proxies once the signature of
the 11-year solar cycle is removed. It was done by substracting the corresponding smoothed variations using a Gaussian filter of full width of 2.5-year length. Short-term variability exists, be-ing more or less in phase between each others. We observe also stronger short-term variations in the Sphand Svelat time of
max-ima as observed in other proxies. We note as well that the stan-dard proxies are more in phase with Sph during Cycle 24 than
during Cycle 23, as it was translated into their degrees of corre-lation given in Tables 2 and 3. Regarding the short-term variabil-ity of the p-mode frequency shifts, we observe a clear change in behavior of the QBO from May 2011. Indeed, a shorter variabil-ity of about 270 days is in place for few years during the rising phase of Cycle 24 up to about February 2015 and it disappears during the following declining phase of activity. The solar cy-cle 24 is cy-clearly peculiar compared to previous cycy-cles and fur-ther in-depth analysis of the frequency shifts will be required in order to relate this to any modification of the solar dynamo. 4. Photometric wavelength dependence to
S
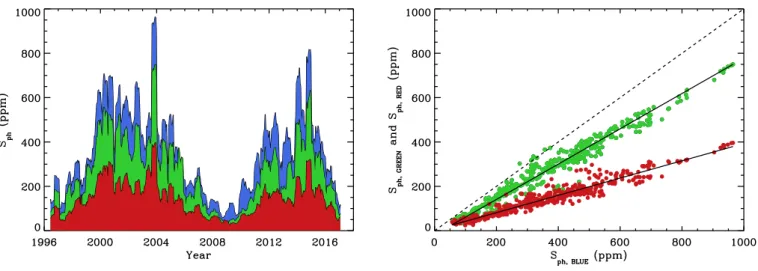
phThe left panel of Fig. 6 shows the photospheric activity prox-ies Sph obtained from the three individual blue, green, and red
VIRGO/SPM channels as a function of time. While the Sph is
well correlated with solar activity for the three channels, the sensitivity of their variations along the solar cycle is different between channels. Indeed, the blue channel shows the largest variations between minimum and maximum of solar activity – of about 600 ppm, while in the mean time the red channel shows only a variation of about 200 ppm. The green channel is closer to the blue channel with a variation of about 500 ppm between min-imum and maxmin-imum of solar activity. We note that the mean un-certainties on Sphare about 5, 4, and 2 ppm for the blue, green,
and red channels respectively. The largest differences between channels occur at times of solar maxima, while the differences are marginal during solar minima. However, the temporal vari-ations of Sph between the three channels remain linear, as
illus-trated on the right panel of Fig. 6 which shows the Sph proxy
from the green and red channels as a function of the Sphvalues
from the blue channel. The Sph, red has a much reduced
ampli-tude during the phase of maximum of activity, while comparable values are measured between the three channels during the min-imum of activity. Regarding the Sph, green, it has a much closer temporal behavior to the Sph, bluechannel and to the 1:1 correla-tion. Weigthed linear regressions between the quantities give the following relations between the VIRGO/SPM channels:
Sph,green= 0.756 × Sph,blue− 17.497 (2) and
Sph,red= 0.374 × Sph,blue+ 3.653 (3) The Eqs. 2 and 3 describe the wavelength dependence of the sensitivity of the Sph proxy to magnetic activity in
photomet-ric observations. Shorter wavelengths (such as the one from the VIRGO/SPM blue channel at 402 nm) are observed to be more favorable than longer wavelengths (like the VIRGO/SPM red channel at 862 nm) to follow solar activity. We note that Fligge et al. (1998) observed comparable relative variations in the irra-diance between the three VIRGO channels. Moreover, the values given in Eqs. 2 and 3 are in agreement with the ones derived by Unruh et al. (1999) using the VIRGO observations of the total and spectral irradiance. Fröhlich et al. (1997) and Jiménez et al. (1999) found comparable ratios as well in the amplitude and the gain respectively between the three channels when measuring the acoustic oscillations.
These results can be related to the wavelength dependence of the magnitude of solar variability measured in sunspots. In-deed, the Sph proxy corresponds to the photometric variations
associated to the rotation of spots at the surface of the Sun. Al-though likely to be more complex, in a first approach, we might suppose that the wavelength dependence of the Sphproxy is
con-nected to the temperature dependence described by the Planck's law explaining the larger variations observed at shorter wave-lengths than at longer wavewave-lengths. Although the studied range of wavelengths is narrow (from 402 nm to 862 nm, going from the visible light to the near infrared), the Eqs. 2 and 3 show as a first approximation that a simple linear relation can be used to rescale the activity proxy Sphobtained at different wavelengths.
It thus offers the possibility to compare stellar activity to the Sun measured from different photometric observations of solar-like and main-sequence stars. For instance, the bandpass of the Ke-plertelescope is comprised between 420 and 900 nm. Although wider, the bandpass of the PLATO (Rauer et al. 2014) space mis-sion should cover a comparable wavelength range as Kepler.
5. Conclusions
We analyzed the observations collected by the space-based pho-tometric VIRGO and radial velocity GOLF instruments on board the SoHO satellite in an unexplored way yet to study the long-and short-term variabilities of solar activity. We tracked the tem-poral modulations of the observed parameters associated to the presence of spots or magnetic features rotating on the surface of the Sun in a similar manner as it is done in the stellar con-text with CoRoT and Kepler. A total of 21 years of observations spanning the solar cycles 23 and 24 were thus divided into sub series of 5 × Prot = 125 days, with a mean rotational period
of the Sun Prot of 25 days. The associated photospheric activity
proxy Sphwas then calculated for the photometric VIRGO/SPM
blue, green, and red channels independently, as well as for the combination of the green and red channels into a composite time series. This composite dataset has the closest bandwidth to Ke-plerobservations and should be used when comparing the Sun to Kepler targets. The corresponding activity proxy Svelwas also
determined from the radial velocity GOLF observations. Both Sph and Svelwere compared to several standard solar
D. Salabert et al.: Photospheric activity of the Sun with VIRGO and GOLF
Fig. 6. Left panel: Photospheric activity proxies, Sph(in ppm), for each of the blue, green, and red channels of the VIRGO/SPM observations as a
function of time. Right panel: Photospheric activity proxy, Sphfrom the VIRGO/SPM green (green dots) and red (red dots) channels as a function
of the photospheric index, Sph, from the blue channel. The solid lines correspond to weighted linear regressions between the data, and the dashed
line represents the 1:1 correlation.
from the inner sub-layers up to the corona: the temporal vari-ability of the acoustic oscillation frequencies, the sunspot num-ber and sunspot area, the Ca ii K-line emission, and the 10.7-cm radio flux. We showed that these new activity proxies de-rived from the VIRGO and GOLF observations are well corre-lated with commonly used activity proxies over the long-term 11-year variability and that they indicate as well a weaker Cy-cle 24 compared to the previous solar cyCy-cle as the other prox-ies do. Moreover, these new proxprox-ies suggest that modifications of the magnetic field interaction with the solar photosphere and chromosphere, but also with the inner upper layers of the Sun, took place between Cycle 24 and Cycle 23. The short-term vari-ability observed in the Sun, such the QBO, was also measured to be comparable to other proxies with stronger variations at time of maxima. We demonstrated that these new proxies provide a new manner to monitor solar activity in photometry and in radial velocity observations.
Furthermore, the photometric proxies Sphshow a wavelength
dependence between the three channels of the VIRGO photome-ters. The blue channel at 402 nm is the most sensitive to vari-ations with solar activity, while the red channel at 862 nm is the least sensitive by a factor 2.7. The green channel at 500 nm has closer activity sensitivity to the blue channel with a fac-tor 1.3. Such observations of the wavelength dependence of the response function of the solar photosphere provide inputs for the study of the stellar magnetism of Sun-like stars. It allows also to rescale the activity proxy Sph of solar-like and
main-sequence stars obtained at different wavelengths with the pho-tometric Kepler and PLATO observations and to compare to the Sun. These measurements of solar magnetic activity monitor-ing derived from the VIRGO and GOLF observations are deliv-erables of the European SpaceInn project, and can be found at http://www.spaceinn.eu.
Acknowledgements. The GOLF and VIRGO instruments on board SoHO are a cooperative effort of many individuals, to whom we are indebted. SoHO is a project of international collaboration between ESA and NASA. The authors strongly acknowledge the french space agency, CNES, for its support to GOLF since the launch of SoHO. We are also particularly grateful to Catherine Renaud for her daily check of the GOLF data. DS acknowledges the financial support from the CNES GOLF grant and the Observatoire de la Côte d’Azur for support during his stays. EC is funded by the European Union0s Horizon 2020 research
and innovation programme under the Marie Sklodowska-Curie grant agreement no. 664931. The research leading to these results has also received funding from the European Community’s Seventh Framework Programme ([FP7/2007-2013]) under grant agreement no. 312844 (SPACEINN). The sunspot number data are provided by WDC-SILSO, Royal Observatory of Belgium (Brussels). We thank Solar Cycle Science (http://solarcyclescience.com) for making their data of the sunspot area freely available. The 10.7-cm radio flux measurements are provided by the National Geophysical Data Center. This work uses SOLIS/ISS data obtained by the NSO Integrated Synoptic Program (NISP), managed by the National Solar Observatory, which is operated by the Association of Universities for Research in Astronomy (AURA), Inc. under a cooperative agreement with the National Science Foundation.
References
Bachmann, K. T., & White, O. R. 1994, Sol. Phys., 150, 347
Baglin, A., Michel, E., Auvergne, M., & COROT Team 2006, Proceedings of SOHO 18/GONG 2006/HELAS I, Beyond the spherical Sun, 624, 34 Basri, G., Walkowicz,L. M., Batalha, N., et al. 2010, ApJ, 713, L155 Basu, S., Broomhall, A.-M., Chaplin, W. J., & Elsworth, Y. 2012, ApJ, 758, 43 Bazilevskaya, G., Broomhall, A.-M., Elsworth, Y., & Nakariakov, V. M. 2015,
The Solar Activity Cycle, 359
Bertello, L., Pevtsov, A., Tlatov, A., & Singh, J. 2016, Sol. Phys., 291, 2967 Borucki, W. J., Koch, D., Basri, G., et al. 2010, Science, 327, 977
Chaplin, W. J., Elsworth, Y., Isaak, G. R., Miller, B. A., & New, R. 2000, MN-RAS, 313, 32
Chaplin, W. J., Elsworth, Y., Miller, B. A., Verner, G. A., & New, R. 2007, ApJ, 659, 1749
Corsaro, E., & De Ridder, J. 2014, A&A, 571, A71
Corsaro, E., De Ridder, J., & García, R. A. 2015, A&A, 579, A83
Corsaro, E., Lee, Y.-N., García, R. A., et al. 2017, Nature Astronomy, 1, 0064 Domingo, V., Fleck, B., & Poland, A. I. 1995, Sol. Phys., 162, 1
Ferreira Lopes, C. E., Leão, I. C., de Freitas, D. B., et al. 2015, A&A, 583, A134 Fletcher, S.T., Broomhall, A.-M., Salabert, D. et al. 2010, ApJ, 718, L19 Fligge, M., Solanki, S. K., Unruh, Y. C., Froehlich, C., & Wehrli, C. 1998, A&A,
335, 709
Fossat, E., Boumier, P., Corbard, T. et al. 2017, A&A, in press Fröhlich, C., Romero, J., Roth, H., et al. 1995, Sol. Phys., 162, 101
Fröhlich, C., Andersen, B. N., Appourchaux, T., et al. 1997, Sol. Phys., 170, 1 Gabriel, A. H., Grec, G., Charra, J. et al. 1995, Solar Phys., 162, 61
García, R. A., Pallé, P. L., Turck-Chièze, S., et al. 1998, ApJ, 504, L51 García, R. A., Boumier, P., Charra, J., et al. 1999, A&A, 346, 626
García, R. A., Jiménez-Reyes, S. J., Turck-Chièze, S., & Mathur, S. 2004, SOHO 14 Helio- and Asteroseismology: Towards a Golden Future, 559, 432 García, R. A., Turck-Chièze, S., Boumier, P. et al. 2005, A&A, 442, 385 García, R. A., Turck-Chièze, S., Jiménez-Reyes, S. J., et al. 2007, Science, 316,
1591
García, R. A., Hekker, S., Stello, D., et al. 2011, MNRAS, 414, L6 García, R. A., Ceillier, T., Salabert, D., et al. 2014, A&A, 572, AA34
Jiménez, A., Roca Cortés, T., Severino, G., & Marmolino, C. 1999, ApJ, 525, 1042
Jiménez, A., et al. 2002, Sol. Phys., 209, 247
Jiménez, A., Jiménez-Reyes, S. J., & García, R. A. 2005, ApJ, 623, 1215 Jiménez-Reyes, S. J., Régulo, C., Pallé, P. L., & Roca Cortés, T. 1998, A&A,
329, 1119
Jiménez-Reyes, S. J., Chaplin, W. J., Elsworth, Y., et al. 2007, ApJ, 654, 1135 Kallinger, T., De Ridder, J., Hekker, S., et al. 2014, A&A, 570, A41
Mathur, S., Salabert, D., García, R. A.,& Ceillier, T. 2014a, Journal of Space Weather and Space Climate, 4, AA
Mathur, S., García, R. A., Ballot, J., et al. 2014b, A&A, 562, AA124 Özgüç, A., Kilcik, A., & Rozelot, J. P. 2012, Sol. Phys., 281, 839
Rauer, H., Catala, C., Aerts, C., et al. 2014, Experimental Astronomy, 38, 249 Salabert, D., Jiménez-Reyes, S. J., & Tomczyk, S. 2003, A&A, 408, 729 Salabert, D., García, R. A., Pallé, P. L., & Jiménez-Reyes, S. J. 2009, A&A, 504,
L1
Salabert, D., García, R. A., & Turck-Chièze, S. 2015, A&A, 578, A137 Salabert, D., García, R. A., Beck, P. G., et al. 2016, A&A, 596, A31 Salabert, D., Régulo, C., F., Pérez Hernández, R. A., García, In prep. Tripathy, S. C., Kumar, B., Jain, K., & Bhatnagar, A. 2001, Sol. Phys., 200, 3 Tripathy, S. C., Jain, K., Hill, F., & Leibacher, J. W. 2010, ApJ, 711, L84 Turck-Chièze, S., Basu, S., Brun, A. S., et al. 1997, Sol. Phys., 175, 247 Unruh, Y. C., Solanki, S. K., & Fligge, M. 1999, A&A, 345, 635 Wilson, O. C. 1978, ApJ, 226, 379
![[PDF] Cours Camera Raw : les formats JPG et RAW | Cours informatique](data:image/gif;base64,R0lGODlhAQABAIAAAP///wAAACH5BAEAAAAALAAAAAABAAEAAAICRAEAOw==)