Designing an Error Resolution Checklist for a
Shared Manned-Unmanned Environment
by
Jacqueline M. Tappan
BASc Systems Design Engineering
University of Waterloo, 2008
MASSACHUSETTS INSTITUTE OF TECHNOLOGY
FEB 17 2011
LIBRARIES
Submitted to the Engineering Systems Division
in partial fulfillment of the requirements for the degree of
Master of Science in Engineering Systems
at the
Massachusetts Institute of Technology
June
2010
@ 2010 Massachusetts Institute of Technology. All rights reserved.
Signature of Author
Q
l
Certified by
141'
'f /
Jacqueline Tappan Engineering Systems Division May 2010
X9
)9
Arn~ary L. Cummings Associate Professor of Engineering Systems, Aero utics and Astronautics Thesis Supervisor
Accepted by
Nancy Leveson Professor of Engineering Systems, Aeronautics and Astronautics
Chair, Engineering Systems Division Education Committee
Designing an Error Resolution Checklist for a
Shared Manned-Unmanned Environment
by
Jacqueline M. Tappan
Submitted to the Engineering Systems Division
On May 10t, 2010, in partial fulfillment of the requirements for the Degree of Master of Science in Engineering Systems
Abstract
The role of unmanned vehicles in military and commercial environments continues to expand, resulting in Shared Manned-Unmanned (SMU) domains. While the introduction of unmanned vehicles can have many benefits, humans operating within these environments must shift to high-level supervisory roles, which will require them to resolve system errors. Error resolution in current Human Supervisory Control (HSC) domains is performed using a checklist; the error is quickly identified, and then resolved using the steps outlined by the checklist.
Background research into error resolution identified three attributes that impact the effectiveness of an error resolution checklist: domain predictability, sensor reliability, and time availability. These attributes were combined into a Checklist Attribute Model (CAM), demonstrating that HSC domains with high levels of complexity (e.g. SMU domains) are ill-suited to error resolution using traditional checklists. In particular, it was found that more support was required during such error identification, as data is uncertain and unreliable.
A new error resolution checklist, termed the GUIDER (Graphical User Interface for Directed Error Recovery) Probabilistic Checklist, was developed to aid the human during the error identification process in SMU domains. Evaluation was performed through a human performance experiment requiring participants to resolve errors in a simulated SMU domain using the GUIDER Probabilistic Checklist and a traditional checklist tool. Thirty-six participants were recruited, and each was assigned to a single checklist tool condition. Participants completed three simulated error scenarios. The three scenarios had varying sensor reliability levels (low, medium, high) to gauge the impact of uncertainty on the usefulness of each checklist tool.
The human performance experiment showed that the addition of error likelihood data using an intuitive visualization through the GUIDER Probabilistic Checklist improved error resolution in uncertain settings. In settings with high certainty, there was no difference found between the performances of the two checklists. While positive, further testing is required in more realistic settings to validate both the effectiveness of the GUIDER Probabilistic Checklist tool and the Checklist Attribute Model.
Thesis Supervisor: Mary L. Cummings
Acknowledgements
I owe thanks to many people who contributed to the successful completion of this thesis.
First, a special thank you to Missy Cummings, my research advisor. Thank you for taking me on as a student, believing in my potential as a researcher, guiding me through the systems engineering process, and providing feedback (both positive and negative) week in and week out. I know that you have prepared me to achieve my career aspirations in academia and industry. Thank you to Seth Teller and all other AR team members. Thanks for giving me a crash course
in Linux and teaching me the basics of speech recognition and path planning. To William Li and Stephen Shum, thanks for inviting me along to Fort Hood to experience a real SSA. It was both educational, and thanks to your company, extremely enjoyable.
Thanks to Director, Defense Research & Engineering (DDR&E), which funded and supported this research.
I would like to thank Farzan Sasangohar, my thesis mentor, PhD mentor, and life mentor. Thank you for helping me to write and revise this thesis, and for your many thoughtful suggestions. It was great to share my office with a fellow Canadian, and to rejoice together at our team's performance during the Olympics.
Thank you to Birsen Donmez, who took an active role in my statistics instruction. I appreciate your time and patience in teaching me the finer details of "varsity statistics". Also, thank you for being so responsive through e-mail, even though you are now located in Toronto.
Thank you to my three UROPs, Scott Bezek, Peter Huang, and Rich Chan. Thanks for being my interface between HAL and CSAIL, and for all of your hard work in the development of the EIR simulation interface.
Thank you to all of the HAL graduate students past and present who welcomed me into the lab, and who I now consider friends: Farzan, Dave, Thomas, JR, Yves, Christin, Andrew, and many others.
To my family: Mom and Dave, Dad and She, Leo and Joanne. I am forever grateful for your unwavering support through even more years of schooling (and perhaps more yet to come). Thanks for the phone calls of encouragement, the care packages to boost my spirits, and the frequent visits to Boston.
I owe the most thanks to my best friend Daryl, who moved with me to Cambridge and has supported my ambitions from Day 1. There are not words enough to show how grateful I am to you; thank you does not seem to be enough. Hopefully one day I can repay the favor.
Table of Contents
A bstract... 3
A cknow ledgem ents ... 5
Table of C ontents... 7 List of Figures... 11 List of Tables ... 13 List of A cronym s... 15 C hapter 1. Introduction... 17 1.1. M otivation... 17
1.2. Problem statem ent... 19
1.3. Research objectives... 19
1.4. Representative SM U dom ain ... 20
1.5. Thesis overview ... 20
C hapter 2. Background ... 23
2.1. Classifying com plex supervisory dom ains ... 23
2.1.1. Causal dom ains... 23
2.1.2. Intentional dom ains ... 24
2.2. System sensor quality ... 26
2.3. Errors in SM U environm ents... 27
2.4. Traditional checklists... 28
2.5. H SC dom ain attributes for error identification ... 29
2.5.1. D om ain predictability ... 30
2.5.2. Sensor reliability... 30
2.5.3. Tim e availability... 30
2.5.4. Checklist A ttribute M odel (CA M ) ... 31
2.6. A lternative checklist design considerations... 33
2.6.1. D efining role of autom ation ... 33
2.6.2. Human role in error identification... ... 35
2.6.3. V isualization of error likelihoods... 37
2.7. Sum m ary ... 43
C hapter 3. G U ID ER Probabilistic C hecklist... 45
3.1. Error identification... 45
3.2. Error recovery ... 46
3.3. A pplication: Robotic forklift checklist ... 46
3.3.1. Current SSA operations...47
3.3.2. SSA dom ain w ith autonom ous forklifts ... 50
3.3.3. Sources of error ... 53
3.3.4. The GU ID ER representation ... 56
3.3.5. Error Identification and Recovery (EIR) display ... 57
3.4. Revised Checklist A ttribute M odel (CA M )... 63
3.5.1. Com m ercial aviation ... 65
3.5.2. Forklift dom ain... 67
3.6. Sum m ary ... 69
Chapter 4. Experim ental Evaluation ... 71
4.1. EIR sim ulation ... 71
4.1.1. Error scenarios... 71 4.1.2. EIR display ... 72 4.2. Hypotheses... 79 4.2.1. Perform ance... 79 4.2.2. Cognitive Strategies... 80 4.2.3. Subjective feedback... 81 4.3. Apparatus ... 81 4.4. Participants... 82 4.5. Procedure ... 83
4.5.1. Pre-experim ent interaction ... 83
4.5.2. Training ... 83
4.5.3. Error scenarios... 84
4.5.4. Post-experim ent questionnaire ... 85
4.6. Experim ent design ... 85
4.7. Sum m ary of perform ance m etrics... 86
4.8. Sum m ary ... 87
Chapter 5. R esults ... 89
5.1. N um ber of error confirm ations ... 90
5.2. Cognitive strategies... 93
5.2.1. Inform ation collection ... 94
5.2.2. Inform ation em phasis ... 94
5.3. Subjective feedback ... 96
5.3.1. Questionnaire data... 96
5.3.2. General participant feedback... 97
5.4. D iscussion of experim ental findings... 97
5.5. Sum m ary ... 100
Chapter 6. Conclusions and Future W ork... 101
6.1. Experim ental results... 102
6.2. D esign recom m endations... 103
6.2.1. Certainty indicator ... 103
6.2.2. Com bined pie chart graphic...104
6.2.3. Indication of selected errors ... 104
6.2.4. Lim iting error sources ... 105
6.3. Experim ent recom m endations and future w ork... 105
Appendix A : D escriptive Statistics... 107
Appendix B: Consent to Participate... 109
A ppendix C : D em ographic Q uestionnaire ... 113
Appendix D : Training Tutorials... 115
Appendix E: Training Video Script ... 125
Appendix F: User Interaction Q uestionnaire... 127
Appendix G : Random ization of Participants... 129
Appendix H : Collected Data ... 131
Appendix I: Statistical Assum ption Tests... 141
Appendix J: Detailed Statistical Results... 143
Figure 1: Figure 2: Figure 3: Figure 4: Figure 5: Figure 6: Figure 7: Figure 8: Figure 9: Figure 10 Figure 11 Figure 12 Figure 13 Figure 14 Figure 15 Figure 16 Figure 17 Figure 18 Figure 19 Figure 20 Figure 21 Figure 22 Figure 23 Figure 24 Figure 25 Figure 26 Figure 27 Figure 28 Figure 29 Figure 3C
Shelves of emergency procedures at Chattanooga nuclear power plant simulator.___ SMU domain with multiple unmanned vehicles._
Shadow 200 UAV checklist.
Human supervisory domain attributes for checklist design. Decision tree visualization.
Treemap visualization.
Multi-level pie chart visualization. Notional layout of a U.S. Army SSA.
Truck delivering pallets of materials to receiving area of an SSA.
: Bulk storage of materials in an SSA.
: Customer vehicles waiting to receive requested materials from SSA.
: Tracking of items located in bulk area of SSA. : Entities operating within the forklift domain.
: Tablet PC user interface for directing the RF in SSA._
: Probabilistic error tree summarizing the potential forklift errors.
: GUIDER representation of probabilistic error tree.
: Identification screen in Error Identification and Recovery (EIR) display. : Recovery screen in Error Identification and Recovery (EIR) display.
: Multiple pallets designated suggested by system as error source._
: Diagnostic test inspecting Operator Tablet view.
: Non-pallet designated selected as error source.
: GUIDER incorporated into Error Identification and Recovery (EIR) display.
: Revised Checklist Attribute Model (CAM).
: Identification screen, GUIDER Checklist._
: Identification screen, Traditional Checklist.
: Map of forklift environment for Scenario 1.
: Recovery screen after incorrect confirmation, GUIDER Checklist. : Recovery screen after incorrect confirmation, Traditional Checklist.
: Recovery screen after correct confirmation, GUIDER Checklist._
: Recovery screen after correct confirmation, Traditional Checklist.
List of Figures
24 26 28 32 40 41 42 48 48 49 49 50 51 52 56 57 59 59 61 62 62 63 64 74 74 76 77 77 78 78Figure 31: Apparatus setup for experiment. 82 Figure 32: Contextual background screen for low reliability error scenario. 85
Figure 33: Effect of checklist on number of error confirmations. 91
Figure 34: Effect of reliability on number of error confirmations. 91
List of Tables
Table 1: Generic error hierarchy with associated likelihood values. 39
Table 2: Summary of potential errors in robotic forklift field operations. 54
Table 3: Sensor groups and related pallet approach errors. 72
Table 4: Sensor reliability levels for simulated error scenarios. 72
Table 5: Suggested and true error source for each error scenario. 75
Table 6: Descriptive statistics for number of error confirmations. 92
Table 7: Error resolution strategies of participants. 95
AR ATC CAM DOD EIR GPS GUIDER HSC HDP HSR HTA LED LDP LSR LTA MDP MIT MSR MTA PRA RF RFID SSA SMU UAS UAV UGV UV
List of Acronyms
Agile Robotics Air Traffic ControlChecklist Attribute Model Department of Defense
Error Identification and Recovery Global Positioning System
Graphical User Interface for Directed Error Recovery Human Supervisory Control
High Domain Predictability High Sensor Reliability High Time Availability Light-Emitting Diode Low Domain Predictability Low Sensor Reliability Low Time Availability
Medium Domain Predictability
Massachusetts Institute of Technology Medium Sensor Reliability
Medium Time Availability Probability Risk Assessment Robotic Forklift
Radio-Frequency Identification Supply Support Activity Shared Manned-Unmanned Unmanned Aerial Systems Unmanned Aerial Vehicle Unmanned Ground Vehicle Unmanned Vehicle
Chapter 1. Introduction
The role of Unmanned Vehicles (UVs) is increasingly expanding in both simple and complex domains. The U.S. Department of Defense (DOD) plans to invest $17 billion in Unmanned Aircraft Systems (UAS) between 2008 and 2013, while between 2000 and 2008, the inventory of UAS in DOD components rose from 50 aircraft to more than 6000 (GAO, 2008). Aviation, however, is not the only domain where such unmanned system expansion is occurring, with unmanned ground vehicles (UGV) being introduced to both commercial customers and individuals. Examples include KIVA Systems, which manufactures autonomous robots for warehouse operations for companies such as Amazon® and Zappos (Scanlon, 2009). iRobot , which introduced the Roomba, a robot vacuum cleaner in 2002, has sold 3 million of the robots (The Economist, 2009) and continues to be a driving force in the growth of personal robots for the home (iRobot Corporation, 2009), as well as for the U.S. Army with the PackBot (iRobot Corporation, 2009).
In hostile environments where work tasks endanger human operators, the inclusion of unmanned vehicles to fulfill these duties may not only increase system safety, but also improve operating efficiency. Military equipment distribution warehouses are examples of hostile environments that are expanding to include unmanned vehicles. Currently, work is underway at the Massachusetts Institute of Technology (MIT) to develop a system of autonomous forklifts to distribute pallet-loaded supplies in these warehouses that are located in war zones (Chandler, 2009). The inclusion of robotic forklifts in these complex, unstructured, and sometimes hostile military environments has the potential to streamline activities and increase overall throughput, while reducing customer wait times and potentially saving human lives.
1.1. Motivation
Although the potential benefits of automation in such hostile environments are significant, there are many human factors issues that are associated with the introduction of autonomous vehicles into such complex environments. Chief among these is the changing role of human operators from direct and manual control of a system to being involved in higher-level planning and
decision-making (Cummings, Bruni, Mercier, & Mitchell, 2007). This shift to a supervisory role requires the human operator to undertake a number of new functions (Sheridan, 1992), including:
* Scheduling tasks and planning tasks
" Monitoring the actions of autonomous entities in the system and detecting failures * Intervening when required to return the system to the desired state
All Human Supervisory Control (HSC) domains require monitoring for failures and overcoming error states to ensure high productivity while maintaining the safety of both humans and autonomous entities. Error resolution in supervisory control systems continues to take the form of serial checklists, either paper or electronic, that can serve as memory aid tools, ensuring that all required recovery steps have been executed (Gawande, 2009). Traditional checklists begin with an assumed error source and present recovery steps serially. These checklists suit domains where system behavior is predictable and there is consistent performance feedback. In such domains, the error source is relatively easy to identify and error resolution can (and should) begin immediately. Traditional checklists may be inappropriate for autonomous vehicle domains with high complexity, however, as these environments can be highly unpredictable and lack the clear information feedback loops present in the more predictable supervisory control domains of piloting aircraft and monitoring nuclear power generation systems.
Shared Manned-Unmanned (SMU) domains are a subset of HSC domains that incorporate both autonomous vehicles and human operators interacting within a single system. While a high level of complexity' typically characterizes all HSC domains (Cummings, Kirschbaum, Sulmistras, & Platts, 2006), SMU domains can have enhanced complexity levels due to the large number of distinct entities operating and interacting within the system. Uncertainty in SMU domains also exists, as human behavior is less deterministic and system boundaries are often undefined, resulting in unpredictable environmental factors acting on the domain. With such high complexity and uncertainty levels, error resolution in these systems can become complicated and could benefit from additional diagnostic information from various sources. As the prevalence of SMU domains will only continue to increase as technology advances, development of an error Complexity is defined by Merriam-Webster as "the quality or state of being hard to separate, analyze, or solve."
resolution tool designed specifically for such environments is critical to ensure domain efficiency and the safety of humans operating within the system. Unfortunately, alternative error resolution tools, or checklists, designed specifically for highly complex SMU environments have not yet been developed.
1.2. Problem statement
Current error recovery checklists designed for use in traditional HSC domains, such as aviation and process control, are ill-suited to the unique characteristics of SMU domains, which are increasingly occurring in military, commercial, and various consumer environments. A new kind of error resolution tool, which allows human supervisors in SMU domains to overcome system errors efficiently, while maintaining domain safety, is required. This research proposes the development of this alternative checklist, which will be designed to satisfy the unique needs of SMU domains.
1.3. Research objectives
This research has three objectives:
* Identify the important attributes of HSC domains, their relationship to each other, and how they can be combined to establish a domain attribute model, which can be used to
categorize HSC domains.
- Develop a new error resolution tool designed specifically for HSC domains that include autonomous vehicles. The design of this tool can be guided by previous research in serial checklists, complex work domains, automation, human decision-making, and information visualization.
- Evaluate the new error resolution tool against a traditional checklist tool to determine which is more effective in supporting error resolution in a representative SMU domain.
The objective of this new checklist is to improve the error identification and recovery process in SMU domains, ensuring that human supervisors within these environments can accurately and efficiently identify the source of an error, recover from the error, and transition the system back into an operational state.
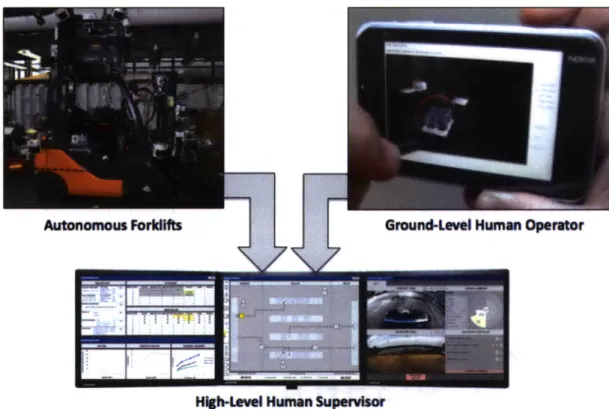
1.4. Representative SMU domain
This research employs the previously discussed autonomous forklift domain to demonstrate the new, alternative checklist. Currently, military distribution warehouses, which store and distribute items required for U.S. Army active duty, utilize manually operated forklifts. Complexity and uncertainty in the domain is already high, as the operations of multiple manually operated forklifts must be coordinated to ensure that the warehouse environment runs efficiently. The war-zone environment introduces potential unpredictable events resulting from militant actions, and environmental factors, such as rain and wind, can negatively impact the open-air warehouse. To increase warehouse efficiency, as well as to remove humans from the dangerous and exposed position of manually operating forklifts, the U.S. Army has proposed automation in the form of robotic forklifts. The introduction of these robotic forklifts will result in an SMU domain. This envisioned SMU domain will incorporate robotic forklifts (RFs), ground-level human operators who will interact with and direct the RFs in their tasks, and a high-level human supervisor who will monitor both the RFs and the human operators. While the current military warehouse environment has both high complexity and uncertainty, the addition of RFs only increases the unpredictability of the environment, and as a direct result, traditional error resolution checklists may not be appropriate. Therefore, the alternative checklist developed through this research will be applied to the autonomous forklift domain to determine whether error resolution efficiency in this representative SMU domain improves with this new tool.
1.5. Thesis overview
This thesis contains the following chapters:
e Chapter 1, Introduction, describes the motivation and research objectives of this thesis. e Chapter 2, Background, outlines the current state of error resolution in supervisory
control systems. This chapter identifies the characteristics of HSC domains that are important in error resolution, with three domain attributes identified: domain predictability, sensor reliability, and time availability. These attributes are combined into an attribute model that categorizes HSC domains, and identifies shortcomings of current
checklist tools. This chapter also presents relevant research material that guides the design and development of the alternative checklist tool.
* Chapter 3, GUIDER Probabilistic Checklist, uses the background research detailed in Chapter 2 to develop a new error resolution tool. The features of this probabilistic tool are demonstrated using the autonomous forklift project. Utilizing the domain attribute model developed in Chapter 2, two case studies are conducted to form an experimental hypothesis as to the best error resolution system for SMU domains.
- Chapter 4, Experimental Evaluation, describes the human performance experiment, incorporating a simulation of the SMU autonomous forklift domain, used to test the hypothesis of this research. Details include a discussion of participants, procedures, and experimental design.
- Chapter 5, Results, presents the findings of the human performance experiment using such metrics as number of error confirmations, cognitive strategy, and subjective appeal for both a traditional-style checklist and the GUIDER Probabilistic Checklist.
* Chapter 6, Conclusions and Future Work, compares the results of the human performance experiment with the research hypotheses. The chapter also provides a set of design and future experimental recommendations based upon the experimental results. The chapter concludes with a description of the future work necessary to generalize this research and integrate alternative error resolution methods into current and future practice.
Chapter 2. Background
In this chapter, common characteristics of HSC domains are investigated to determine the functionality that would be required for a new error resolution checklist in an SMU domain. An examination of current checklist systems is also performed in order to determine the shortcomings of current error resolution systems when applied to SMU environments.
Through this initial research, three HSC domain attributes are identified that have an impact on error resolution: domain predictability, sensor reliability, and time availability. These attributes are used to identify the current HSC domains that are well-suited to error resolution with traditional checklists, as well as those domains that are currently not well served, providing justification for the development of a new error resolution tool to be used in select HSC domains.
Relevant research in the fields of automation, human judgment under uncertainty, and information visualization is reviewed to guide the development of the alternative checklist.
2.1. Classifying complex supervisory domains
HSC domains can be grouped into two major categories: causal domains and intentional domains. By gaining an understanding of the characteristics of HSC domains, and which category individual domains fall into, the functionality required of an error resolution checklist can be better understood.
2.1.1. Causal domains
Causal domains are closed-loop systems that are isolated from their environment (Vicente, 1999). These domains have a direct feedback loop between the current state of the system and future system actions ensuring that the goals of the domain are continually met. Causal systems generally operate in predictable ways, as a result of clear constraints (Cummings & Guerlain, 2003; Wong, Sallis, & O'Hare, 1998). These constraints include behavior being dictated by laws of physics and the system having clear boundaries. An example of a causal domain is a power generation plant.
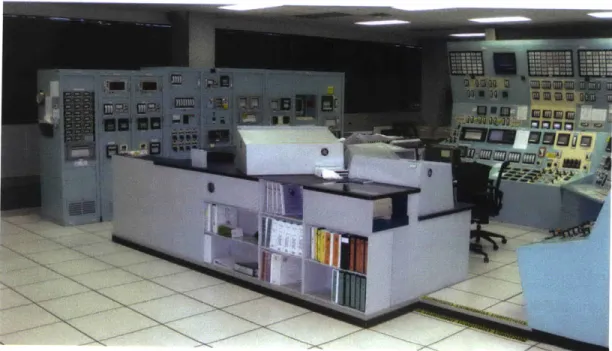
Supervisors in causal domains are responsible for monitoring the physical health status of the system, which can be closely observed through the extensive use of state sensors. If an error occurs in a causal system, the source of the error is relatively easy to pinpoint. With the error source identified, supervisors in these systems only need to recover from the failure and transition the causal system back to an operational state. Emergency checklists are usually used for error recovery, with the required steps printed on paper and stored in procedure books or included electronically as part of a computer system within the domain. An example of emergency checklist books within the Chattanooga nuclear power plant simulator is shown in Figure 1 (U.S. Nuclear Regulatory Commission, 2010).
Figure 1: Shelves of emergency procedures at Chattanooga nuclear power plant simulator.
2.1.2. Intentional domains
Intentional domains are considered to be open-loop and are subject to external influences (Vicente, 1999). Instead of goals being met by a clear feedback loop that dictates future system actions, outcomes are driven by motivations of individuals and groups that are part of the organization active in the domain: 1) the individual acting in a supervisory role, and 2) individuals and groups outside of the system whose actions can impact operations. An example of an intentional domain is command and control.
There is a high level of unpredictability and uncertainty within intentional domains, with unanticipated events likely to occur. According to (Cummings & Guerlain, 2003; Wong et al., 1998), this is in part due to:
- Human decisions directly dictating system behavior, as opposed to laws of physics dictating system behavior
e Systems not having obvious boundaries, and as a result, being influenced by highly uncertain environmental factors that cannot be controlled or anticipated
If an error occurs in an intentional system, the source of the error is more difficult to identify, due to high levels of uncertainty. Therefore, basic emergency checklists, which focus on error recovery once the error source has been identified, may not be a viable option within these domains.
SMU domains
SMU domains fall under the categorization of intentional domains, but can have increased levels of unpredictability due to the inclusion of autonomous vehicles within the environment. In traditional intentional domains, the main system entities are humans, who perform manual operating tasks within the system or high-level supervision tasks of human operators and statically located automation. In SMU domains, however, there is the addition of mobile autonomous vehicles. As a result, the number of distinct entities increases, and may include:
- Autonomous vehicles
- Human operators that direct autonomous vehicles * Human operators that manually operate vehicles
- High-level human supervisor monitoring the entire system
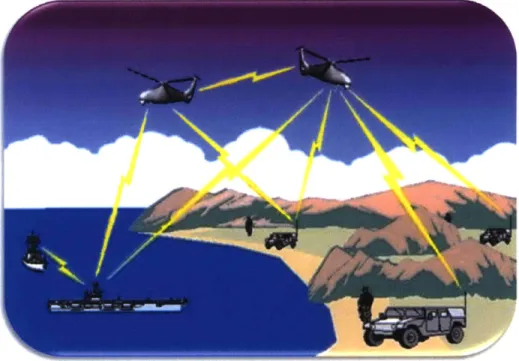
With an increase in the number of distinct domain entities, there is also an increase in the number of different interactions occurring between the entities within the system, as represented in Figure 2 (Naval Research Laboratory, 2006). As a result, SMU domains have increased complexity over general intentional domains, and are often far more complex than causal-based systems.
Figure 2: SMU domain with multiple unmanned vehicles.
2.2. System sensor quality
In order to operate autonomous vehicles within an unpredictable environment, it is vital that autonomous vehicles can detect environmental cues that guide their actions and behavior. The ability to detect cues from the environment ensures that these vehicles do not have to be consistently teleoperated by a human operator, but can instead independently select behaviors in order to fulfill mission objectives.
A system has reliable sensors if they consistently and accurately measure intended system parameters and states. Unfortunately, in many complex work environments there can be uncertainty associated with the data available to operators, resulting in the current state of the system being unclear (Vicente & Rasmussen, 1990; Vicente, 1999). For example, LIDAR (Light Detection and Ranging) sensors, which find the range of a distant target and allow an autonomous vehicle to sense potential obstacles in the environment, could provide erroneous data due to both systematic errors (e.g., laser detector bias) or random errors (e.g., signal-to-noise ratio, type of terrain, transmission properties of the atmosphere) (Huising & Pereira, 1998).
Low sensor reliability impacts the accuracy of the data that may be used by both automation and a high-level human supervisor for error resolution. If current system data transmitted by automation to the human supervisor is inaccurate, identification of the source of system failure could become more difficult and may lead to errors. In addition, if the source of system failure is incorrectly identified, domain efficiency and human safety within the domain could be compromised.
2.3. Errors in SMU environments
Reason (1990) argues that human error occurs when "a planned sequence of mental or physical activities fails to achieve its intended outcome" (p. 9). Unfortunately, in SMU systems, the source of system failure may not only be human-related. In such domains, autonomous entities present in the system can experience logic-based errors (resulting from pre-programmed coding mistakes) and component failures, with both potentially resulting in undesirable system behavior. When supervising SMU domains, it is important for human supervisors to be able to resolve all errors, both human and autonomy generated, as quickly as possible in order to return the system to normal operating conditions. This process, which includes identification of the error source and recovery from the identified error, can be grouped together using the term error resolution.
When a failure occurs in an HSC domain, it is always important to identify the source of the failure and recover from the failure as promptly as possible, in order to transition the system back into an operational state. In some time-critical domains, however, both human life and the integrity of the system depend on efficient resolution of the error state. If an error is not resolved within a short, limited duration, planes can crash, nuclear reactors can meltdown, and patients can die. To support supervisory-level error recovery, as well as maintain efficiency in error resolution, checklists are often implemented in an assistive role. These checklists guide the supervisor, step by step, through the recovery process. As supervisory control systems are utilized more frequently for monitoring complex work domains, checklists for error resolution have been implemented widely in workstations (Commission on Engineering and Technical Systems, 1997).
2.4. Traditional checklists
Traditional checklists present procedural steps serially as an aid to memory, ensuring that all required steps in some process are executed. An example of a traditional checklist, in paper-based form, is presented in Figure 3 (Department of the Army, 2004). This checklist is for the Shadow 200 unmanned aerial vehicle (UAV), which is flown by the U.S. Army and Marine Corps for surveillance, targeting, and reconnaissance (AAI Corporation, 2010). Even though the UAV is flown remotely, and therefore, the loss of the aircraft does not translate directly into the loss of human life, it is vital that system failures do not result in damage to the structural integrity of these very costly machines. Therefore, it is necessary that ground-control pilots be given procedures to resolve all conceivable Shadow 200 emergencies, including engine failure, fuse failure, and high engine temperature.
Figure 3: Shadow 200 UAV checklist. Checklists are generally implemented in HSC domains in two capacities:
* Normal checklists: used as a memory aid for completing routine procedures.
* Emergency checklists: used during error situations to recover from one or more system failures and transition the system back into an operational state.
AV High Engine Temperature
CAUTION
Climb to a safe altitude may be continued for no more than 2 minutes. Once at safe altitude and level, if over-temperature condition persists for more than 2 minutes RTB. If poor WOT RPM and climb performance is observed RTB. Failure to comply could result in loss of AV.
CAUTION
Two or more indications (High CHT, High RAO, Low WOT RPM, Low Rate of Climb) are present RTB for engine investigation. Failure to comply could result in loss of AV.
1. Altitude ... Level (AVO )
2. Airspeed ... 70 Knots (AVO) 3. Tem ps... M onitor (A VO ) Temps remain high
4. Land... As Soon As Possible (AVO)
Temps normal
Human supervisors are typically well trained on how and when to utilize Normal checklists. During system operation, there are predetermined time slots when particular tasks need to be completed before operations can progress. For example, airplane pilots must complete a "Pre-Landing" checklist, which includes lowering the landing gear, extending the landing spoilers, and braking as required (Transport Canada, 2001). Interaction with Emergency checklists is less structured, however, as failure occurrences are often difficult to foresee. When using an Emergency checklist, the supervisor not only has to complete predetermined recovery steps, but also needs to be able to identify the source of the error so that the appropriate checklist can be selected.
Often, traditional checklists will begin with an assumed error source that has been identified through automated sensor and/or human feedback. The human supervisor then proceeds serially through recovery steps. Traditional checklists are therefore appropriate for domains where system behavior is predictable and there is consistent system state feedback. In such causal systems, the error source is relatively straightforward to identify, system complexity is relatively understood, and sensor reliability is high. With this straightforward error identification process,
error recovery can (and should) begin immediately.
If the environment is intentional with the enhanced complexity of SMU interactions, the source of the error may be difficult to identify due to the unpredictability and uncertainty within the domain. The reliability of the sensors located on the autonomous vehicles in SMU environments can also lead to uncertainty in error identification. Attention will likely need to focus on the error identification process. Hence traditional checklists, which focus only on error recovery, may need to be modified to be appropriate for such domains.
2.5. HSC domain attributes for error identification
Based on this background research, three HSC domain attributes deemed to have an impact on the error resolution process were identified: domain predictability, sensor reliability, and time availability.
It is important to note that these HSC attributes predominantly impact the error identification portion of error resolution, as uncertainty and inaccuracy will make the identification of the error source more complicated. Error recovery, on the other hand, is not impacted by these domain attributes. Once the error has been accurately identified, the required recovery steps to resolve the error will remain the same, regardless of the level of domain predictability, sensor reliability, and time availability in the system.
2.5.1. Domain predictability
The two HSC domain classifications, causal and intentional, dictate the predictability of domain behavior. A system is predictable if it has well-defined boundaries; inputs and outputs into the system are known and documented, making unanticipated events unlikely (Vicente, 1999). Low Domain Predictability (LDP) could be seen as a characteristic of intentional domains, while High Domain Predictability (HDP) could be seen as a characteristic of causal domains. As previously noted, error identification may be difficult in intentional domains, as there are high levels of uncertainty and complexity, which can be further enhanced in SMU environments.
2.5.2. Sensor reliability
Sensor reliability assesses how accurately the system sensors measure intended system parameters and states. An HSC domain could have sensors whose reliabilities range from Low Sensor Reliability (LSR) to High Sensor Reliability (HSR). For example, inherent characteristics of the domain environment, such as blowing sand in war zones located within desert climates, can negatively impact the accuracy of domain sensors, resulting in the feedback of low reliability data to the system supervisor. This inaccurate data may complicate error identification when a system failure occurs, as the supervisor will be uncertain whether they can trust the data provided from the sensors, and utilize it during identification of the error source.
2.5.3. Time availability
Time availability is an important factor when recovering from an error in some HSC domains, as the inability to resolve an error within a restricted time window may result in harm to system entities. A domain has restricted time availability when system failure or human safety will be
compromised if the error is not resolved within a limited duration, which varies for different HSC domains (Inagaki, 2006), but can range from seconds to hours. An HSC domain could range from Low Time Availability (LTA) to High Time Availability (HTA). If there is uncertainty associated with the source of a system failure, error identification can be difficult in domains with LTA, with time pressure potentially having negative effects on human judgment and decision-making.
An example of an LTA system is a nuclear reactor plant. The Chernobyl nuclear plant accident had a restricted time window for error resolution, as can be seen by the devastation left behind after the operational errors went unresolved and a series of consequences led to the explosion of a reactor. UGV systems, on the other hand, typically have medium to high time availability. While it is important that the error is resolved efficiently, failure to resolve the error is unlikely to result in the loss of human life. Damage to system integrity, however, is likely.
2.5.4. Checklist Attribute Model (CAM)
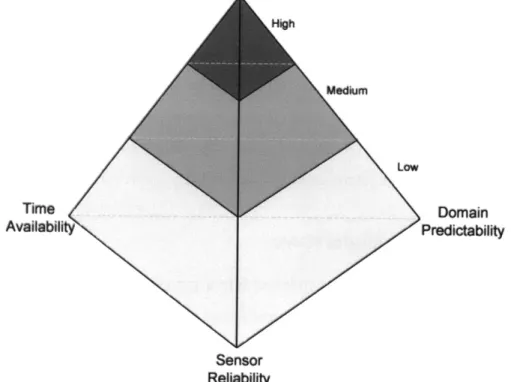
The three HSC domain attributes were combined into a graphical display, termed the Checklist Attribute Model (CAM), with each attribute represented as the edge of a tetrahedron (Figure 4). In the model, each attribute edge can be broken down into three interval scales, ranging from low, to medium, to high (i.e. the edge of the tetrahedron corresponding to sensor reliability ranges form LSR at the bottom of the tetrahedron to HSR at the top of the tetrahedron).
This graphical representation categorizes HSC domains by their need for decision-support during error identification. Error identification in HSC domains with HDP, HSR, and HTA is not mentally demanding, as uncertainty is low, data is reliable, and time is available for selecting the source of system failure. Traditional checklists, which have been utilized in HSC domains for decades, can be useful in such domains, as their limited assistance during error identification and primary focus on error recovery steps is suitable for the low mental demands associated with such domains.
Error identification in HSC domains with LDP, LSR, and LTA is mentally demanding as uncertainty is high, data is unreliable, and time is restricted for identifying the source of system
failure. Traditional checklists are not appropriate for these domains, as decision-support during error identification is not provided to assist the human supervisor in error selection. SMU domains, which are intentional and highly complex, are examples of environments with such characteristics, and therefore, are not well served by traditional checklist systems. An alternative checklist, which assists the supervisor during error identification, is therefore required.
High Medium LOW Time Domain Availability Predictability Sensor Reliability
Figure 4: Human supervisory domain attributes for checklist design.
Error identification in HSC domains with Medium Domain Predictability (MDP), Medium Sensor Reliability (MSR), and Medium Time Availability (MTA) falls into a gray zone that is difficult to categorize. The appropriate checklist for these domains may be either a traditional checklist or the alternative checklist, depending on the overall level of complexity and uncertainty. As any uncertainty can negatively impact the error resolution process, assistance during error identification in such HSC domains, provided through the alternative checklist, may prove beneficial.
The CAM visualization represents all HSC domains. As traditional checklists are best suited to HSC domains with HDP, HSR, and HTA, the graphical model indicates that these checklists are
ideal for domains falling into the high section of the tetrahedron. As technology advances and environments increase in size and complexity, fewer HSC domains will have such characteristics. Thus, the proportion of HSC domains that are suited to error resolution with traditional checklists will become (and is already becoming) smaller, as depicted in Figure 4. Complex HSC domains, including SMU systems, will continue to increase in frequency, highlighting the need for an alternative error resolution tool. Considerations in the design of such a checklist tool are discussed in the following section.
2.6. Alternative checklist design considerations
The need for a checklist specifically designed for SMU domains has been identified. This checklist will incorporate a decision support tool to guide the human supervisor in accurately identifying the source of the error, enhancing efficiency and safety in SMU environments during error identification. There are many considerations that must be made in the design of such a checklist. These considerations are discussed in the following subsections.
2.6.1. Defining role of automation
Parasuraman and Riley (1997) define automation as "the execution by a machine agent (usually a computer) of a function that was previously carried out by a human" (p. 231). Automation can be incorporated into a system to various degrees, ranging from the human in complete control of the system to the automation in complete control of the system. While high levels of automation can result in a lower taskload for the human supervisor (Parasuraman, Sheridan, & Wickens, 2000), if the level of automation is too high, supervisors may experience a loss of situation awareness as a result of being out of the decision-making loop (Kaber, Endsley, & Onal, 2000). In addition, consistently relying on automation during decision-making can result in skill degradation (Parasuraman et al., 2000).
While automation can be applied to all aspects of HSC domains, there are two particularly relevant applications in SMU domains: 1) the unmanned vehicles that operate within the environment, and 2) the decision-support tool provided to the high level supervisor in the system. While determining the tasks and capabilities of the unmanned vehicles in an SMU domain is
outside the scope of this thesis, it is essential to consider the contributing roles that the supervisor and the automation will play during error resolution in order to achieve efficient and safe failure recovery. Once an appropriate automation level has been determined, this can be built into the alternative checklist system.
When automating an error resolution tool, four different categories related to the distinct stages of human information processing must be considered: information acquisition, information analysis, decision and action selection, and action implementation (Parasuraman et al., 2000). Each of these categories can be automated to varying degrees, with the appropriate automation range determined by considering the human performance consequences of the automation, as well as the reliability of the automation and the potential costs of incorrect decisions/actions. For error resolution support in the alternative checklist, the categories of information acquisition and decision and action selection were identified as the areas where automation could be of the greatest assistance to the human supervisor.
In SMU domains, information acquisition is predominantly performed by automation through the use of sensors (Parasuraman et al., 2000). During error resolution, it will be useful to the human supervisor to have this information organized by context, location, and other criteria, absolving the supervisor from having to dedicate cognitive processes to such tasks. By applying automation to information acquisition and organization, the focus of the human supervisor can be shifted from low-level sensory activities to high-level reasoning about the collected data, or decision selection.
While automation of the information acquisition process will likely be beneficial during error resolution, automating decision and action selection may not be appropriate due to the high level of complexity and uncertainty associated with SMU environments. As the sensor-collected data may be inaccurate, the deductive reasoning abilities of automation may be ill-suited to decision-making and error source identification. The inductive reasoning abilities of the human supervisor, on the other hand, may be better matched (Fitts, 1951), and therefore, the human should be responsible for error source identification during error resolution. This source
identification can be assisted by the automation, however, through the environmental data that it collects and organizes.
2.6.2. Human role in error identification
By including the human in decision and action selection, or error identification, the overall efficiency of the error resolution process then relies on the judgment of the human supervisor. Unfortunately, human judgment under uncertainty is not perfect, due to incomplete knowledge about the problem space and limited computational abilities. Further, time availability within an HSC domain can negatively impact judgment during error identification. Under time pressure, human decision-makers cannot always employ the decision-making strategy that determines the best alternative, as they may not have the time or attentional resources to consider and evaluate multiple hypotheses (Sarter & Schroeder, 2001). In such conditions, accuracy may be traded for time savings, and decision-making heuristics may need to be employed (Tversky & Kahneman,
1974).
Humans use a number of heuristics when making decisions in situations where there are time constraints, as well as incomplete knowledge and a bound on computing abilities. Three well-known decision-making heuristics that may impact the error identification process are:
- Representativeness: The probability of event B being of type A is evaluated by the degree to which B resembles A (Tversky & Kahneman, 1974). This, unfortunately, neglects the prior probability of the type A event occurring in the world. Without knowledge of past system performance, a human supervisor in an SMU domain may be apt to overestimate the likelihood of unlikely errors, due to their similarity with available system data.
- Availability: The probability of an event is based on the ability to retrieve similar events from memory (Tversky & Kahneman, 1974). Decision-makers are inclined to believe that an event is more likely to happen in the world if that event can be easily retrieved, although this ease of retrieval may not accurately reflect the true probability of occurrence. As error identification in SMU intentional domains is difficult, this decision-making bias could negatively impact error source identification, with the supervisor basing identification on availability instead of collecting data that confirms or refutes the believed error source.
e Fast and frugal: A subclass of decision-making heuristics that employ a minimum of time and computation to make judgments (Todd & Gigerenzer, 2000). Fast and frugal heuristics limit the search through options using stopping rules, one of the most basic of which is one-reason decision-making, where the selection between choices is based on a single metric. This is likely to be employed during error identification in situations with LTA, and would be particularly detrimental to error source selection in times of LSR. If the human supervisor were to use sensor data as the metric for error selection, inaccurate sensor data could result in incorrect error identification.
Humans employ decision-making heuristics as coping mechanisms, reducing complex tasks to more simple judgments (Tversky & Kahneman, 1974). These heuristics are therefore quite useful, as they allow for time and computational savings and often produce results that are good enough. Sometimes, however, the employment of heuristics can lead to severe reasoning errors. If these errors occur in non-critical environments, then the repercussions are not as far reaching. For example, if a student bases team selection for a project on how well candidates represent the "ideal" teammate, consequences from a bad team member selection will only be felt for the duration of the project, resulting in limited annoyance and frustration. If a human supervisor in a complex environment (e.g. nuclear power generation, aviation) employs bad judgment, however, negative consequences can be much farther reaching, and may include loss of system integrity and human life.
Error identification in SMU domains, as previously discussed, is difficult due to the high level of complexity and uncertainty in these environments. As the consequences of poor decision-making in critical HSC domains can be grave, it is crucial that a decision-support tool be provided to assist the human through the error identification process during error resolution. While the functions supported by such a tool were discussed in Section 2.6.1, with a focus on information acquisition and organization, how this tool will provide support has yet to be determined.
Decision-making heuristics often involve subjective assessments of probabilities, with inaccuracies sometimes resulting. Specifically looking at error identification in SMU domains, heuristics could result in the incorrect identification of an error source. In order to prevent (or
limit) incorrect error identifications, historical error occurrence data could be collected by a decision-support tool and presented to the supervisor, providing them with real probabilistic data. This error likelihood data would assist the supervisor in framing the current error using concrete measures, as opposed to subjective, heuristic-based judgments, which can lead to judgment errors. The error likelihood data could be collected by the automated decision-support tool and presented to the supervisor as part of an organized display. The likelihood data could then be aggregated with other available system cues to guide the supervisor in identifying the most likely source of error.
This compilation of error probabilities is similar to the Probability Risk Assessment (PRA) approach (Kirwan, 1992), or the more focused Human Reliability Assessment (HRA) approach (Gertman & Blackman, 1994), where the likelihood of potential system or human failures is quantified and used to predict how frequently each event will occur. These approaches are used to assess the safety of a system, often before the system has been constructed, and therefore, the error likelihood values are usually best estimates. For the envisioned decision-support tool in the alternative checklist, the error likelihoods could be derived from historical error occurrence data, providing a more accurate picture of the actual error landscape. A description of the algorithm that would be needed to collect, analyze and calculate these error likelihoods is outside the
current scope of this research.
Even if accurate probabilistic data is collected and provided as part of the decision-support tool, humans are poor at interpreting probabilistic information (Tversky & Kahneman, 1974). If error likelihood data were to be included in the alternative checklist system as part of a decision-support tool during error identification, an intuitive display method of presenting that information to the human supervisor would need to be developed. The following subsection discusses the benefits of such a graphical representation, as well as potential options for representing the error likelihood data.
2.6.3. Visualization of error likelihoods
In order to prevent potential errors in reasoning resulting from the utilization of decision-making heuristics, a decision-aid tool incorporating probabilistic data could be developed as part of an
alternative checklist. This tool would lend computing power and supply much-needed knowledge to decision-makers. The need to develop an intuitive decision aid for the supervisor is paramount to ensure that the addition of probabilistic data to the decision-making task does not overwhelm the supervisor. As visualizations take advantage of the natural abilities of the human vision system, they continue to be the best method to communicate data to human operators (Schroeder, Martin, & Lorensen, 2006).
Visualizations are graphical representations of data or concepts that support decision-making (Ware, 2004). An appropriately designed visualization minimizes the cognitive complexity of a task (Guerlain, Jamieson, Bullemer, & Blair, 2002) and takes advantage of ecological perception, allowing users to directly perceive relationships within presented data (Gibson, 1979). In the case of probabilistic error data, it is important that users are able to compare and contrast the relative likelihoods of all possible errors quickly so that they can utilize this information in error source selection. In developing a graphic to represent the probabilistic error data, two key characteristics of the data need to be embodied: 1) hierarchical information, conveying the categorization of errors within a system (e.g., mechanical failures, automation errors, etc.) and, 2) the relative likelihoods of each system error.
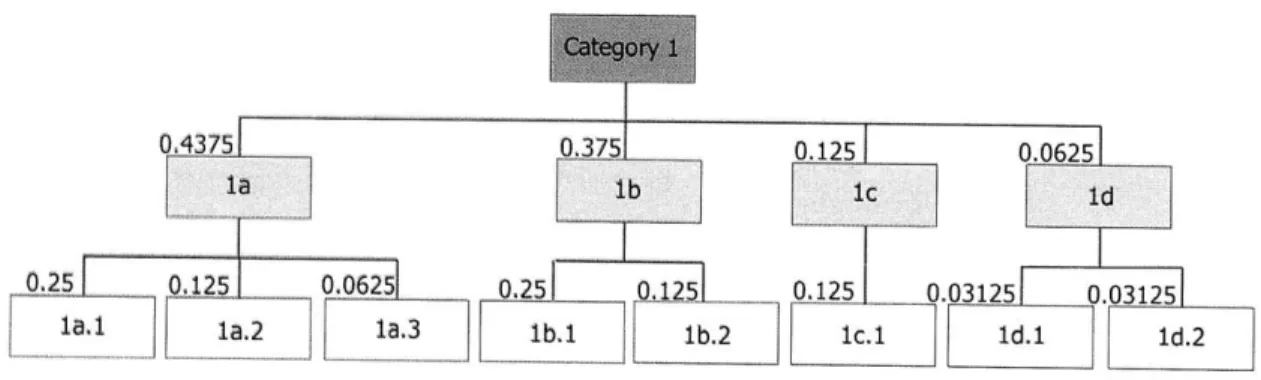
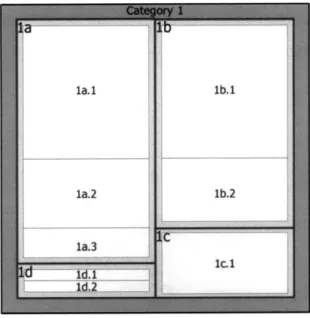
Many graphical representations of likelihood data could convey both of these characteristics. Three options, namely tree structures, treemaps, and multi-level pie charts, are presented below. Each graphical representation is demonstrated using a generic error hierarchy that groups system errors into overall categories and subcategories, and includes associated error likelihood data, as summarized in Table 1.
An example error hierarchy can be demonstrated using the HSC domain of aviation and the overall error category Landing. This category can be divided into subcategories, including Mechanical Failure, Fuel Shortage, and Human Error. These subcategories would then include all related errors; an engine failure would fall into the Mechanical Failure subcategory, while forgetting to lower landing gear would fall into the Human Error subcategory. Each error during landing could have an error likelihood associated with it, based on historical event occurrence.
Table 1: Generic error hierarchy with associated likelihood values.
Overall category Subcategories Errors Likelihoods
Error la.1 0.25
Subcategory la Error la.2 0.125
Error la.3 0.0625
Error Ib.1 0.25
Error Category 1 Subcategory lb
Error lb.2 0.125 Subcategory Ic Error lc.1 0.125 Error 1d.1 0.03125 Subcategory ld Error ld.2 0.03125
Tree structures
The most basic graphical representation for depicting hierarchical data is a tree structure that starts with the overall error category at the top of the visualization. This root node is broken down into child nodes, or subcategories of errors, which are then broken down into actual error types or events. While the example hierarchical structure referenced in Table 1 and graphically depicted in Figure 5 only contains three levels, there is no limit on the number of levels of data that can be represented using a tree structure. Tree structures have been used in different tasks within many different fields, including operations research, computer science, business management, biology, and linguistics.
While probabilistic data could be textually listed at each node to indicate the likelihood of occurrence for each error or category of errors, this representation would not intuitively convey the relative likelihoods of each error and would require data integration and increased mental workload on the part of the human supervisor. As well, the probabilistic breakdown for all errors in the overall error category is difficult to discern from such a representation. Due to the required data integration when using this representation, the tree structure graphic is not a viable option for the decision-support tool as part of error identification in the alternative checklist.
Figure 5: Decision tree visualization.
Treemaps
A treemap (Human-Computer Interaction Lab, 2003) is a graphical representation that depicts a hierarchical tree through the repeated subdivisions of a rectangular shape into nested rectangles. The outer rectangle represents the root of the tree, or the overall error category. This rectangle is divided into its children, or error subcategories, which can then be divided into error events or sources. Once again, while the example hierarchy from Table 1 has only three levels, this division of rectangles could continue, and multiple levels of data could be conveyed. As each further layer of data subdivides the space even firther, however, there often needs to be a limit on the number of levels of data depicted. Treemaps have been commonly utilized in the fields of business and portfolio management for presenting both high-level overviews and low-level details of stock market activity (Cable, Ordonez, Chintalapani, & Plaisant, 2004; Smart Money, 2010).
In a treemap, each node or rectangle has an area proportional to a specific dimension of the data. For the generic error hierarchy data from Table 1, this dimension would be the associated error likelihood data, with the size of each rectangle representing the probability associated with each system error. By using object size to represent magnitude (in this case likelihood), the human observer can directly perceive that the larger rectangle is greater than the smaller rectangle, and therefore, immediately comprehend the likelihood data being conveyed (Guerlain et al., 2002).
The treemap resulting from the generic hierarchy data is shown in Figure 6. As both the hierarchical and likelihood aspects of the error data can be depicted using this graphical representation, it is a potential option for the error identification support tool.
Figure 6: Treemap visualization.
Multi-level pie charts
In the multi-level pie chart depiction (Andrews & Heidegger, 1998; Stasko, Catrambone, Guzdial, & McDonald, 2000), the root of the hierarchical tree, or overall error category, is shown as the center of a pie chart. The next level of the tree, the error subcategories, is shown as the first layer of the pie chart, with the final layer of the pie chart representing the error events or sources. As with the other graphical representations, the pie chart graphic is capable of showing many hierarchical layers of data, but has been limited to three in the generic error hierarchy used for example purposes (Table 1). Like the tree structure, the pie chart graphic grows outwards with the addition of layers, unlike the treemap. The pie chart graphic is similar to the treemap representation, however, in that it inherently conveys a further dimension of the data: proportionality. In the case of the error data, this proportionality is likelihood. Each layer of the pie chart graphic can be seen as representing 100 percent probability, and therefore, the size of each error slice in the pie chart is directly proportional to its error likelihood. Once again, by representing magnitude (or likelihood) data through the size of the object, the human observer can directly perceive this information (Guerlain et al., 2002).