Improving the Explicit Prediction of Freezing Rain in a Kilometer-Scale
Numerical Weather Prediction Model
AGNIESZKABARSZCZ
Meteorological Services of Canada, Environment and Climate Change Canada, Dorval, Quebec, Canada JASONA. MILBRANDT
Meteorological Research Branch, Environment and Climate Change Canada, Dorval, Quebec, Canada JULIEM. THÉRIAULT
Department of Earth and Atmospheric Sciences, Université du Québec à Montréal, Montreal, Quebec, Canada (Manuscript received 15 September 2017, in final form 13 February 2018)
ABSTRACT
A freezing rain event, in which the Meteorological Centre of Canada’s 2.5-km numerical weather pre-diction system significantly underpredicted the quantity of freezing rain, is examined. The prepre-diction system models precipitation types explicitly, directly from the Milbrandt–Yau microphysics scheme. It was de-termined that the freezing rain underprediction for this case was due primarily to excessive refreezing of rain, originating from melting snow and graupel, in and under the temperature inversion of the advancing warm front ultimately depleting the supply of rain reaching the surface. The refreezing was caused from excessive collisional freezing between rain and graupel. Sensitivity experiments were conducted to examine the effects of a temperature threshold for collisional freezing and on varying the values of the collection efficiencies between rain and ice-phase hydrometeors. It was shown that by reducing the rain–graupel collection effi-ciency and by imposing a temperature threshold of258C, above which collisional freezing is not permitted, excessive rain–graupel collection and graupel formation can be controlled in the microphysics scheme, leading to an improved simulation of freezing rain at the surface.
1. Introduction
Forecasts of the precipitation types at the surface for winter storms have important impacts on several aspects of society, including ground transportation, aviation, and public safety. The near-surface temperatures in winter storms can often be close to 08C and thus various types of precipitation—liquid, solid, or mixtures—can exist (Stewart 1992). Climatological studies have shown that in the vicinity of the 08C isotherm precipitation from several types, such as rain, freezing rain, ice pellets, or snow, can occur, one after another or mixed together (Cortinas et al. 2004). The different precipitation types can interact and lead to the formation of other types (Stewart et al. 2015). Hence, for such weather events the prediction of surface precipitation types by numerical weather prediction
(NWP) models is very challenging but important given the potentially high impact.
Most large-scale NWP systems, those with horizontal grid spacing of 10–20 km or larger, use relatively simple single-phase cloud/precipitation parameterizations and thus provide little or no information about the type of precipitation at the surface. Precipitation-type diagnostic schemes must therefore be used.Benjamin et al. (2016)
provide a summary of the different types of diagnostic schemes that have been used for large-scale models and categorize them as either algorithmic approaches (e.g.,
Ramer 1993;Baldwin et al. 1994) or statistical approaches (e.g., Bourgouin 2000; Manikin 2005). Many weather centers now run kilometer-scale NWP systems that use more complex, mixed-phase microphysics schemes that provide more detail about the types and characteristics of in-cloud hydrometeors and precipitation reaching the surface. To varying degrees, depending on the complexity of the scheme, the microphysics parameterization may be Corresponding author: Jason A. Milbrandt, jason.milbrandt@
canada.ca
DOI: 10.1175/WAF-D-17-0136.1
Ó 2018 American Meteorological Society. For information regarding reuse of this content and general copyright information, consult theAMS Copyright Policy(www.ametsoc.org/PUBSReuseLicenses).
able to simulate some of the important processes that occur in nature in the vicinity of 08C and that ultimately affect surface precipitation types. For NWP systems with such schemes, it becomes possible to exploit the in-formation from the microphysics parameterization and employ an ‘‘explicit’’ diagnostic scheme, using the direct hydrometeor fields from the microphysics scheme as a ‘‘first guess’’ and then applying postprocessing to de-termine the precipitation type (e.g.,Benjamin et al. 2016;
Ikeda et al. 2017), or to simply use the explicit pre-cipitation type directly from the microphysics (e.g.,
Milbrandt et al. 2016).
The Meteorological Services of Canada (MSC) imple-mented a high-resolution (2.5-km horizontal grid spacing) NWP system in 2014, referred to as the High Resolution Deterministic Prediction System (HRDPS). During the winter of 2014/15, Canada experienced an abnormally high number of freezing rain events. HRDPS, which de-termines precipitation types explicitly, directly from the microphysics scheme, often underpredicted the quantity and horizontal extent of freezing rain, indicating a sys-tematic problem in this regard. Some aspects related to this were later improved, including a modification of the boundary layer scheme, which prevented temperature inversions from being eroded too quickly. Nevertheless, the system still seemed to underpredict freezing rain. In this study, a case of freezing rain underprediction by HRDPS has been identified. Detailed examination and sensitivity experiments related to the model microphysics scheme have been conducted in order to identify and correct the source of this systematic problem.
The paper is organized as follows.Section 2 summa-rizes the case study associated with the underprediction of freezing rain and the performance of MSC’s NWP systems.Section 3demonstrates that the problem with HRDPS was related to the predicted surface pre-cipitation type from the microphysics scheme.Section 4
summarizes two sets of microphysics-related sensitivity studies that were conducted to examine the problem. Concluding comments are found insection 5.
2. Overview of the case a. Synoptic overview
On 24–25 December 2014, a low pressure system af-fected the province of Quebec, Canada, and the Maritime Provinces, producing high amounts of freezing rain. At 0000 UTC 24 December 2014, the 250-hPa-level circula-tion was characterized by a relatively large-scale trough over the central plains of the United States and a ridge over New York state and Quebec. As the day progressed, the trough moved eastward, and a strong jet streak developed
at that level. At the surface, a low pressure system over Alabama deepened during the day and progressed north-eastward. The evolution of the surface system between 1200 UTC 23 December and 0000 UTC 25 December 2014 is summarized inFig. 1, which shows the mean sea level pressure and 1000–500-hPa thicknesses from the MSC regional analyses. The development of the system was supported by dynamical forcing. There was upper-level divergence associated with the left-exit region of the jet streak and positive vorticity advection at 500 hPa. Also, at 850 hPa, there was warm-air advection in front of the low pressure system and cold-air advection behind.
The upper-air soundings observed in the vicinity of the warm front show a temperature inversion at the 800-hPa level (Fig. 2), which indicates that the environment was favorable to the formation of freezing rain. The freezing rain amounts and duration reported during this event are shown in Fig. 3. The surface stations used in this study include METARs and surface synoptic observations (SYNOPs), as well as reports from special observers as reported in an MSC weather summary bulletin issued on 25 December 2014 by the Quebec Storm Prediction Center. Note that certain stations only report hourly precipitation types, but not amounts. Special observers often report total amounts of precipitation, but rarely give an indication about the event duration. The warm frontal system passed southern Ontario at 1200 UTC 23 December 2014 (Fig. 1a). It produced 1–4 mm of freezing precipitation over the Montreal area (CYUL) in 3 h. The two locations where the most freezing rain was reported by special observers are situated just north of the warm front, in the vicinity of Charlevoix (CWIS) and Cap-Chat (CWSG) (Fig. 3). They reported precipitation totals of 22 and 23 mm, respectively. These two stations are situated close to the St. Lawrence River valley, which is known to enhance the formation of freezing rain, through the pressure-driven channeling of cold air from the northeast near the surface (Carrera et al. 2009). Other stations reported on average between 1 and 15 mm of freezing rain. On average, the observations over the province of Quebec reported between 25 and 35 mm of rain (excluding freezing rain) from 23 to 25 December 2014. Stations in eastern Quebec (the Gaspé Peninsula and the lower North Shore) reported up to 65 mm of rain. Regions in northern Quebec [La Grande Riviere (CYGL) and Wabush Airport (CYWK)] remained in the cold air during the passage of this system and received 15 and 30 cm of snow, respectively.
b. Performance of operational NWP models
1) DESCRIPTION OF FORECAST SYSTEMS
The MSC runs various operational NWP systems. The two systems that are used for short-term (days 1 and 2)
numerical guidance are the Regional Deterministic Prediction System (RDPS) and HRDPS, and are based on the Global Environmental Multiscale (GEM) fore-cast model (C^oté et al. 1998;Girard et al. 2014). Both systems provide 48-h forecasts four times daily. The domains of these systems are shown inFig. 4. The RDPS has a horizontal grid spacing of 10 km and a 4D ensemble–variational upper-air data assimilation cycle (4DEnVAR). HRDPS has a grid spacing of 2.5 km and is downscaled from the RDPS, whereby the RDPS analysis provides the initial conditions for HRDPS and the RDPS forecast integrations provide the lateral boundary conditions. Details for these systems can be
found inMailhot et al. (2006)andCaron et al. (2015)for RDPS and inMilbrandt et al. (2016)for HRDPS.
RDPS uses theSundqvist et al. (1989) scheme to pa-rameterize large-scale condensation, whose precipitation is combined with implicit schemes for shallow and deep convection and for boundary layer clouds. To determine the precipitation type for the total precipitation (from all schemes), the sounding-based diagnostic algorithm of
Bourgouin (2000)is applied. This method compares the energy available within the warm layer aloft (T. 08C) and the cold layer below (T, 08C). Based on threshold values, determined with observations, freezing rain, ice pellets, or a mixture of freezing rain and ice pellets are FIG. 1. Regional analysis from MSC valid at (a) 1200 UTC 23 Dec, (b) 0000 UTC 24 Dec, (c) 1200 UTC 24 Dec,
and (d) 0000 UTC 25 Dec 2014. The black lines are mean sea level pressures every 4 hPa. The 1000- and 1020-hPa contours are highlighted in bold. The brown lines are the 1000–500-hPa thickness lines every 6 dam. The brown-shaded area is bounded by the 534- and 540-dam contours. The low and high pressure centers (values in hPa) are drawn in blue. The blue stars indicate the locations of the Caribou (KCAR) and Sept-^Iles (CYZV) upper-air soundings shown inFigs. 2a and 2b, respectively.
diagnosed. In HRDPS, the majority of the precipitation comes from the Milbrandt and Yau (2005a,b) micro-physics scheme (hereafter referred to as MY2), which is a two-moment bulk scheme with six distinct hydro-meteor categories: cloud, rain, ice, snow, graupel, and hail. The particle size distribution for each category is
represented by a three-parameter gamma function. The prognostic equations for the mass mixing ratio and the number concentration of particles are the third and ze-roth moments of that size distribution. Based on the hydrometeor types and other information (e.g., surface temperature), the microphysics scheme also explicitly FIG. 2. Observed upper-air soundings at (a) KCAR at 1200 UTC 24 Dec 2014 and (b) CYZV at 0000
UTC 25 Dec 2014.
FIG. 3. Observed (a) amounts (mm) and (b) durations (h) of freezing rain from 23 to 25 Dec 2014. The size of the circle is scaled proportional to the amount and duration. The observations are from METAR, SYNOP stations, and special observers. (Note that not all stations report both amount and duration.)
partitions precipitation into various precipitation types, including freezing rain.
2) EVALUATION OF MODEL FORECASTS
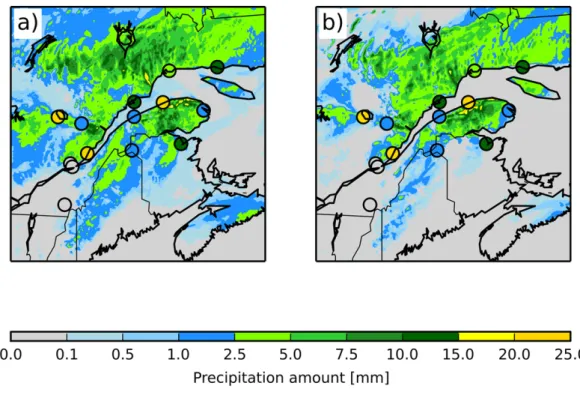
The two operational NWP modeling systems led to different types of precipitation and amounts over Que-bec during the 24–25 December 2014 freezing rain event. The forecasted 36-h accumulated precipitation and freezing rain amounts for the storm from the two NWP systems are shown in Fig. 5. Both models fore-casted 15–50 mm of accumulated precipitation within 36 h with a similar spatial distribution (Figs. 5a,b). However, RDPS (Fig. 5c) and HRDPS (Fig. 5d) showed very different freezing precipitation amounts and pat-terns. For example, RDPS predicted up to 15 mm whereas HRDPS predicted less than 2.5 mm. Neither of the operational systems forecasted the observed maxi-mum amount of freezing rain received (.20 mm) on the north shore of the St. Lawrence River (CWIS and CWSG). Overall, RDPS reasonably predicted the freezing rain amounts; in contrast, HRDPS severely underpredicted the freezing rain amounts over the entire region.
3. Identification of the problem a. Preliminary analysis
It was initially suspected that the reason for the missed forecast of freezing rain in HRDPS was related to the MY2 microphysics scheme and/or its approach to de-termining precipitation types. To test this hypothesis, experimental reruns of the case were conducted using different combinations of the condensation/diagnostic
precipitation-type schemes. To reduce computational costs for test simulations, the case was first rerun on a reduced domain (seeFig. 4). The mean sea level pressure (Fig. 6a) and the precipitation rates (Figs. 6b,c) at 36-h integration time of the reduced-domain rerun, referred to as CTR, and the original real-time HRDPS run were compared. The CTR simulation reproduces the HRDPS run quite closely. Therefore, the following simulations were done with the reduced domain. A complete list of all simulations discussed is found inTable 1.
To test if some aspect of the microphysics scheme was responsible for the freezing rain underprediction, the CTR simulation was rerun (EXP1) but MY2 was replaced with the Sundqvist scheme, with precipitation types diagnosed using the Bourgouin diagnostic algo-rithm, similar to the approach used in RDPS. Freezing rain amounts in EXP1 (Fig. 7a) are much different from the amounts from CTR (Fig. 5d) and are in fact similar to the observed amounts (Fig. 3a) and the RDPS run (Fig. 5c). The missed forecast of the freezing rain in HRDPS (and CTR) was clearly related to the model microphysics.
To narrow down the source of the freezing rain ‘‘bust’’ forecast, EXP2 was run, where the MY2 scheme was used but the precipitation types used the Bourgouin diagnostic, overriding the explicit types given by MY2 directly. The total freezing rain amounts from EXP2 (Fig. 7b) are similar to those of EXP1 (Fig. 7a) and RDPS (Fig. 5c). This indicates that the problem in HRDPS/CTR does not lie in the amount of precipitation that was forecast by the model, but rather is a result of the partitioning into types by the MY2 scheme. b. Vertical distribution of hydrometeors and
microphysical processes
To examine further the causes of the underpredicted freezing rain in CTR, a representative vertical cross section passing perpendicular to the warm front (i.e., the 850-hPa isotherms) was chosen to examine precipitation types as well as the formulation of processes at the surface and aloft (Fig. 8). The cross section is valid at 1800 UTC 24 December 2014. At this time, the north-eastern half of the cross section, over the Gaspé region, was located under a temperature inversion, where the temperature at the 850-hPa level was warmer than 08C while the surface temperatures were colder than 08C. Cross sections of hydrometeor mass mixing ratios are shown inFig. 9. Both cloud and rain are mainly present within the melting layer; cloud droplets are present above the melting layer whereas rain is present under it. Beneath the melting layer, the rain mass mixing ratio decreases with decreasing altitude, with only trace values just above the surface. Significant amounts of rain FIG. 4. Computational domains of RDPS, HRDPS, and the CTR
are also present over the melting layer up to a temper-ature of 228C, with trace amounts up to 2308C (not shown in the figure). Although ice crystals and snow are mainly present above and ahead of the melting layer, there is an area under the melting layer where they are also present. Where the inversion is very thin, snow does not completely melt and falls below the melting layer. Graupel is present ahead, over, in, and under the melt-ing layer. Under the temperature inversion aloft (i.e., at approximately 925 hPa), the condensate is composed mainly of graupel, which accumulates at the surface at a rate of 1–3 mm h21. Because of a lack of representation of ice pellets in the microphysics scheme, graupel is present in areas where ice pellets are expected.
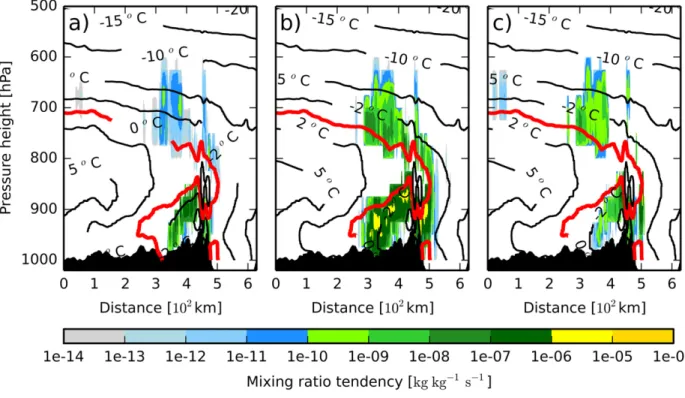
Cross sections of microphysical process rates for processes that we suspect may have ultimately contrib-uted to the underprediction of freezing rain are shown in
Fig. 10. These include the rates of ‘‘three-component freezing,’’ the process by which collisions occur between rain and ice, snow, or graupel to produce a (possibly)
new ice-phase category [ice, snow, graupel, or hail; see Milbrandt and Yau (2005b) for details]. Three-component freezing below the melting layer acts as a sink for rain and is often a source for graupel; complete refreezing of the rain that originates from the melting of ice-phase precipitation within the warm air implies a removal of the freezing rain that would otherwise have reached the surface. Note that at these relatively warm temperatures under the melting layer raindrops do not spontaneously freeze, and evaporation is not a significant sink for supercooled water. The dominant of these collisional freezing terms inFig. 10is the rain– graupel collision, which produces graupel. At 1800 UTC 24 December 2014, the total rate of change of the mass mixing ratio due to collisions over the entire do-main is 53 1022kg kg21s21for rain–graupel collisions, 53 1023kg kg21s21for rain–snow collisions, and 83 1024kg kg21s21for rain–ice collisions for the CTR run. The collisional freezing of rain–graupel is clearly the dominant of these terms during this simulation and FIG. 5. The 36-h accumulated precipitation (mm) forecasts by (a) RDPS and (b) HRDPS. Total freezing rain
amounts forecast by (c) RDPS and (d) HRDPS. The 36-h period starts at 0000 UTC 24 Dec and finishes at 1200 UTC 25 Dec 2014. The colored dots indicate observed precipitation amounts.
appears to be responsible for the refreezing and the prevention of freezing rain at the surface.
4. Sensitivity tests with the microphysics scheme a. Temperature threshold for three-component
freezing
Given that the apparent excessive rain–graupel colli-sional freezing has a detrimental effect on the simulation of freezing rain in CTR, an approach is tested to limit this process in the microphysics scheme and to reduce the suppression of freezing rain in the model. A tem-perature threshold has been introduced, above which collisional freezing is not permitted to occur. MY2 does not track the temperature of particles but assumes they have the same temperature as the ambient air. In reality the temperature of a falling drop is not necessarily equal to the surrounding air temperature since its temperature is the result of the latent and sensible heat fluxes. When supercooled drops fall into a refreezing layer near the surface, they take some time to cool after falling through the melting layer above it. Since raindrops have a ter-minal fall speed ranging from approximately 1 to 10 m s21, depending on their size, they may fall a con-siderable distance before reaching an equilibrium tem-perature with the environment. Therefore, they may not be supercooled when the air temperature is slightly be-low 08C. This is different for colder drops (T , 2158C) mainly because the probability for ice nuclei to be acti-vated is higher (Pruppacher and Klett 2012). Also, there is no partially melted ice-phase category in MY2, which
implies a limit in the scheme’s ability to model pre-cipitation types near 08C. The MY2 scheme does not have a distinct hydrometeor category representing ice
TABLE1. List of simulations.
Run Description (changes with respect to CTR) CTR Downscaling of the full HRDPS model to an
experi-mental grid
EXP1 Sundqvist microphysics and Bourgouin precipitation types EXP2 MY2 microphysics and Bourgouin precipitation types EXP3A Threshold freezing temperature for collisional
freezing5 08C
EXP3B Threshold freezing temperature for collisional freezing5 218C
EXP3C Threshold freezing temperature for collisional freezing5 228C
EXP3D Threshold freezing temperature for collisional freezing5 238C
EXP3E Threshold freezing temperature for collisional freezing5 248C
EXP3F Threshold freezing temperature for collisional freezing5 258C
EXP3G Threshold freezing temperature for collisional freezing5 278C
EXP3H Threshold freezing temperature for collisional freezing5 298C EXP4A Erg5 0.8, Eri5 Ers5 1 EXP4B Erg5 0.6, Eri5 Ers5 1 EXP4C Erg5 0.4, Eri5 Ers5 1 EXP4D Erg5 0.2, Eri5 Ers5 1 EXP4E Erg5 0, Eri5 Ers5 1 EXP5A Erg5 1, Eri5 Ers5 0.8 EXP5B Erg5 1, Eri5 Ers5 0.6 EXP5C Erg5 1, Eri5 Ers5 0.4 EXP5D Erg5 1, Eri5 Ers5 0.2 EXP5E Erg5 1, Eri5 Ers5 0
FIG. 6. (a) Mean sea level pressure (hPa) from HRDPS and the CTR model runs, and precipitation rates from (b) HRDPS and (c) the CTR run after 36 h of integration valid at 1200 UTC 25 Dec 2014.
pellets. Instead, the scheme creates graupel particles (rimed snow) when liquid droplets collide with ice-phase particles under the melting layer. It was shown in a laboratory that the temperature of ice pellet particles remains close to 08C, once their ice shell is formed and until they are completely frozen (Hindmarsh et al. 2003). Therefore, the temperature of the particle is not equal to the air temperature. The temperature threshold
for collisional freezing is thus a simple way of adapting to these limitations, which may otherwise cause exces-sive freezing of rain at relatively warm temperatures.
The CTR simulation was rerun with several different collisional freezing threshold temperatures, ranging from 08 to 298C (experiment set 3; see Table 1).
Figure 11shows the percentage of precipitation at the surface from freezing rain and graupel along a segment
FIG. 8. (a) The 850-hPa geopotential heightf and temperature T and (b) surface precipitation rates with the surface 08C isotherm from CTR, valid at 1800 UTC 24 Dec 2014. The red line denotes the location of the cross section. The section between the two red markers represents a subsection of the cross section used to generate
Figs. 11and14.
FIG. 7. Comparison of the T1 36 h accumulations of freezing rain valid at 1200 UTC 25 Dec 2014 from (a) EXP1 and (b) EXP2. Colored dots represent observed freezing rain amounts.
of the cross section for various temperature thresholds. Near the surface, 90% of the precipitation is composed of freezing rain (Fig. 11a) and/or graupel (Fig. 11b), while the rest is composed of snow and ice crystals (not shown). The amount of freezing rain increases with de-creasing (higher negative) values of the threshold tem-perature. With a freezing threshold temperature colder than258C, significant amounts of graupel are present only over an area smaller than 30 km. This corresponds to the area where the warm layer is shallowest, with a
maximum temperature close to 08C (Fig. 11c). It also corresponds to the region where the air temperature in the refreezing layer is the coldest (i.e.,25.88C).
In general, freezing rain is combined with very little graupel (,10% of the total precipitation rate).Figure 11b
shows that small amounts of graupel (,10% of total precipitation) are still present in areas where the col-lisional freezing is suppressed through a threshold temperature. This illustrates that the presence of even small quantities of graupel is sufficient to reduce FIG. 9. Vertical cross sections of (a) cloud, (b) rain, (c) snow, (d) ice, and (e) graupel mass mixing ratios (kg kg21) from the CTR run along the cross section shown inFig. 8valid at 1800 UTC 24 Dec 2014. The black contour lines are isotherms (8C). The red line is the 08C isotherm. The cross section is approximately oriented from southwest to northeast.
significantly (or eliminate) the simulated amounts of freezing rain due to excessive glaciation through the collisional freezing process. For example, in the region located between 100 and 150 km, the minimum tem-perature under the melting layer is between 238 and258C (Fig. 11c). With a threshold temperature for freezing colder than258C, there is no collisional freez-ing allowed in this area. The precipitation is then com-posed of 90% freezing rain and less than 10% graupel. When the threshold temperature is increased to238C, collisional freezing occurs, and the precipitation at the surface is composed of 90% graupel and 0%–10% freezing rain. Therefore, the presence of 10% of grau-pel is sufficient to glaciate over 90% of the precipita-tion through collisional freezing, when this processed is active.
Freezing rain can be formed in various ways, through both liquid-phase and ice-phase processes (Rauber et al. 2000;Stewart et al. 2015). Rain and ice particles can thus coexist outside of the refreezing layer, and collisional freezing processes are therefore not restricted to oc-curring within this layer. For example, in our experi-ment, trace amounts of supercooled water are found with an environment temperature of2308C. We there-fore compare the effects of a threshold temperature for
collision freezing with and without a melting layer.
Figure 12 shows the domain-integrated mean pre-cipitation rates and surface areas of freezing rain and graupel as a function of the temperature threshold. A trend of increasing freezing rain and decreasing graupel precipitation rate with a decreasing temperature threshold is shown inFig. 12a. The results are broken down according to the presence or absence of a melting layer. For all of the experiments, over 88% of freezing rain and 20% of graupel falls under the melting layer. More than 80% of the surface area receiving freezing rain and graupel is not located under the melting layer (Fig. 12b). Therefore, freezing rain and graupel are present and can interact when there is no melting layer aloft. However, the effects of a temperature thresh-old outside of the melting layer are minimal, as most of the supercooled liquid water is found under the melting layer.
The temperature threshold conditions have a more significant impact on the freezing rain precipitation rates at high environment temperatures than at low environ-ment temperatures. The variation of freezing rain rates at the surface as a function of temperature thresholds exhibits a plateau at cold temperature thresholds. For example, the difference between the domain-integrated FIG. 10. Vertical cross sections of collision freezing terms from the CTR run along the cross section shown inFig. 8valid at 1800 UTC 24 Dec 2014. Rate of change of mass mixing ratio between hydrometeor categories due to collisions between (a) rain–ice, (b) rain–graupel, and (c) rain–snow (kg kg21s21). The black contour lines are isotherms (8C). The red line is the 08C isotherm. The cross section is approximately oriented from southwest to northeast.
total freezing rain amount produced with a threshold temperature of 08 and 218C is 0.6 kg kg21 and be-tween278 and 298C is much less (0.01 kg kg21). This is explained by the fact that there is more supercooled rain present in the atmosphere at warmer temperatures. The domain-integrated total mass mixing ratios of super-cooled liquid rain and graupel within isothermal atmo-spheric layers are shown in Fig. 13. The amount of
supercooled liquid water decreases with decreasing air temperature. This is true for all experiments, regardless of the collision freezing threshold temperature. Finally, as the threshold temperature decreases, the amount of supercooled liquid water increases, and the amount of graupel decreases. At warm air temperatures, there is more available supercooled liquid water for riming and collision freezing processes, which are two sources of graupel in MY2.
Overall, large amounts of freezing rain can be sup-pressed through excessive collisional freezing. In our experiment, over 90% of the precipitation is glaciated because of this process. This is more than the maximum 60% reduction suggested by the theoretical study of
Carmichael et al. (2011). The excessive collisional freezing can be controlled by imposing a lower tem-perature threshold such as 258C, which accounts for drop freezing at colder air temperatures, as reported in a laboratory study (Hindmarsh et al. 2003). It is also consistent with the temperature threshold of268C for the freezing onset of liquid drops, found by Reeves (2016) in a study using a spectral bin microphysics model, and258C found byTobin and Kumjian (2017)in an observational study.
b. Collection efficiencies
Another aspect that may have contributed to exces-sive collisional freezing in CTR and the suppression of freezing rain at the surface is the parameter value for the collection efficiencies between rain and the ice-phase particles. The collection efficiency parameters are Eri
(rain–ice), Ers(rain–snow), and Erg (rain–graupel). In
the MY2 scheme version used in HRDPS/CTR, these parameters all have constant values of 1. However, for some combinations of collector and collectee particle sizes the collection efficiencies can be much less that 1 (Pruppacher and Klett 2012). The MY2 values used, therefore, may be another reason for the excessive gla-ciation due to rain–graupel collisions in CTR.
In the next set of experiments (sets 4 and 5; seeTable 1), the impact of the collection efficiency is examined. This set of sensitivity tests was conducted in two steps. First, Ers and Eri were held with constant values of 1
while Ergwas varied systematically (EXP4). In the
sec-ond set of experiments, the collection efficiencies of rain–snow (Ers) and rain–ice (Eri) collisions were varied,
while keeping the rain–graupel efficiency (Erg) equal to
1 (EXP5). The impact on freezing rain at the surface from EXP4 is summarized in Fig. 14. The larger the rain–graupel collection efficiency, the narrower (wider) is the area of freezing rain (graupel) at the surface. For this cross section, a collection efficiency of 0.4 allows freezing rain to reach the surface. Freezing rain then FIG. 11. Percentage of the instantaneous precipitation rate
rep-resented by (a) freezing rain and (b) graupel, as a function of the collisional freezing temperature threshold, along the subsection of the vertical cross section, as shown inFig. 8. (c) The maximum temperature of the air aloft (Tmax) and the minimum air
temper-ature below the inversion layer (Tmin) along the cross-section. The
cross section is valid at 1800 UTC 24 Dec 2014 and approximately oriented from southwest to northeast.
represents over 90% of the total precipitation reaching the surface, along the cross section. This result is specific to the location of this cross section. The ice and snow precipitation rates are very small compared to the other
precipitation types under the inversion (,1% for ice and,30% for snow). The ice category exhibits a small variation as a function of the rain–graupel collection efficiency. This is because the rain–graupel collisions FIG. 12. Domain-integrated (a) mean precipitation rates (mm h21) and (b) surface area (km2) receiving freezing
rain (FZRA) and graupel, valid at 1800 UTC 24 Dec 2014, as a function of a temperature threshold. Results are stratified for grid points associated with and without a melting layer aloft.
FIG. 13. Domain-integrated total amounts of the mass mixing ratio (kg kg21) of (a) supercooled liquid water and (b) graupel located within isothermal layers of the atmosphere. The results are shown for three experiments with various temperature thresholds for collisional freezing, valid at 1800 UTC 24 Dec 2014. [Note that the scales differ in (a) and (b).]
transform supercooled rain droplets into graupel. As a result, less rain is available to collide with ice. A higher rain–graupel collection therefore favors a higher ice precipitation rate under the melting layer. Note that the percentage of freezing rain would be different at another location within the domain because it depends on the atmospheric conditions and precipitation characteristics. The percentage variation of precipitation at the sur-face, along the cross section, for various rain–snow and rain–ice collection efficiency values (not shown), in-dicates that these two terms have no significant effect on the surface precipitation rates. This is not surprising given that rain–ice and rain–snow collision rates are relatively small compared in CTR compared to rain– graupel collisions (Fig. 10).
To verify that these results can be generalized over the domain, the total accumulated amounts of freezing rain between 0000 and 1800 UTC 24 December 2014 are shown inFigs. 15a and 15b. Over the entire domain, the variation of Erg has a significant impact on the
accu-mulated freezing rain amounts and surface area that received freezing rain (Figs. 15a,c). The higher (lower) the collection efficiency, the lower (higher) are the freezing rain accumulations, and the smaller (larger) is the surface area associated with freezing rain. However, the variation of the ice–rain and snow–rain (Eri, Ers)
collection efficiencies has little impact on the accumu-lation of freezing rain nor on the total surface area (Figs. 15b,d).
Overall, these results show that for this case study the forecasted freezing rain amounts are very sensitive to the rain–graupel three-component freezing term in the MY2 scheme but not to the rain–ice and rain–snow three-component freezing terms. Also, the greatest im-pact of the collection efficiency is under the melting layer because most of the freezing rain is located in this area.
5. Discussion and conclusions
The Meteorological Services of Canada’s 2.5-km NWP system, HRDPS, had suffered from a systematic underprediction of freezing rain for several winter storm events following the implementation of the system in 2014. An example freezing rain ‘‘bust’’ case was exam-ined in this study to identify and examine the root cause of this underprediction. It was shown that the problem was caused by a nearly complete refreezing of rain be-low the melting layer associated with the warm front due to excessively high rates of rain–graupel collisions in the MY2 bulk microphysics scheme. To mitigate the problem, a temperature threshold for collisional three-component freezing was implemented. Sensitivity tests were conducted for different threshold values. It was shown that this ad hoc approach is effective in reducing the collisional freezing of rain and increasing the amount of freezing rain reaching the surface. The sen-sitivity to the bulk collection efficiencies used in MY2 was also examined, and it was found that reducing the rain–graupel collection efficiencies resulted in reducing the excessive glaciation due to rain–graupel interactions and increased the freezing rain at the surface.
Although this study focused on a single case, the MY2 scheme used in the real-time HRDPS system was modified, based on a similar set of tests to those pre-sented here, to include the temperature threshold for three-component freezing, with a set value of 258C (Milbrandt et al. 2016). After this modification, the FIG. 14. Percentages of the instantaneous precipitation rate
represented by (a) freezing rain, (b) graupel, (c) ice, and (d) snow as functions of the collection efficiency of rain by graupel (Erg),
along the subsection of the vertical cross section, as shown inFig. 8. The cross section is valid at 1800 UTC 24 Dec 2014 and approxi-mately oriented from southwest to northeast.
freezing rain forecasts for HRDPS improved systemat-ically, with the problem of missed freezing rain forecasts removed (A. Rahill, MSC, 2017, personal communica-tion). Thus, while the solution of imposing a tempera-ture threshold to control the collisional freezing of rain with graupel is ad hoc, it has been found to be effective at improving the freezing rain simulations/forecasts us-ing the MY2 microphysics scheme in HRDPS.
Nevertheless, the results presented suggest that there may be some inherent limitations to the bulk formula-tions for the collection between rain and graupel in MY2. The scheme solves the collection equation ana-lytically (Milbrandt and Yau 2005b). As such, a single bulk collection efficiency is applied, rather than making use of size-dependent values. Also, a single bulk value
for the terminal fall speed differences between rain and graupel must be used. This approximation may be ac-ceptable for two interacting hydrometeor categories with considerably different ranges of fall speeds, such as hail and cloud droplets, but it is problematic for rain and graupel whose fall speeds are quite similar. Thus, the parameterization of rain–graupel collection based on the analytic solution to the collection equation may simply constitute an inherent weakness in the MY2 scheme, which may always be problematic for situations that are sensitive to this process, such as the one illustrated in this study. Ultimately, it is probably better to parameterize the rain–graupel collection process by precomputing the solutions in bin space and using lookup tables at run time (Thompson et al. 2008;Morrison and Milbrandt 2015), FIG. 15. (a),(b) Freezing rain accumulation and (c),(d) surface area with an accumulation of freezing rain in
excess of 0.1 mm integrated over the domain from 0000 to 1800 UTC 24 Dec 2014. For (a),(c), Ergis systematically
varied while Eriand Ers5 1. For (b),(d), Eriand Ersare systematically varied while Erg5 1.
thereby avoiding the necessity of making simplifications and approximations to obtain an analytic solution.
Another limitation of MY2 (and most microphysics schemes) is that partially melted ice/snow is not accounted for. As ice-phase hydrometeors melt, the melted mass in MY2 is immediately transferred to the rain category; that is, in effect it is assumed that all melted ice mass is instantly shed. This assumption is unrealistic for melting snow since in nature a melting snowflake retains most of its melted liquid as it is melting until which point it collapses into a raindrop (Mitra et al. 1990). Alternatively, if a partially melted crystal or ag-gregate falls back into cold air (i.e., under the temper-ature inversion), it may refreeze and form an ice pellet. Indeed, in the classical case of the passage of a warm front, one typically observes surface precipitation in the form of snow ahead of the front, followed by ice pellets and then freezing rain under the inversion, and then rain behind the front (Hanesiak and Stewart 1995; Zerr 1997). Since partially melted ice is not modeled in MY2, the proper simulation of ice pellet formation is not pos-sible. As shown, graupel (commonly referred to as snow pellets) may form under the inversion from collision freezing and so forecasting of ‘‘ice pellets’’ (graupel at the surface) may be possible with MY2, but the correct physics of ice pellet formation from refreezing of partially melted ice is lacking. Ideally, the proper explicit simulation of precipitation types at tempera-tures near 08C, and in particular in the presence of temperature inversions, requires that the microphys-ics parameterization has the capacity to model the liquid fraction on partially melted ice, as inThériault and Stewart (2010), as well as the ability to account correctly for the process of collisional freezing of rain with ice-phase particles.
Acknowledgments. This research was funded in part by the Fond nature et technologies du Québec (Grant 2013-NC-165536) and the Natural Sciences and Engi-neering Research Council of Canada Discovery Grant (Grant 418374-2012-RGPIN). All model simulations were done using the supercomputing resources of En-vironment and Climate Change Canada.
REFERENCES
Baldwin, M., R. Treadon, and S. Contorno, 1994: Precipitation type prediction using a decision tree approach with NMC’s meso-scale eta model. Preprints, 10th Conf. on Numerical Weather Prediction, Portland, OR, Amer. Meteor. Soc., 30–31. Benjamin, S. G., J. M. Brown, and T. G. Smirnova, 2016: Explicit
precipitation-type diagnosis from a model using a mixed-phase bulk cloud–precipitation microphysics parameteriza-tion. Wea. Forecasting, 31, 609–619,https://doi.org/10.1175/ WAF-D-15-0136.1.
Bourgouin, P., 2000: A method to determine precipitation types. Wea. Forecasting, 15, 583–592, https://doi.org/10.1175/1520-0434(2000)015,0583:AMTDPT.2.0.CO;2.
Carmichael, H. E., R. E. Stewart, W. Henson, and J. M. Thériault, 2011: Environmental conditions favoring ice pellet aggre-gation. Atmos. Res., 101, 844–851,https://doi.org/10.1016/ j.atmosres.2011.05.015.
Caron, J. F., T. Milewski, M. Buehner, L. Fillion, M. Reszka, S. Macpherson, and J. St-James, 2015: Implementation of deterministic weather forecasting systems based on ensemble– variational data assimilation at Environment Canada. Part II: The regional system. Mon. Wea. Rev., 143, 2560–2580,https:// doi.org/10.1175/MWR-D-14-00353.1.
Carrera, M. L., J. R. Gyakum, and C. A. Lin, 2009: Observational study of wind channeling within the St. Lawrence River valley. J. Appl. Meteor. Climatol., 48, 2341–2361, https://doi.org/ 10.1175/2009JAMC2061.1.
Cortinas, J. V., Jr., B. C. Bernstein, C. C. Robbins, and W. J. Strapp, 2004: An analysis of freezing rain, freezing drizzle, and ice pellets across the United States and Canada: 1976–90. Wea. Forecasting, 19, 377–390, https://doi.org/10.1175/1520-0434(2004)019,0377:AAOFRF.2.0.CO;2.
C^oté, J., S. Gravel, A. Méthot, A. Patoine, M. Roch, and A. Staniforth, 1998: The operational CMC–MRB Global Environmental Mul-tiscale (GEM) model. Part I: Design considerations and formu-lation. Mon. Wea. Rev., 126, 1373–1395,https://doi.org/10.1175/ 1520-0493(1998)126,1373:TOCMGE.2.0.CO;2.
Girard, C., A. Plante, M. Desgagné, R. McTaggart-Cowan, J. C^oté, M. Charron, and M. Roch, 2014: Staggered vertical dis-cretization of the Canadian Environmental Multiscale (GEM) model using a coordinate of the log-hydrostatic-pressure type. Mon. Wea. Rev., 142, 1183–1196, https://doi.org/10.1175/ MWR-D-13-00255.1.
Hanesiak, J. M., and R. E. Stewart, 1995: The mesoscale and microscale structure of a severe ice pellet storm. Mon. Wea. Rev., 123, 3144–3162,https://doi.org/10.1175/1520-0493(1995) 123,3144:TMAMSO.2.0.CO;2.
Hindmarsh, J. P., A. B. Russell, and X. D. Chen, 2003: Experi-mental and numerical analysis of the temperature transi-tion of a suspended freezing water droplet. Int. J. Heat Mass Transfer, 46, 1199–1213, https://doi.org/10.1016/S0017-9310(02)00399-X.
Ikeda, K., M. Steiner, and G. Thompson, 2017: Examination of mixed-phase precipitation forecasts from the High-Resolution Rapid Refresh model using surface observations and sounding data. Wea. Forecasting, 32, 949–967,https://doi.org/10.1175/WAF-D-16-0171.1. Mailhot, J., and Coauthors, 2006: The 15-km version of the Canadian Regional Forecast System. Atmos.–Ocean, 44, 133–149,https:// doi.org/10.3137/ao.440202.
Manikin, G. S., 2005: An overview of precipitation type fore-casting using NAM and SREF data. 21st Conf. on Weather Analysis and Forecasting/17th Conf. on Numerical Weather Prediction, Washington, DC, Amer. Meteor. Soc., 8A.6,
https://ams.confex.com/ams/WAFNWP34BC/techprogram/ paper_94838.htm.
Milbrandt, J. A., and M. K. Yau, 2005a: A multimoment bulk mi-crophysics parameterization. Part I: Analysis of the role of the spectral shape parameter. J. Atmos. Sci., 62, 3051–3064,
https://doi.org/10.1175/JAS3534.1.
——, and ——, 2005b: A multimoment bulk microphysics param-eterization. Part II: A proposed three-moment closure and scheme description. J. Atmos. Sci., 62, 3065–3081,https://doi.org/ 10.1175/JAS3535.1.
——, S. Bélair, M. Faucher, M. Vallée, M. L. Carrera, and A. Glazer, 2016: The pan-Canadian High Resolution (2.5 km) Deterministic Prediction System. Wea. Forecasting, 31, 1791– 1816,https://doi.org/10.1175/WAF-D-16-0035.1.
Mitra, S. K., O. Vohl, M. Ahr, and H. R. Pruppacher, 1990: A wind tunnel and theoretical study of the melting behavior of at-mospheric ice particles. IV: Experiment and theory for snowflakes. J. Atmos. Sci., 47, 584–591,https://doi.org/10.1175/ 1520-0469(1990)047,0584:AWTATS.2.0.CO;2.
Morrison, H., and J. A. Milbrandt, 2015: Parameterization of cloud microphysics based on the prediction of bulk ice particle prop-erties. Part I: Scheme description and idealized tests. J. Atmos. Sci., 72, 287–311,https://doi.org/10.1175/JAS-D-14-0065.1. Pruppacher, H. R., and J. D. Klett, 2012: Microphysics of Clouds
and Precipitation. Springer, 714 pp.
Ramer, J., 1993: An empirical technique for diagnosing precipitation type from model output. Preprints, Fifth Int. Conf. on Aviation Weather Systems, Vienna, VA, Amer. Meteor. Soc., 227–230. Rauber, R. M., L. S. Olthoff, M. K. Ramamurthy, and K. E. Kunkel,
2000: The relative importance of warm rain and melting processes in freezing precipitation events. J. Appl. Meteor., 39, 1185–1195,https:// doi.org/10.1175/1520-0450(2000)039,1185:TRIOWR.2.0.CO;2. Reeves, H. D., 2016: The uncertainty of precipitation-type
obser-vations and its effect on the validation of forecast precipitation type. Wea. Forecasting, 31, 1961–1971,https://doi.org/10.1175/ WAF-D-16-0068.1.
Stewart, R. E., 1992: Precipitation types in the transition region of winter storms. Bull. Amer. Meteor. Soc., 73, 287–296,https:// doi.org/10.1175/1520-0477(1992)073,0287:PTITTR.2.0.CO;2.
——, J. M. Thériault, and W. Henson, 2015: On the characteristics of and processes producing winter precipitation types near 08C. Bull. Amer. Meteor. Soc., 96, 623–639,https://doi.org/ 10.1175/BAMS-D-14-00032.1.
Sundqvist, H., 1988: Parameterization of condensation and asso-ciated clouds in models for weather prediction and general circulation simulation. Physically-Based Modelling and Sim-ulation of Climate and Climatic Change, M. E. Schlesinger, Ed., Springer, 433–461.
——, E. Berge, and J. E. Kristjánsson, 1989: Condensation and cloud parameterization studies with a mesoscale numerical weather prediction model. Mon. Wea. Rev., 117, 1641–1657,https://doi.org/ 10.1175/1520-0493(1989)117,1641:CACPSW.2.0.CO;2. Thériault, J. M., and R. E. Stewart, 2010: A parameterization of
the microphysical processes forming many types of winter precipitation. J. Atmos. Sci., 67, 1492–1508,https://doi.org/ 10.1175/2009JAS3224.1.
Thompson, G., P. R. Field, R. M. Rasmussen, and W. D. Hall, 2008: Explicit forecasts of winter precipitation using an improved bulk microphysics scheme. Part II: Implementation of a new snow parameterization. Mon. Wea. Rev., 136, 5095–5115,
https://doi.org/10.1175/2008MWR2387.1.
Tobin, D. M., and M. R. Kumjian, 2017: Polarimetric radar and surface-based precipitation-type observations of ice pellet to freezing rain transitions. Wea. Forecasting, 32, 2065–2082,
https://doi.org/10.1175/WAF-D-17-0054.1.
Zerr, R. J., 1997: Freezing rain: An observational and theoretical study. J. Appl. Meteor., 36, 1647–1661,https://doi.org/10.1175/ 1520-0450(1997)036,1647:FRAOAT.2.0.CO;2.