HAL Id: hal-01844418
https://hal.univ-lorraine.fr/hal-01844418
Submitted on 19 Jul 2018
HAL is a multi-disciplinary open access
archive for the deposit and dissemination of
sci-entific research documents, whether they are
pub-lished or not. The documents may come from
teaching and research institutions in France or
L’archive ouverte pluridisciplinaire HAL, est
destinée au dépôt et à la diffusion de documents
scientifiques de niveau recherche, publiés ou non,
émanant des établissements d’enseignement et de
recherche français ou étrangers, des laboratoires
A Stochastic Methodology for 3D Cave Systems
Modeling
Vincent Henrion, Jeanne Pellerin, Guillaume Caumon
To cite this version:
Vincent Henrion, Jeanne Pellerin, Guillaume Caumon. A Stochastic Methodology for 3D Cave Systems
Modeling. Eighth Geostatistical Geostatistics Congress, 2008, Santiago, Chile, Chile. pp.525-533.
�hal-01844418�
A STOCHASTIC METHODOLOGY FOR 3D CAVE SYSTEM
MODELING
VINCENT HENRION , JEANNE PELLERIN and GUILLAUME CAUMON
Gocad Research Group, ENSG-CRPG, Nancy Universit´e, France.
ABSTRACT
This paper describes a methodology to generate stochastic models of 3D cave systems. It combines existing geostatistical techniques, namely object-based and variogram-based geostatistics. The first is used to simulate Discrete Fracture Networks (DFNs) which in addition of bedding planes drive the development of karst features. The discontinuity network and the matrix are jointly discretized into a graph of connectivities. Preferential flow paths determining the topology of the cave system are then extracted using graph search algorithms. The distance map to the selected paths is used to conditioned the spatial extent of karst features, i.e., the probability to simulate karst decreases moving away from “dissolution paths”. Eventually, multiple realizations of a distance cutoff are generated with Sequential Gaussian Simulation to perturb the distance function. Resulting models efficiently reproduce the spatial variability of karst features in term of geometry and their spatial organization in term of connectivity.
INTRODUCTION
Carbonate formations exposed to dissolution processes are characterized by extreme spatial heterogeneity due to the presence of complex networks of highly permeable features (e.g. karst conduits and cavities) embedded in less permeable fractured rocks. Cave and paleocave system considerably impact the fluid circulation respectively in groundwater and petroleum reservoirs, involving many engineering issues. For water resources management, karstified aquifers are particularly vulnerable to contaminants which can be transported over wide distances with no or little dilution (Bakalowicz, 2005). In oil and gas reservoirs, paleokarsts form extended brecciated and fractured zones which act either as seals or conduits depending on the type of cementation (Loucks, 1999). Static and dynamic modeling of such reservoirs calls for properly capturing the spatial organization of karst network and the geometry of individual conduits, i.e.
generating realistic 3D karst systems.
The construction of such inter-connected tortuous conduits conditionally to possibly dense observation data is a difficult task. Pixel-based multi-point simulation could be used for this purpose, provided an adequate training image, but is known to break the continuity of large objects, which is a problem for karst networks where connectivity is paramount.
A stochastic methodology has been developed for creating complex and realistic 3D cave system models that honor field data. It can also accommodate many different observations such as sources and sinks location, water level, bed thicknesses and other subsurface observations. These elements provide constraints for karst conduits location and their geometry. This approach generate multiple equally probable models of 3D cave systems which topology and geometry is consistent with structural geology and other constraints.
APPROACH OVERVIEW
Karst originates from the dissolution of rock by groundwaters. Water preferentially circulates in largest apertures usually fractures and bedding planes. Dissolution causes their enlargement and conduits progressively develop around these preferential flow paths and get organized in a connected karst network. Although the proposed method does not quantitatively model the dissolution process governing karst development, it attempts to create realistic 3D cave systems by stochastic simulations of the main factors driving the topology and geometry of karst conduits.
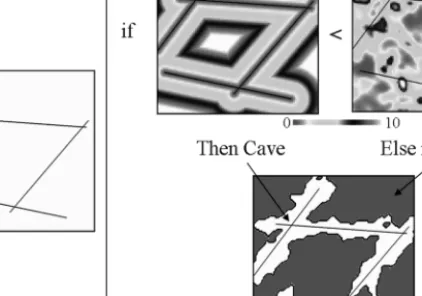
Since fractures and bedding planes act as drivers for karst development, the first step of the method consists in generating 3D models of rock discontinuity surfaces consistent with structural geology of the considered region. Karst processes are however highly selective, enlarging only some of the original discontinuities and developing a conduit network progressively organized in the same way as fluvial systems. For this reason, the fracture network and the matrix are discretized into a graph of connectivities allowing extraction of preferential flow paths using graph search algorithms. This screening test attempts to keep only the most favorable paths for karst development depending on their connectivity and transmissibility; some data conditioning may also come into play at this stage, for instance by selecting the cave outlet or sinkhole as a root for the graph search algorithms. Once the “dissolution paths” have been extracted, the main problem is to simulate the spatial extent of open cave passages. For this purpose, the Euclidean distance map related to the selected flow paths is computed, and used as a constraint for karst development. Then, multiple realizations of a correlated random noise, termed distance cutoff, are generated using sequential Gaussian simulation. The composition, given a criterion, of the distance map and of the distance cutoff produce final images of karst systems (Figure 1).
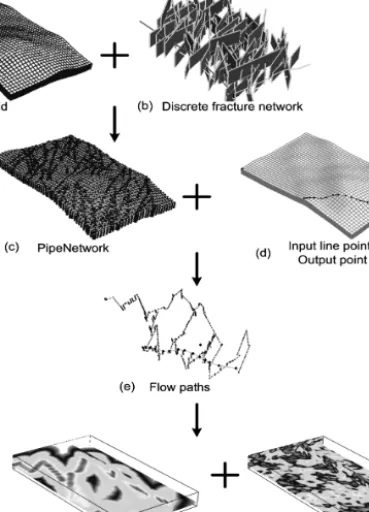
The whole procedure involves the following steps (Figure 2):
STOCHASTIC MODELING OF CAVE SYSTEM
Figure 1: The distance map to “dissolution paths” (a) is computed (b) and compared to a random distance cutoff (c), to produce realistic cave geometry (d)
discrete fracture network;
– Property modeling of the resulting 3D grid (porosity, permeability) and of the discontinuity network (porosity, permeability, aperture);
– Discretization of rock matrix and discontinuities into a graph of connectivities;
– Integration of data on the graph, such as field data, source and sink location, water level;
– Preferential flow paths extraction using a graph search algorithm;
– Computation of the Euclidean distance map to flow paths in every points of the 3D grid;
– Sequential Gaussian simulation of a distance cutoff;
– Composition of the distance map and of the distance cutoff to indicate the presence of karst or matrix.
The implementation of this methodology is detailed in the following sections. RESULTS AND DISCUSSION
Structural modeling
Karst formation results from near-surface processes where the two major controls are chemical kinetics and discharges. Chemical kinetics are set by a combination of climate, mineralogy, CO2concentration, water table and interaction with other
dissolved components. Although these factors can vary considerably, both spatially and temporally, it is unlikely that their variations have a first order impact on flow paths in a given carbonate terrain. In contrast, there are great variations in discharge from one flow path to another and this is the main control over which early flow
Figure 2: (a) Structural model and (b) Discrete Fracture network. (c) Discretization into a graph of connectivities (PipeNetwork) and (d) definition of input and output point. (e) extraction of preferential flow paths. (f) Distance function to the selected paths and (g) random cutoff distance simulation. (f) Realization of final cave system
STOCHASTIC MODELING OF CAVE SYSTEM
paths might evolve into cave passages.
Palmer (1991) estimates that 99% of mapped continental cave passages are initiated along fractures and bedding-planes. However, only a few fractures can evolve into open conduits because karst processes are highly selective, enlarging only the most favorable discontinuities. At an early stage, fissures are narrow and the flow is dispersed among many different routes, each of them with its own overall hydraulic gradient, mean fissure width, flow length and mean discharge. The influence of these parameters have been investigated by geochemical and digital models (see e.g. Dreybrodt and Gabrovsek (2003)). Results show that the ideal situation for cave passage development is large fissures with short flow paths, high discharge and steep hydraulic gradient, embedded in thick layers. These facts are important because they can aid in the prediction of cave passages distribution and geometry. For these reasons a structural model of the area of interest is build integrating all available subsurface informations.
Discrete Fracture Networks are simulated using object-based simulation (Stoyan et al., 1995) and constitute with bedding planes the discontinuity network around which karst will preferentially develop. A key issue from a geostatistical perspective, is the inference of the parameters of the stochastic models (fracture density, orientation and size). All sources of informations (wells, seismic, analog outcrops) provide a first evaluation about such fracture density and fracture properties. None of these attributes are however well constrained in the inter-wells space due to the poor seismic resolution and the clustering of 1D data along wells. To more realistically model the spatial distribution and the properties of fractures, a variety of numerical techniques have been developed. Basically, we can distinguish geometrical approaches and geomechanical one. The first consist to look for geometrical attributes revealing zone of intense deformation (structural curvature, distance to major fault) and to relate these to fracture density (Lisle, 1994; Fischer and Wilkerson, 2000; Ouenes, 2000). Geomechanical approaches consist to compute stress and strain field which is then combined with a failure criterion to infer fracture orientation and likely locations (Bourne et al., 2000; Mac´e et al., 2005; Maerten et al., 2006; Maerten and Maerten, 2006; Moretti, 2008). Geomechanical approaches compared to geometrical indicators have the quality to be based on physical laws that govern geological deformation, which make them more reliable to predict fracture attributes. The resulting fracture orientation and density models are then used to inform further stochastic simulations of DFN.
Extraction of preferential flow paths
The 3D structural model is discretized into a graph of connectivities, namely a PipeNetwork, using the method developed by Vitel and Mallet (2005). It basically consist in a set of segments linking a set of nodes which structure derives directly from the representation of a grid based on connectivities. The PipeNetwork discretization provide a flexible framework to handle complicated geological configurations as in fractured reservoirs. The matrix and the DFN are jointly discretized. The resulting PipeNetwork is a completely unstructured graph constituted of three SubPipeNetworks : one for the matrix, another for the fractures
and the last one for the connections between matrix and fractures. Fracture nodes and matrix nodes hold their own set of properties (porosity, permeability, fracture apertures) and pipes hold hydraulic properties (conductivity, transmissibility). A screening test with graph search algorithm is then performed on the PipeNetwork in order to extract preferential flow paths where dissolution is more likely to occur. Path research is made between input and output points representing sinks and sources of the karstic system. Graph search algorithms finds the least-cost path between given nodes using a distance-plus-cost function heuristic to determine the order in which nodes of the graph are visited. In the example presented here (Figure 2(e)), the inverse of the hydraulic property stores on the pipes of the graph have been used.
Field data conditioning
Another issue of cave system modeling is the conditioning to field observations. Data can come from many different sources (wells, exploration survey, geophysics) and provide a set of points where karst or matrix appears.
The conditioning to observations revealing karst or matrix occurrence is treated during the search path step. The data are ported on nodes of the PipeNetwork in order to force preferential flow paths to pass close of karst observations and away from host rock observations. To ensure karst conditioning, the distance between a flow path and the data point must not exceed the minimal size of conduits to be simulated. Hence, a node of the PipeNetwork is randomly chosen in the minimal distance neighborhood of the data point and is included as a conditioning node in the path search (Figure 3). On the contrary, to respect matrix data, the distance between a path and data point must exceed the maximal size of karst conduits. For this, the transmissibility of the segments linking nodes in the maximal distance neighborhood of the data are reduced to prevent any path from crossing these nodes (Figure 3).
In addition to hard data conditioning, the structure of the PipeNetwork allows to easily integrate secondary information by transposing it in a coherent manner on the nodes and pipes properties. For instance the distribution of karst, and particularly the maximum depth at which karst can develop, is strongly linked to the water level of the phreatic table. Base level of karst system realizations can be constrained by modifying transmissibilities on the pipes with a multiplier coefficient, greater ones along the water level and lower ones below this surface.
Geostatistical simulation of karst conduits
The previously extracted preferential flow paths define the spatial organization of the cave system. The last step of the methodology consist in simulating the geometry of conduits. The distance to the flow network can be seen as a map of the potential for karst development, i.e. the probability to have karst facies decreases with distance to flow paths and becomes null beyond a given threshold. This linear distance function is perturbed by simulating a random cutoff distance with variogram-based geostatistics. The resulting geometry of karst conduits depend
STOCHASTIC MODELING OF CAVE SYSTEM
Figure 3: The neighboring nodes of each data points are searched in the graph. Left: Conditioning of host rock data point: the transmissibility value is reduced for all the segments. Right: Conditioning of karst data: one point is randomly selected and its karst value is set to 1.
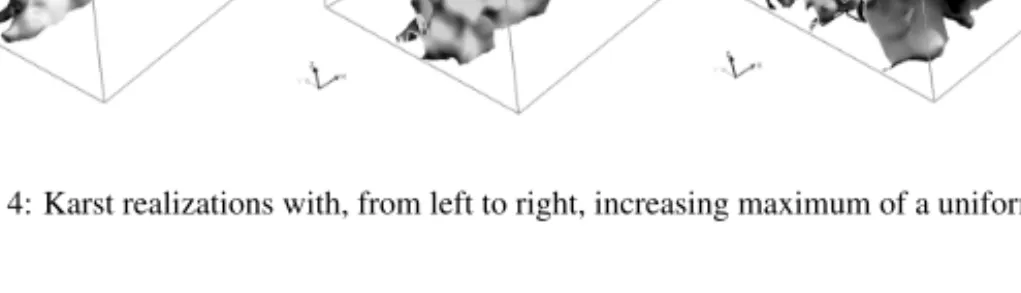
on the probability density function (PDF) and the variogram model of the cutoff used to inform the stochastic simulation. The first control the final dimensions of the conduits (Figure 4) while the parameters of the variogram model control the undulations of the karst surface (Figure 5). Resulting 3D karst models present realistic spatial organization and geometry of individual conduits. Moreover they can be easily conditioned by secondary informations. For instance conduits size usually increase toward the source of the karstic system. This could be rendered by using kriging with a trend model. Another possibility is to use co-kriging to localy correlate the conduit extent to bed thickness.
Figure 4: Karst realizations with, from left to right, increasing maximum of a uniform PDF.
Figure 5: Karst realizations with, from left to right, increasing ranges of a Gaussian variogram model.
CONCLUSION
The methodology proposed in this paper enables to render the complexity of cave systems. Their organization in space is addressed through 3D geological modeling and object-based simulation of discrete fracture networks. Special care must be brought to the simulation of multiple fracture networks because it provides the first order variability of the proposed simulation workflow. Indeed preferential flow paths along fractures and bedding planes are retrieved from an appropriate discretization of the structural model and defines the final topology of the cave systems. The simulation of cave passages around the fracture gives the second order variability. The simple idea of the method, based on geostatistical perturbation of the distance to the preferential flow paths, proves its potential to produce different and complex geometries of cave passages.
ACKNOWLEDGMENTS
This research was performed in the frame of the GOCAD research project. The companies and universities members of the GOCAD consortium are acknowledged for their support.
REFERENCES
Bakalowicz, M (2005). Karst groundwater: a challenge for new resources. In Hydrogeology Journal, vol. 13, no. 1, pp. 148–160.
Bourne, S, Brauckmann, F, Rijkels, L, Stephenson, B, Weber, A and Willemse, E (2000). Predictive modelling of naturally fractured reservoirs using geomechanics and flow simulation. In 9th Abu Dabi International Petroleum Exhibition and Conference (ADIPEC 0911). pp. 1–10. Dreybrodt, W and Gabrovsek, F (2003). Basic processes and mechanisms governing the evolution of
karst. In Speleogenesis and Evolution of Karst Aquifers, The Virtual Scientific Journal, vol. 1, no. 1, p. 26.
Fischer, M and Wilkerson, M (2000). Predicting the orientation of joints from fold shape : Results of pseudo-three-dimensional modeling and curvature analysis. In Geology, vol. 28, no. 1, pp. 15–18.
Lisle, R (1994). Detection of zones of abnormal strains in structures using gaussian curvature analysis. In AAPG Bulletin, vol. 78, no. 12, pp. 1811–1819.
Loucks, R (1999). Paleocave Carbonate Resvoirs: Origins, Burial-Depth Modifications, Spatial complexity, and Reservoir Implications. In AAPG Bulletin, vol. 83, no. 11, pp. 1795–1834. Mac´e, L, Muron, P and Mallet, JL (2005). Integration of fracture data into 3D geomechanical modeling
to enhance fractured reservoirs characterization. In SPE Annual Technical Conference and Exhibition, Dallas, Texas, U.S.A., 9-12 October (SPE 95827). Dallas, Texas, U.S.A., pp. 1–9. Maerten, L, Gillepsie, P and Daniel, JM (2006). Three-dimensiona geomechanical modeling for
constraint of subseismic fault simulation. In AAPG Bulletin, vol. 90, no. 9, pp. 1337–1358. Maerten, L and Maerten, F (2006). Chronologic modeling of faulted and fractured reservoirs using
geomechanically based restoration: Technique and industry applications. In AAPG Bulletin, vol. 90, no. 8, pp. 1201–1226.
Moretti, I (2008). Working in complex areas: New restoration workflow based on quality control, 2d and 3d restorations. In Marine and Petroleum Geology, vol. in press, p. in press.
Ouenes, A (2000). Practical application of fuzzy logic and neural networks to fractured reservoir characterization. In Computers & Geosciences, vol. 26, pp. 953–962.
STOCHASTIC MODELING OF CAVE SYSTEM
Bulleetin, vol. 103, pp. 1–21.
Stoyan, D, Kendall, W and Mecke, J (1995). Stochastic Geometry and its applications. John Wiley & sons, New York.
Vitel, S and Mallet, JL (2005). A generic network for flow grids. In Proc. 25th Gocad Meeting, Nancy, France.