HAL Id: hal-02065589
https://hal-amu.archives-ouvertes.fr/hal-02065589
Submitted on 20 Feb 2020HAL is a multi-disciplinary open access archive for the deposit and dissemination of sci-entific research documents, whether they are pub-lished or not. The documents may come from teaching and research institutions in France or abroad, or from public or private research centers.
L’archive ouverte pluridisciplinaire HAL, est destinée au dépôt et à la diffusion de documents scientifiques de niveau recherche, publiés ou non, émanant des établissements d’enseignement et de recherche français ou étrangers, des laboratoires publics ou privés.
Feasibility of single-shot multi-level multi-angle diffusion
tensor imaging of the human cervical spinal cord at 7T
Aurélien Massire, Henitsoa Rasoanandrianina, Manuel Taso, Maxime Guye,
Jean-Philippe Ranjeva, Thorsten Feiweier, Virginie Callot
To cite this version:
Aurélien Massire, Henitsoa Rasoanandrianina, Manuel Taso, Maxime Guye, Jean-Philippe Ran-jeva, et al.. Feasibility of single-shot multi-level multi-angle diffusion tensor imaging of the hu-man cervical spinal cord at 7T. Magnetic Resonance in Medicine, Wiley, 2018, 80 (3), pp.947-957. �10.1002/mrm.27087�. �hal-02065589�
Feasibility of single-shot multi-level multi-angle diffusion tensor
imaging of the human cervical spinal cord at 7T
Aurélien Massire 1,2, Henitsoa Rasoanandrianina 1,2,Manuel Taso 1,2,3, Maxime Guye 1,
Jean-Philippe Ranjeva 1,2, Thorsten Feiweier 4, Virginie Callot 1,2
1 Aix-Marseille Univ, CNRS, AP-HM, CRMBM, Hôpital de la Timone, CEMEREM, Marseille,
France.
2 iLab-Spine - Laboratoire international associé - Imagerie et Biomécanique du rachis,
France - Canada.
3 Division of MRI Research, Department of Radiology, Beth Israel Deaconess Medical Center
& Harvard Medical School, Boston, MA, USA.
4 Siemens Healthcare GmbH, Erlangen, Germany.
Corresponding author :
Virginie Callot
CRMBM-CEMEREM, UMR 7339, CNRS - Aix-Marseille Université, Faculté de Médecine 27, bd Jean Moulin, 13385 Marseille Cedex 5, France.
virginie.callot@univ-amu.fr
Tel: +33491388465. Fax: +33491388461.
Abstract:
Purpose: Diffusion Tensor Imaging (DTI), which is frequently used to characterize microstructure impairments in many spinal cord diseases at clinical fields, may benefit from 7T investigations. Yet, it presents specific technical challenges, such as increased magnetic susceptibility-induced image distortions.
Methods: Eight healthy volunteers were scanned at 7T using a prototype diffusion multi-slice-multi-angle (MSMA) single-shot spin-echo EPI sequence developed to explore the whole cervical spinal cord while limiting the partial volume effects related to the cord curvature. To mitigate the increased susceptibility-induced distortions encountered at 7T, a reverse phase-encoding strategy was also used. Images acquired from C1-to-C7 were registered to the AMU40 template to automatically extract DTI metrics in GM/WM regions of
interest. Effects of B1+ inhomogeneities on the DTI metrics and repeatability of the
measurements were also investigated. Lastly, a DTI acquisition with a 400-µm in-plane resolution was acquired on one volunteer to push forward 7T potentialities.
Results: The MSMA sequence allowed accessing to high-resolution axial diffusion images sampling the whole cord within a single acquisition. DTI metrics were found in agreement with literature at lower field, stable along a 50-120% relative B1+ variation range, with a mean
inter-scan coefficient of variation of 8%. The twofold spatial-resolution increase of the additional DTI acquisition enabled main WM tracts visualization on a single-subject basis. Conclusion: Although C7-level imaging needs some improvement, this preliminary study shows that transverse 7T DTI of the whole cervical spinal cord is feasible, laying the groundwork for improved multi-parametric MR investigations and microstructure characterization of the spinal cord.
Key words:
Spinal cord; Ultra-high-field MRI; 7T; Diffusion tensor imaging; Multi-Slice-Multi-Angle acquisitions
Introduction:
Diffusion Tensor Imaging (DTI) consists in encoding water diffusion rate into the MR signal to derive indices considered as sensitive biomarkers for characterizing tissue microstructural abnormalities in pathologies (1). DTI is thus commonly used in clinical research at 3T to characterize microstructural impairments in various spinal cord (SC) diseases, including multiple sclerosis or cervical spondylotic myelopathy (2).
Yet DTI in the SC presents specific technical challenges such as physiological motion artifacts caused by cerebrospinal fluid (CSF) pulsation, image distortions due to local changes of magnetic susceptibility induced by surrounding bone structures, and partial-volume effect (PVE) contamination in the transverse plane due to the small cross-sectional dimensions of the cord (3). The natural curvature of the SC also generates PVE along its axis when dealing with contiguous transverse slab acquisition. Regarding this issue, the single-shot spin-echo echo-planar imaging (SS-SE-EPI) sequence, the reference technique to perform diffusion-weighted MRI (dMRI), can be modified to support multiple individual slice-group acquisitions with different orientations (i.e. MSMA: multi-slice-multi-angle). Whereas the majority of SC DTI studies (2,3) focused on one transverse slab (usually centered at C3 level), this MSMA strategy with individual slice positioning following the SC curvature allows investigating all cervical levels in a single acquisition, while ensuring minimum PVE contamination (4,5). Reduced field-of-view techniques (4,6–9) have also been proposed to further improve dMRI by reducing image distortions and in-plane PVE. Nevertheless, these MR sequences are usually not reported in MSMA configuration and are not widely available at 7T yet.
With 7T MRI, improved characterization of the pathological SC with quality high-resolution anatomical images is within reach (10–12) thanks to an increased signal-to-noise ratio (SNR), which can be traded to reach higher spatial resolution. In the framework of characterizing SC tissue diffuse alterations using multi-parametric studies at 7T, DTI of the whole cervical SC is a key component that should be investigated along with other quantitative MRI techniques (2). Yet only one recent study with reduced-FOV DTI was reported at 7T (13), with preliminary results at (0.6 mm)² in-plane resolution. Even the use of the SS-SE-EPI sequence has not reached extensive practice at 7T, with only a single report of DTI integrated in a multi-parametric study at the C3 level (14). Indeed, the increased static field inhomogeneities at 7T necessarily require dedicated approaches, such as reversed-phase-encoding-based methods (15), to correct for the increased magnetic susceptibility-induced image distortions.
In this work, high-resolution transverse DTI of the SC at all cervical levels is presented, relying on a monopolar SS-SE-EPI MSMA prototype sequence. Acquired
diffusion images were corrected for physiological motion, eddy currents and Gibbs artifacts, as well as magnetic-susceptibility-induced distortions. Variability between individuals, effects of B0 and B1+ inhomogeneities on DTI metrics evaluation and repeatability of the proposed
protocol were also assessed and discussed. To set future prospects for refined SC microstructure characterization, a DTI acquisition with a (0.4 mm)² in-plane resolution is additionally reported on a single volunteer. Overall, this study shows that transverse DTI covering the cervical SC levels from C1 to C7 at 7T is feasible, with some improvements needed for C7-level imaging, and could be used to complement anatomical and multi-parametric imaging of the SC.
Methods:
Eight healthy volunteers (2 men, 6 women; age 36±15 years) were scanned, with approval of the local Ethic Committee, in a whole-body actively-shielded research 7T system (Siemens Healthcare, Erlangen, Germany) equipped with a body gradient coil (SC72, maximal strength 70 mT/m, slew rate 200 T/m/s). Written consents were obtained prior to MR examinations. For RF transmission and reception, a prototype eight-channel transceiver coil array designed to cover cervical levels from C1 to C7 (Rapid Biomedical GmbH, Rimpar, Germany) was used. In transmit mode, an identical RF waveform is delivered to each of the eight elements after dividing the supplied power through a power splitter. The coil elements are spread on a curved saddle surface cradling the subject’s neck, as described in (14).
Data acquisition
System adjustments consisted in automated frequency adjustment, second-order B0
shimming (with physiological triggering) within a small volume covering the whole cervical SC (about 30x30x100 mm3) and voltage calibration. Additional manual B
0 shimming could
complement previous adjustments, so as to reach a full-width at half-maximum (FWHM) of the water peak in the order of 100 Hz. The voltage calibration was achieved using a 2D magnetization-prepared turbo-FLASH B1+ mapping sequence (16) with the following imaging
parameters: 7 sagittal slices, FOV: 256x256 mm², resolution: 1x1x5 mm3, acquisition time: 70
s. Nominal flip angle was always targeted between C2 and C3 levels. Typical time for total scan setup was 7 minutes, including B0 shimming and B1+ mapping.
A sagittal 2D T2-weighted Turbo Spin Echo (TSE) sequence (2.20 min, 0.6x0.6x2.2
mm3, 7 slices) was acquired and used as a precise localizer for positioning of transverse
slices. Transverse diffusion-weighted imaging was performed with a prototype monopolar SS-SE-EPI sequence enabling multiple independent slabs, with one slice positioned
mid-vertebra at each cervical level (7 levels, ranging from C1 to C7), perpendicular to the SC axis. Fat suppression was achieved by spectral saturation. The sequence parameters were the following: TE: 56 ms, FOV: 103x103 mm², acquisition matrix: 128x128, spatial resolution: 0.8x0.8x3 mm3, number of slices: 7, number of averages: 3, partial Fourier: 6/8. Acquisitions
were synchronized with finger pulse-oximeter signal so as to acquire data during the CSF quiescent phase (17) (prospective gating, no trigger delay, no navigator echo, acquisition window of approximately 400 ms, slice repartition of 2 maximum per cycle, over 4 cycles). Measurements were made with two b-values (0 and 800 s/mm2) and 20 independent
diffusion-encoding directions. All series were acquired with right-to-left phase-encoding direction (R>L) to enable parallel imaging acceleration (GRAPPA (18) reconstruction with a factor R=3) compatible with the coil geometry. The acquisition time with physiological gating was about 5-6 minutes depending on subject’s heart rate. An additional acquisition with identical parameters but opposite left-to-right (L>R) phase-encoding direction and b=0 s/mm2
was also performed (acquisition time of less than 1 minute).
Data processing
Using these two series, reverse phase-encoding-based distortion corrections were performed with FSL Topup (default parameters used, FSL v5.0, FMRIB, Oxford, UK) (15,19). Artifacts generated by Eddy currents produced during diffusion-encoding gradient application were corrected with FSL Eddy (20). Gibbs artifacts were removed using the local subvoxel-shifts (LSS) method (21) implemented in FSL (default parameters). Data denoising was performed using the overcomplete local principal component analysis (LPCA) method (22) implemented in MATLAB (R2015b, The Mathworks, Natick, MA, USA), assuming a ‘Rician’ noise distribution despite the use of parallel imaging. Diffusion metrics (λ┴ - Radial diffusivity;
λ// - Longitudinal diffusivity; FA - Fractional Anisotropy and MD - Mean Diffusivity) were
subsequently computed with FSL DTIFIT.
For quantitative data analysis, slice-by-slice affine and non-linear registrations of FA maps to the reciprocal (i.e. inverted contrast) AMU40 T2*-w average template (23) were
performed using FSL FLIRT and ANTs SyN (24) (cross-correlation cost function) respectively, and subsequently applied to all other DTI maps. Automated GM/WM segmentation was possible after the AMU40 GM/WM probabilistic atlases binarization
(threshold: 0.5, i.e. ≥50% probability to belong to the ROI of interest (23)). Three regions of interest (ROIs) were also selected: anterior GM horns (to reduce PVE in GM) as well as lateral “motor” WM (corticospinal and extrapyramidal tracts) and posterior “sensory” WM (gracile and cuneate tracts) extracted from the probabilistic WM tract atlas (25) (threshold: 0.5) , as implemented in the Spinal Cord Toolbox (26).
Reproducibility and B1+ inhomogeneities influence
To assess the influence of B1+ inhomogeneities encountered at 7T on DTI metrics
evaluation, relative B1+ values were first measured at each cervical level for all volunteers. To
put into perspective these results, a head-shaped phantom filled with gel (SAM V4.5BS, Speag, Zurich, Switzerland) was also scanned with the same B1+ mapping and
diffusion-weighted SS-SE-EPI sequences and using 8 different voltages (ranging from 145V to 295V) in order to sample significant B1+ variations. DTI data was denoised using the LPCA method
and DTI metrics were subsequently computed. One square ROI (576 voxels) placed at a distance of 5 cm from the neck was manually drawn on each of the seven slices (slice position and orientation similar to in vivo acquisitions) to report DTI metrics and relative B1+
values within the phantom.
To evaluate the intra-subject consistency between measurements, 3 DTI acquisitions (‘rescans’) were successively performed in the same session for 3 out of the 8 volunteers. To avoid vertigo that may occur with multiple entries/exits within the 7T magnet, the subjects were asked to move deliberately and frankly within the system at the end of each DTI acquisition. Slice positions and B0 shimming were reset to wipe out all settings, and manual
calibrations were therefore redone entirely from scratch for each acquisition. The scan-rescan coefficient of variation (COV, in %) for each metric (FA, λ┴, λ// and MD) was calculated
in GM and WM ROIs for the 3 subjects as follows: COV(x) = 100. σ, µ ,
. , where μ and σ are the scan-rescan mean and standard deviation (SD) for the metric x, respectively. Global COVs for each metric were then calculated by averaging the scan-rescan individual COVs.
Very high in-plane resolution DTI acquisition
Last, to go further into SC substructure investigation, a DTI acquisition with very high in-plane resolution was performed on one volunteer with the same prototype MR sequence but using a reduced FOV and two Outer Volume Suppression (OVS) bands in the phase direction to avoid aliasing. The sequence parameters were as follows: TE: 78.8 ms, FOV: 70x45 mm², acquisition matrix: 174x110, spatial resolution: 0.4x0.4x10 mm3, acceleration
factor: 2, partial Fourier: 6/8, pulse oximeter synchronization, 5 slices (from C1 to C5), acquisition window: 700 ms, 1 slice per cycle over 5 cycles, 30 directions, two b-values (0, 800 s/mm2), 4 averages, acquisition time: 11-12 minutes, including additional L>R
acquisition. The same processing pipeline (except template registration) was used for this dataset.
Results:
Results of each processing steps for one subject are shown in Figure 1, along with a detailed overview of the processing pipeline. Diffusion-weighted data were first corrected for image distortions with FSL Topup and FSL Eddy (Step 1). The two reverse phase-encoding datasets (images with b=0 s/mm2) are depicted in false colors and superimposed in Figure
1.a (yellow: L>R dataset, green: R>L dataset). Stronger image distortions were usually observed at lower cervical levels (e.g. C6-C7). Images corrected from distortions are shown in greyscale levels on Figure 1.b. These images were subsequently recolored to exhibit structures with hyper signals in purple (e.g. CSF) and other tissues in cyan. They were then superimposed to reference anatomical images (2D transverse gradient echo (GRE) imaging, sum of squares of individual echoes, (0.4 mm)² spatial resolution resampled to match dMRI resolution) in order to qualitatively illustrate the satisfactory matching of the spinal cord and canal shapes between the two modalities after distortion corrections (Figure 1.c). The second step (Step 2) was Gibbs artifacts removal, achieved with the LSS method. Figure 1.d reports a cervical level (C4 level) with strong ringing artifacts on the b0 image (top left) caused by
high CSF signal levels. Without correction, these artifacts would persist on the corresponding MD map (bottom left). After application of the LSS method, these artifacts were completely removed (right), with minimal filtering of the data caused by the linear interpolations introduced to compensate for subvoxel shifts (21). The b0 image and MD map of a cervical
level on the same volunteer where the ringing artifacts were not visible (Figure 1.e, C3 level), were left almost unchanged (less than 1% signal intensity variations). Following this, denoising of the 4D dataset was performed with the LPCA method (Step 3). One b0 image (3
averages) and two directional diffusion-weighted images (no average) are shown on the right-hand side for illustration (Figure 1.f). Subsequent DTI metrics computation was performed with FSL DTIFIT (Step 4) and is illustrated on Figure 1.g. Last step of the process (Step 5) was the diffusion-weighted data registration to template, to enable automated segmentation of SC substructures as well as group analysis (Figure 1.h). GM binarization mask is shown in orange, while WM mask is in blue. The three additional sub-regions are illustrated as well: anterior GM horns (red), lateral “motor” WM (green), and posterior “sensory” WM (yellow).
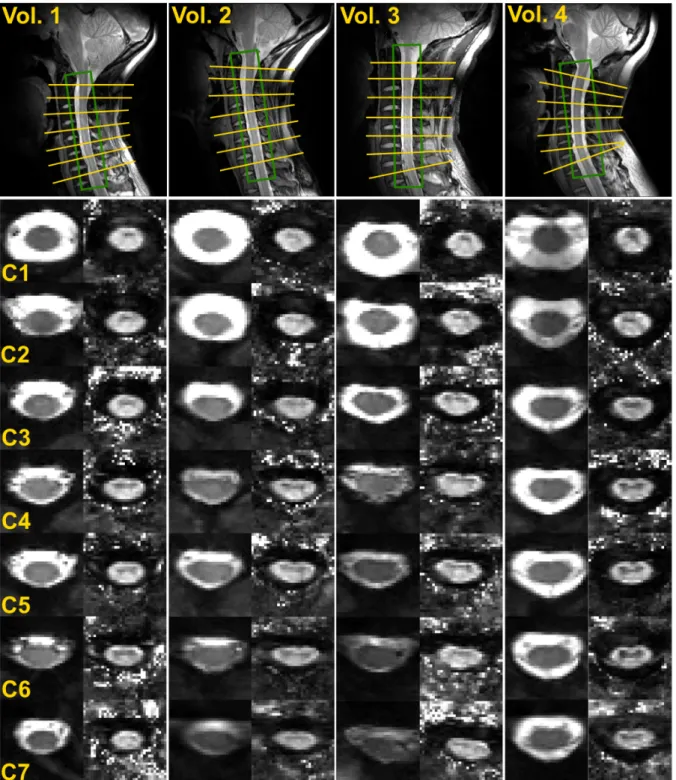
Since DTI of the cervical SC from C1 to C7 has not been reported so far at 7T, Figure 2 presents a panel of images obtained among different volunteers. The top row exhibits sagittal TSE images acquired before transverse DTI to depict slice positioning perpendicular to the cord and B0 shimming adjustment volumes. In the middle row, EPI images with b-value
= 0 s/mm2 (b
levels, for each subject. For all slices, the typical butterfly-shaped GM could be well depicted in FA maps. Note that all b0 images are normalized to the same signal level. As seen in
volunteers #2 and #3, overall b0 signal could noticeably decrease for lower SC levels. The
causes for signal drop are related, but not necessarily in a predictable manner, to subject morphology (such as higher body mass index (BMI), or increased SC distance to the coil) and/or B0 shimming overall quality (larger FWHM, depth of breathing).
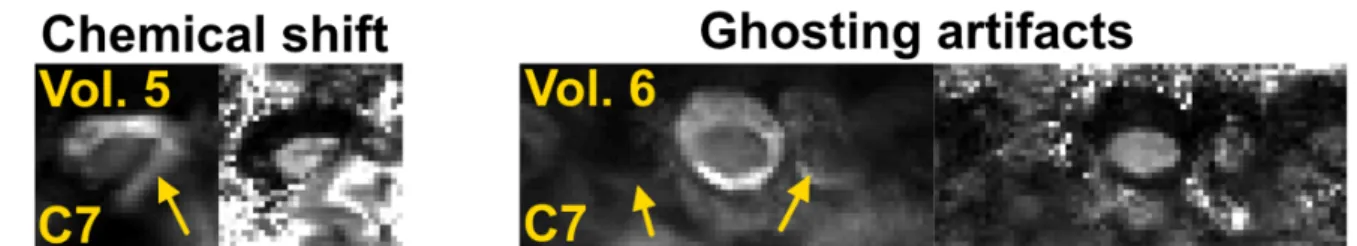
In some volunteers, at C6-C7 levels only, these causes led to severe artifacts and/or signal drops which could not be mitigated with processing. Data with poor image quality were discarded due to extremely low signal caused by B0 inhomogeneities (C6-C7: n=1, C7: n=1),
ghosting artifacts (C7: n=1), inefficient fat saturation (C7: n=1). Overall, discarded data represent 5 slices (n=1 at C6 and n=4 at C7) over 56 slices in total, i.e. 9 % of data. Figure 3 illustrates two cases where imaging at the C7 level was impaired by strong artifacts. On volunteer #5, some fat signal aliased on the SC due to ineffective fat suppression. On volunteer #6, ghosting artifacts contributed to SC signal decrease and irremediably hampered DTI metrics evaluation.
Figure 4.a presents a typical sagittal B1+ map obtained on a volunteer (relative values
in % with respect to nominal flip angle) and Figure 4.b presents a graph summarizing the B1+
variations observed for all volunteers along the cervical levels. For most volunteers (n=6), in
vivo B1+ values measured within the SC were observed globally stable at the targeted
nominal flip angle for levels C1 to C3 and decreased linearly with vertebral level to reach on average 70% of its nominal values at C7 level. Two volunteers do not follow a similar B1+
evolution pattern, with either a rather stable value along the whole SC, or on the opposite a significant drop of B1+ intensity (-60%) from C1 to C7. For the first case, the SC of the
volunteer (volunteer #3 on Figure 2) was remarkably straight. For the other one, the body mass index of the volunteer was significantly higher (BMI: 28) than the average among all subjects (BMI: 23 ± 3).
To quantify the effects of B1+ inhomogeneities encountered at 7T on DTI metrics, an in silico experiment was performed using different input voltages so as to mimic the B1+
variations observed in vivo. Figure 5.a to 5.d shows the measured FA, λ//, λ┴ and MD (in-ROI
mean ± in-ROI SD) of the phantom after data denoising, with respect to various relative B1+
values. Phantom average FA, λ//, λ┴ and MD values were estimated at 0.06±0.02, 1.02±0.03
10-3 mm²/s, 0.93±0.01 10-3 mm²/s and 0.96±0.01 10-3 mm²/s respectively, using
measurements with a relative B1+ intensity between 90% and 110% only. Before denoising
(data not shown), both mean values and in-ROI SDs measurements were biased to some extent by extreme values of relative B1+ (FA, λ//, λ┴ and MD mean values ranging from
[0.06-0.26], [1.02-1.18], [0.78-0.94], and [0.90-0.99], respectively, and in-ROI SD larger by up to a factor 4 when compared to denoised data). After denoising, these effects were largely mitigated, with rather stable metric estimations along the 50%-120% B1+ variation range, and
reduced in-ROI SDs (representing in average 5% of the mean values). Nevertheless, extreme B1+ relative values (superior to 120 % or inferior to 50%) could still induce a small
bias, even after data denoising.
Figure 6 summarizes the mean quantitative DTI maps obtained in the template space (arithmetic mean on n=8 volunteers for C1 to C5, n=7 for C6 and n=4 for C7). Butterfly-shaped GM (seen on FA, λ// and λ┴ maps) and cord parenchyma (seen on MD map) can be
clearly visualized on the resulting maps.
The evolutions along cervical levels of DTI metrics (FA, MD, λ//, λ┴) measured in each
ROI and averaged over all subjects are displayed in Figure 7. Values versus cervical level are reported for all considered SC sub-regions (GM: orange, anterior GM: red, WM: blue, WM sensitive tracts: yellow, WM motor tracts: green). For each metric, means ± inter-subject standard deviations are reported for n=8 healthy volunteers, except for C6 (n=7) and C7 (n=4).
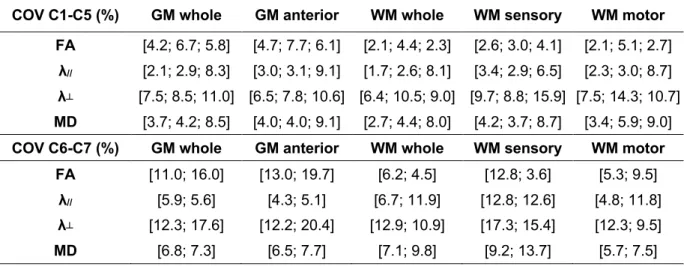
Table 1 presents the global COVs obtained for each metric calculated by averaging the scan-rescan COVs over the 3 subjects and the 3 time-points. C6-C7 COVs were reported for only two subjects, as imaging on these levels systematically failed on the third volunteer, due to large B0 inhomogeneities. Per level COVs for level C1 to C5 were found similar and
averaged before subject-averaging. Resulting global COVs for C1-C5 levels show a fair reproducibility, with maximum individual variability observed for radial diffusivity in posterior WM (15.9%). Reported values for C6-C7 levels are relatively higher (with maximum individual variability observed for radial diffusivity in anterior GM: 20.4%), confirming the slightly increased difficulty to generate robust data. These values hold less significance as only two volunteers were considered here.
Finally, images extracted from the very high-resolution DTI protocol in one volunteer are illustrated in Figure 8. FA maps for level C1 to C5 are shown, with colored zooms on C2 and C4 levels in order to highlight the structural variations observed within SC sub-regions. On particular note, the increased in-plane resolution (0.4 mm)² enabled to clearly distinguish posterior sensory tracts (gracile and cuneate tracts), as illustrated here on FA maps (e.g. higher FA values for cuneate tracts: 0.81 ± 0.03, versus 0.70 ± 0.03 for gracile tracts, at C2 level, using manual delineation). In addition, although this was beyond the scope of the present study, level-differences were also observed, with for instance a global decrease in FA values observed between C2 and C4 levels (e.g. cuneate tract going from 0.81 ± 0.03 to 0.76 ± 0.04 and motor WM from 0.82 ± 0.05 to 0.74 ± 0.04). Last, high in-plane resolution also enabled in-plane PVE reduction (anterior GM FA measured at about 0.42 ± 0.01 at C4
level) and visualization of very fine structures such as dorsal GM horns and anterior WM at every cervical level.
Discussion:
The continued drive towards Ultra-High Fields (UHF) MRI is motivated by the promise of increased SNR, which can be traded for increased image resolution. Considering all the prospects opened by increased image resolution, the same motivation holds for SC DTI. dMRI is however not straightforward at 7T, as it directly suffers from T2 shortening, B1 and B0
inhomogeneities, and Specific Absorption Rate (SAR) increase (27). When compared to lower-field (3T) conventional DTI protocols (usually 1x1x5 mm3 (2)), the higher in-plane
resolution and reduced slice thickness (0.8x0.8x3 mm3) used inthis work helped minimizing
PVE contamination between small SC substructures. However, formally demonstrating the quality improvement of SC DTI at 7T when compared to 3T was not endeavored in this study. The purpose of this work was rather to overcome some UHF technical challenges for SC DTI by taking care of various aspects of data acquisition and processing. Additional quantitative information on the SC could thus be obtained at 7T, in par with other MR sequences which directly benefit from UHF (e.g. gradient-echo-based sequences) (10,12,14,28). In this study, transverse SC DTI covering levels from C1 to C7 has been performed for the first time at 7T, within a total scan time compatible with a clinical research exam (6-7 minutes). Imaging was achieved thanks to a high-performance 7T MR system (equipped with powerful gradients allowing for echo spacing and echo time shortenings), adapted physiological triggering and minimal PVE contamination. To reduce the scan time, acquisition over three heart cycles (instead of four) would have been technically possible, but at the expense of overall image quality, as the last slices would have been acquired at the end of the CSF quiescent phase (17). This set-up is appropriate to quickly sample the whole cervical SC or to investigate focal diseases. To study more diffuse SC pathologies, the coverage of the sequence could be increased by adding more slices, either by increasing the total acquisition time (new slices are acquired on additional heart cycles) or by acquiring more slices per heart cycles (and therefore increasing SAR).
Based on our experience, 2nd-order automated global B
0 shimming default strategy
does not seem sufficient to guarantee reliable SC DTI quality, with observed undesired ghosting artifacts. To cope with this problem, additional adjustments (including some manual shimming refinements with physiological triggering) in a reduced volume covering approximately only the cervical canal, appeared mandatory, with up to a 100% improvement in measured FWHM within the volume. These adjustments were nonetheless time-consuming and not always efficient depending on the volunteer morphology and physiology
(e.g. breathing influence, bone orientation, large necks…). Slice-wise dynamic (or integrated) shimming (29–31) may further adequately improve region-based shimming inefficiency for lower cervical levels of the SC at 7T, as recently demonstrated for gradient echo sequence (32).
With the coil used in this work, the B1+ distribution along the cervical SC was fairly
similar between subjects, with rather homogeneous values close to the nominal flip angle for upper cervical levels (C1-C3) and a linear decrease down to about 70 % of the nominal value at level C7. The results of the phantom experiment likely indicated that typical encountered B1+ variations in the studied cohort (-30 % drop at C7 on average) had a limited influence on
DTI indices measurement accuracy (mean values variations inferior to in-ROI SDs measured at nominal flip angle). The denoising approach used in this paper contributed to mitigate these effects for the phantom measurements, and presumably also for in vivo data. Additional work could be pursued in the future to quantify precisely the impact of this method for SC in vivo data, as it has only been validated in the brain so far (22). Nevertheless, B1+
intensity could drop further in subjects with high body mass index and hence lead to reduced SNR level, contrast-to-noise ratio dropouts, or inefficient fat saturation. An improved coil geometry, advanced RF pulse design, or the use of parallel transmission (33) technology will likely contribute to further mitigate these imperfections. In addition, more receive elements and an anterior part (13,34) would also allow running high parallel imaging acceleration factors while minimizing g-ratio penalty.
Comprehensive data processing contributed to remove significant artifacts hampering SC DTI at 7T. To deal with image distortions, combining an SS-SE-EPI sequence with reversed phase-encoding-based processing was preferred over using a readout-segmented EPI sequence (35). This latter technique is less prone to susceptibility artifacts, but at the cost of a substantial increase in acquisition time. Distortion correction evaluation here was yet merely qualitative, with visual validation of geometric fidelity, as performed in previous studies from the literature (15,36). Mitigating these image distortions is nonetheless crucial, especially in the framework of clinical research studies comparing for instance specific laterality-related SC impairments. Although closely related to subject morphology (e.g. bone shapes, SC curvature, canal width), image distortions observed in this study were usually stronger at lower cervical levels due to poorer B0 shimming. Nevertheless, these distortions
were inherently limited in the acquisition by increasing the rate of k-space traversal thanks to: 1/ increased readout bandwidth, 2/ high parallel acceleration and 3/ small FOV. In the future, DTI fitting with outlier rejection (4,37) could also be enabled in the Eddy function to further improve robustness (the number of outlier images has nonetheless been estimated to be marginal in this study, based on visual investigations).
MSMA capabilities enabled to report DTI metrics corresponding to a sampling of discontinuous slices sampling the whole cervical SC in only one single acquisition, saving a considerable amount of time as compared to conventional strategies (stack of slices). DTI metrics were found in agreement with corresponding literature (4,5,38,39) obtained at lower field (3T). In details, we report similar trends for DTI metric evolutions along cervical levels (from C1 to C7) for all considered ROIs (i.e. FA decrease, almost constant MD, slight λ┴
increase, and λ// going through maximum value at C3 level). Quantitatively, reported FA
values for anterior GM were slightly higher (range [0.5-0.55]) in our study compared to other studies (range [0.45 0.55] (4,37,38). For sensory and motor WM tracts, reported FA values in this study (range [0.68-0.78]) were slightly higher than (38) (range [0.64-0.73]) but slightly lower than (4,39) (range [0.7-0.8]). Last, reported MD, λ┴ and λ// values were very
comparable to (4), but lower (-15 %) than (38). Nevertheless, these comparisons between studies should be handled with care, as our studied cohort is smaller and with a higher variability between subjects (±15 years old), compared to studies focusing on age-related changes (38).
With the ambition to fully benefit from the 7T strength, a very high-resolution protocol DTI was also run on one volunteer. The FA maps resulting from this reduced-FOV DTI acquisition enabled visual delineation of dorsal GM horns, and gracile and cuneate posterior WM tracts. This delineation, using only a single acquisition on one volunteer, was sharper than when comparing to the averaged map (n=8) illustrated in Figure 6. These results, combined with clustering methods, could likely contribute to an improved characterization of SC myelo- and cyto-architecture (40). They could also be used in multimodal templates in order to create more refined post-processing tools (41). Yet, due to very high SAR constraints generated by the two OVS, only one slice could be imaged per heart cycle, at the cost of an increased acquisition time. Inner-volume excitation using parallel transmission (33) will be considered in the future to reduce the SAR burden.
DTI has already demonstrated its ability for detecting microstructural changes detection in pathological (2,42,43) or aged SC (5,38). It also statistically highlighted structural differences between motor and sensory tracts in the SC (4,14,38). UHF now appears ready for SC investigations with more advanced techniques, such as q-space dMRI (44) or NODDI (45,46) which are known to provide more specific insights into tissue microstructure. When benefiting from the increased spatial resolution granted by UHF, both DTI and these advanced modalities will likely maximize their potential to explore small SC substructures with reduced PVE contamination and therefore contribute further to healthy and pathological SC investigations.
This preliminary study shows the feasibility of MSMA transverse DTI of the cervical SC at 7T. Our acquisition and processing setup allowed robust data acquisition from C1 to C5 cervical levels with COVs below 12% for all DTI metrics. Multi-parametric quantitative studies carried out at UHF on the whole cervical SC could therefore include a diffusion imaging component to complement anatomical and parametric imaging, without needing to have subjects rescanned at lower field. Since acquisitions at C7 level could suffer from various artifact sources that altered DTI quality for some volunteers, a more optimized coil and adequate strategy with regard to B0 field would likely be necessary to further improve SC
dMRI at 7T. Nevertheless, the results obtained at upper cervical levels, including DTI at (0.4 mm)2 in-plane resolution, pave the way for improved microstructural characterization of both
healthy and pathological SC using 7T MRI.
Acknowledgments:
The authors would like to thank Veronique Gimenez and Lauriane Pini for study logistics. This work was supported by the following funding sources: 7T-AMI-ANR-11-EQPX-0001, A*MIDEX-EI-13-07-130115-08.38-7T-AMISTART, A*MIDEXANR-11-IDEX-0001-02, CARNOT STAR Institute, and CNRS (Centre National de la Recherche Scientifique).
References:
1. Horsfield MA, Jones DK. Applications of diffusion-weighted and diffusion tensor MRI to white matter diseases - a review. NMR Biomed. 2002;15:570–577. doi: 10.1002/nbm.787.
2. Wheeler-Kingshott CA, Stroman PW, Schwab JM, et al. The current state-of-the-art of spinal cord imaging: Applications. NeuroImage 2014;84:1082–1093. doi: 10.1016/j.neuroimage.2013.07.014. 3. Stroman PW, Wheeler-Kingshott C, Bacon M, et al. The current state-of-the-art of spinal cord imaging: Methods. NeuroImage 2014;84:1070–1081. doi: 10.1016/j.neuroimage.2013.04.124.
4. Xu J, Shimony JS, Klawiter EC, Snyder AZ, Trinkaus K, Naismith RT, Benzinger TLS, Cross AH, Song S-K. Improved in vivo diffusion tensor imaging of human cervical spinal cord. NeuroImage 2013;67:64–76. doi: 10.1016/j.neuroimage.2012.11.014.
5. Wang K, Song Q, Zhang F, Chen Z, Hou C, Tang Y, Chen S, Hao Q, Shen H. Age-related changes of the diffusion tensor imaging parameters of the normal cervical spinal cord. Eur. J. Radiol. 2014;83:2196–2202. doi: 10.1016/j.ejrad.2014.09.010.
6. Dowell NG, Jenkins TM, Ciccarelli O, Miller DH, Wheeler-Kingshott CAM. Contiguous-slice zonally oblique multislice (CO-ZOOM) diffusion tensor imaging: Examples of in vivo spinal cord and optic nerve applications. J. Magn. Reson. Imaging 2009;29:454–460. doi: 10.1002/jmri.21656.
7. Finsterbusch J. High-resolution diffusion tensor imaging with inner field-of-view EPI. J. Magn. Reson. Imaging 2009;29:987–993. doi: 10.1002/jmri.21717.
8. Samson RS, Lévy S, Schneider T, Smith AK, Smith SA, Cohen-Adad J, Wheeler-Kingshott CAMG. ZOOM or Non-ZOOM? Assessing Spinal Cord Diffusion Tensor Imaging Protocols for Multi-Centre Studies. PLOS ONE 2016;11:e0155557. doi: 10.1371/journal.pone.0155557.
9. Wheeler-Kingshott CAM, Parker GJM, Symms MR, Hickman SJ, Tofts PS, Miller DH, Barker GJ. ADC mapping of the human optic nerve: Increased resolution, coverage, and reliability with CSF-suppressed ZOOM-EPI. Magn. Reson. Med. 2002;47:24–31. doi: 10.1002/mrm.10016.
10. Dula AN, Pawate S, Dortch RD, Barry RL, George-Durrett KM, Lyttle BD, Dethrage LM, Gore JC, Smith SA. Magnetic resonance imaging of the cervical spinal cord in multiple sclerosis at 7T. Mult. Scler. 2015:10.1177/1352458515591070.
11. Dula AN, Pawate S, Dethrage LM, Conrad BN, Dewey BE, Barry RL, Smith SA. Chemical exchange saturation transfer of the cervical spinal cord at 7 T. NMR Biomed. 2016;29:1249–1257. doi: 10.1002/nbm.3581.
12. Cohen-Adad J, Zhao W, Wald LL, Oaklander AL. 7T MRI of spinal cord injury. Neurology 2012;79:2217. doi: 10.1212/WNL.0b013e31827597ae.
13. Zhang B, Seifert AC, Kim J, Borrello J, Xu J. 7 Tesla 22-channel wrap-around coil array for cervical spinal cord and brainstem imaging. Magn. Reson. Med. 2016:10.1002/mrm.26538.
14. Massire A, Taso M, Besson P, Guye M, Ranjeva J-P, Callot V. High-resolution multi-parametric quantitative magnetic resonance imaging of the human cervical spinal cord at 7T. NeuroImage 2016;143:58–69. doi: 10.1016/j.neuroimage.2016.08.055.
15. Andersson JLR, Skare S, Ashburner J. How to correct susceptibility distortions in spin-echo echo-planar images: application to diffusion tensor imaging. NeuroImage 2003;20:870–888. doi: 10.1016/S1053-8119(03)00336-7.
16. Fautz H-P, Vogel MW, Gross P, Kerr AB, Zhu Y. B1 mapping of coil arrays for parallel transmission. In Proceedings of the 16th Annual Meeting of ISMRM, Toronto, Ontario, Canada; 2008. p. 1247.
17. Summers P, Staempfli P, Jaermann T, Kwiecinski S, Kollias S. A preliminary study of the effects of trigger timing on diffusion tensor imaging of the human spinal cord. AJNR Am. J. Neuroradiol. 2006;27:1952–1961.
18. Griswold MA, Jakob PM, Heidemann RM, Nittka M, Jellus V, Wang J, Kiefer B, Haase A. Generalized autocalibrating partially parallel acquisitions (GRAPPA). Magn. Reson. Med. 2002;47:1202–1210. doi: 10.1002/mrm.10171.
19. Smith SM, Jenkinson M, Woolrich MW, et al. Advances in functional and structural MR image analysis and implementation as FSL. NeuroImage 2004;23 Suppl 1:S208-219. doi: 10.1016/j.neuroimage.2004.07.051.
20. Andersson JLR, Sotiropoulos SN. An integrated approach to correction for off-resonance effects and subject movement in diffusion MR imaging. NeuroImage 2016;125:1063–1078. doi: 10.1016/j.neuroimage.2015.10.019.
21. Kellner E, Dhital B, Kiselev VG, Reisert M. Gibbs-ringing artifact removal based on local subvoxel-shifts. Magn. Reson. Med. 2016;76:1574–1581. doi: 10.1002/mrm.26054.
22. Manjón JV, Coupé P, Concha L, Buades A, Collins DL, Robles M. Diffusion Weighted Image
Denoising Using Overcomplete Local PCA. PLOS ONE 2013;8:e73021. doi:
10.1371/journal.pone.0073021.
23. Taso M, Le Troter A, Sdika M, Cohen-Adad J, Arnoux P-J, Guye M, Ranjeva J-P, Callot V. A reliable spatially normalized template of the human spinal cord — Applications to automated white
matter/gray matter segmentation and tensor-based morphometry (TBM) mapping of gray matter alterations occurring with age. NeuroImage 2015;117:20–28. doi: 10.1016/j.neuroimage.2015.05.034. 24. Avants BB, Epstein CL, Grossman M, Gee JC. Symmetric diffeomorphic image registration with cross-correlation: Evaluating automated labeling of elderly and neurodegenerative brain. Med. Image Anal. 2008;12:26–41. doi: 10.1016/j.media.2007.06.004.
25. Lévy S, Benhamou M, Naaman C, Rainville P, Callot V, Cohen-Adad J. White matter atlas of the human spinal cord with estimation of partial volume effect. NeuroImage 2015;119:262–271. doi: 10.1016/j.neuroimage.2015.06.040.
26. De Leener B, Lévy S, Dupont SM, Fonov VS, Stikov N, Louis Collins D, Callot V, Cohen-Adad J. SCT: Spinal Cord Toolbox, an open-source software for processing spinal cord MRI data. NeuroImage 2017;145:24–43. doi: 10.1016/j.neuroimage.2016.10.009.
27. Gallichan D. Diffusion MRI of the human brain at ultra-high field (UHF): A review. NeuroImage 2017:10.1016/j.neuroimage. doi: 10.1016/j.neuroimage.2017.04.037.
28. Sigmund EE, Suero GA, Hu C, McGorty K, Sodickson DK, Wiggins GC, Helpern JA. High-resolution human cervical spinal cord imaging at 7 T. NMR Biomed. 2012;25:891–899. doi: 10.1002/nbm.1809.
29. Gatidis S, Graf H, Weiß J, Stemmer A, Kiefer B, Nikolaou K, Notohamiprodjo M, Martirosian P. Diffusion-weighted echo planar MR imaging of the neck at 3 T using integrated shimming: comparison of MR sequence techniques for reducing artifacts caused by magnetic-field inhomogeneities. Magn. Reson. Mater. Phys. Biol. Med. 2017;30:57–63. doi: 10.1007/s10334-016-0582-z.
30. Finsterbusch J, Eippert F, Büchel C. Single, slice-specific z-shim gradient pulses improve
T2*-weighted imaging of the spinal cord. NeuroImage 2012;59:2307–2315. doi:
10.1016/j.neuroimage.2011.09.038.
31. Blamire AM, Rothman DL, Nixon T. Dynamic shim updating: A new approach towards optimized whole brain shimming. Magn. Reson. Med. 1996;36:159–165. doi: 10.1002/mrm.1910360125.
32. Vannesjo JS, Shi Y, Tracey I, Miller KL, Clare S. Slice-wise first-order shimming of the human spinal cord at 7T. In Proceedings of the 25th Annual Meeting of ISMRM, Honolulu, Hawaii, USA; 2017. p. 5210.
33. Padormo F, Beqiri A, Hajnal JV, Malik SJ. Parallel transmission for ultrahigh-field imaging. NMR Biomed. 2016;29:1145–1161. doi: 10.1002/nbm.3313.
34. Zhao W, Cohen-Adad J, Polimeni JR, Keil B, Guerin B, Setsompop K, Serano P, Mareyam A, Hoecht P, Wald LL. Nineteen-channel receive array and four-channel transmit array coil for cervical spinal cord imaging at 7T. Magn. Reson. Med. 2014;72:291–300. doi: 10.1002/mrm.24911.
35. Heidemann RM, Porter DA, Anwander A, Feiweier T, Heberlein K, Knösche TR, Turner R. Diffusion imaging in humans at 7T using readout-segmented EPI and GRAPPA. Magn. Reson. Med. 2010;64:9–14. doi: 10.1002/mrm.22480.
36. Holland D, Kuperman JM, Dale AM. Efficient correction of inhomogeneous static magnetic
field-induced distortion in Echo Planar Imaging. NeuroImage 2010;50:175–183. doi:
10.1016/j.neuroimage.2009.11.044.
37. Andersson JLR, Graham MS, Zsoldos E, Sotiropoulos SN. Incorporating outlier detection and replacement into a non-parametric framework for movement and distortion correction of diffusion MR images. NeuroImage 2016;141:556–572. doi: 10.1016/j.neuroimage.2016.06.058.
38. Taso M, Girard OM, Duhamel G, Le Troter A, Feiweier T, Guye M, Ranjeva J-P, Callot V. Tract-specific and age-related variations of the spinal cord microstructure: a multi-parametric MRI study
using diffusion tensor imaging (DTI) and inhomogeneous magnetization transfer (ihMT). NMR Biomed. 2016:10.1002/nbm.3530.
39. Ellingson BM, Ulmer JL, Kurpad SN, Schmit BD. Diffusion tensor MR imaging of the neurologically intact human spinal cord. AJNR Am. J. Neuroradiol. 2008;29:1279–1284. doi: 10.3174/ajnr.A1064. 40. Taso M, Massire A, Besson P, Le Troter A, Guye M, Ranjeva J-P, Callot V. Towards in vivo spinal cord cyto- and myelo-architecture deciphering using multi-modal MRI parcellation at 7T. In Proceedings of the 25th Annual Meeting of ISMRM, Honolulu, Hawaii, USA; 2017. p. 18.
41. De Leener B, Fonov VS, Collins DL, Callot V, Stikov N, Cohen-Adad J. PAM50: Multimodal template of the brainstem and spinal cord compatible with the ICBM152 space. In Proceedings of the 25th Annual Meeting of ISMRM, Honolulu, Hawaii, USA; 2017. p. 187.
42. Cohen-Adad J, El Mendili M-M, Lehéricy S, Pradat P-F, Blancho S, Rossignol S, Benali H. Demyelination and degeneration in the injured human spinal cord detected with diffusion and
magnetization transfer MRI. NeuroImage 2011;55:1024–1033. doi:
10.1016/j.neuroimage.2010.11.089.
43. El Mendili M-M, Cohen-Adad J, Pelegrini-Issac M, et al. Multi-Parametric Spinal Cord MRI as Potential Progression Marker in Amyotrophic Lateral Sclerosis. PLoS ONE 2014;9:e95516. doi: 10.1371/journal.pone.0095516.
44. Farrell JAD, Smith SA, Gordon-Lipkin EM, Reich DS, Calabresi PA, van Zijl PCM. High b-value q-space Diffusion Weighted MRI of the Human Cervical Spinal Cord in vivo: Feasibility and Application to Multiple Sclerosis. Magn. Reson. Med. 2008;59:1079–1089. doi: 10.1002/mrm.21563.
45. Zhang H, Schneider T, Wheeler-Kingshott CA, Alexander DC. NODDI: Practical in vivo neurite orientation dispersion and density imaging of the human brain. NeuroImage 2012;61:1000–1016. doi: 10.1016/j.neuroimage.2012.03.072.
46. Grussu F, Schneider T, Zhang H, Alexander DC, Wheeler-Kingshott CAM. Neurite orientation dispersion and density imaging of the healthy cervical spinal cord in vivo. NeuroImage 2015;111:590– 601. doi: 10.1016/j.neuroimage.2015.01.045.
Table 1. Coefficients of variation computed for DTI metrics measurements in each of the 5 ROIs over 3 time-points. COVs were averaged for C1 to C5 levels and reported for the 3 subjects (no discard). C6-C7 mean COVs were reported for only two subjects, as DTI at these levels systematically failed on the third volunteer, due to large B0 inhomogeneities.
(Global COVs, in %, mean ± inter-subject standard deviation).
COV C1-C5 (%) GM whole GM anterior WM whole WM sensory WM motor
FA [4.2; 6.7; 5.8] [4.7; 7.7; 6.1] [2.1; 4.4; 2.3] [2.6; 3.0; 4.1] [2.1; 5.1; 2.7] λ// [2.1; 2.9; 8.3] [3.0; 3.1; 9.1] [1.7; 2.6; 8.1] [3.4; 2.9; 6.5] [2.3; 3.0; 8.7] λ┴ [7.5; 8.5; 11.0] [6.5; 7.8; 10.6] [6.4; 10.5; 9.0] [9.7; 8.8; 15.9] [7.5; 14.3; 10.7] MD [3.7; 4.2; 8.5] [4.0; 4.0; 9.1] [2.7; 4.4; 8.0] [4.2; 3.7; 8.7] [3.4; 5.9; 9.0]
COV C6-C7 (%) GM whole GM anterior WM whole WM sensory WM motor
FA [11.0; 16.0] [13.0; 19.7] [6.2; 4.5] [12.8; 3.6] [5.3; 9.5]
λ// [5.9; 5.6] [4.3; 5.1] [6.7; 11.9] [12.8; 12.6] [4.8; 11.8]
λ┴ [12.3; 17.6] [12.2; 20.4] [12.9; 10.9] [17.3; 15.4] [12.3; 9.5]
Figure 1. Results from the image processing pipeline dedicated to high-resolution transverse DTI of the human SC at 7T. Step 1: Image distortion correction with reversed phase-encoding method. a: superimposed reversed phase-phase-encoding datasets (yellow: L>R/ green: R>L). b: corrected b0 images. c: superimposed (‘cool’) colored corrected b0 and reference
anatomical GRE images. Step 2: Gibbs artifacts removal on b0 images with the local
subvoxel-shifts method (top) and effect on MD maps (bottom). Original images are shown on the left, corrected images on the right. d: pronounced artifacts at C4 level. e: no visible artifacts at C3 level. Step 3: DTI data denoising with the LPCA method and effect on individual images. f: b0 (top) and two directional b=800 mm2/s diffusion-weighted images
(middle: direction perpendicular to the SC axis and bottom: parallel direction). Original images are shown on the left, corrected images on the right. Step 4: g: DTI indices computation with FSL DTIFIT. Step 5: h: DTI data registration to the reciprocal of the AMU40
SC template (in-plane resolution 0.47x0.47 mm²) to enable group studies and automated ROI labeling (red: anterior GM, orange: GM, blue: WM, green: lateral motor WM and yellow: posterior sensory WM).
Figure 2. C1 to C7 transverse SC DTI at 7T of four volunteers (3 females, 1 male, 37 ± 17 years old, body mass index: 23 ± 3). Top images: slice positioning and B0 adjustment
volumes (green box) depicted on sagittal TSE images. Middle images: EPI images with b-value = 0 s/mm2 (left columns) and corresponding FA maps (right columns), for all cervical
Figure 3. Illustration of artifacts encountered at the C7 level on two volunteers. EPI images with b-value = 0 s/mm2 (left columns) and corresponding FA maps (right columns). Images
were impaired by chemical shift (volunteer 5) and ghosting artifacts (volunteer 6), respectively (see yellow arrows).
Figure 4. a: Sagittal B1+ map obtained on a volunteer (relative values in % with respect to
nominal flip angle). b: In vivo B1+ relative values measured on n=8 healthy volunteers, with
respect to cervical levels. With chosen voltages, relative B1+ values varied from 42 % to 118
Figure 5. B1+ inhomogeneities and denoising influence on DTI metrics using a validation
experiment on the head-shaped SAM phantom with different input voltages. Measured mean values (± in-ROI SD) after DTI data denoising of a: FA, b: λ//, c: λ┴ and d: MD for all ROIs at
Figure 6. Colored quantitative maps (FA (a.u), MD (10-3 mm2/s), λ
// (10-3 mm2/s), λ┴ (10-3
mm2/s)) in the template space for all cervical levels, with an in-plane resolution of (0.47 mm)².
Figure 7. Evolutions of DTI metrics (a: FA, b: MD, c: λ//, d: λ┴) (mean ± inter-subject standard
deviation, on n=8 volunteers (C1-C5), n=7 (C6) and n=4 (C7)) versus cervical level (from C1 to C7) for all considered SC sub-regions (whole GM: orange, anterior GM: red, whole WM: blue, WM sensitive tracts: yellow, WM motor tracts: green).
Figure 8. Transverse DTI of the cervical spinal cord on a healthy volunteer with very high in-plane resolution (0.4 mm)², from C1 to C5 levels. Reduced-FOV imaging was achieved using outer volume suppression. For each level, FA maps are illustrated in grayscale. Magnified and colored FA maps for C2 and C4 levels depict structural variations within WM tracts (e.g. between gracile and cuneate tracts). High resolution also enables partial-volume effect reduction and clear visualization of smaller structures such as GM dorsal horns.