Customer Loyalty in the Public Transportation Context
by Valerie Webb B.S., Civil Engineering The Ohio State University, 2008
Submitted to the Department of Civil and Environmental Engineering in Partial Fulfillment of the Requirements for the Degree of
Master of Science in Transportation at the
Massachusetts Institute of Technology February 2010
C 2010 Massachusetts Institute of Technology All rights reserved
Signature of Author
Department
Certified by
Research Scientist, Department
ARCHIVES
MASSACHUSETS INSTftffTEOF TECHNOLOGY
MAR 2
3
2010
LIBRARIES
of Civil and Environmental Engineering January 18, 2010
Jinhua Zhao
of Civil and Environmental Engineering Thesis Supervisor Certified byNigel H.M. Wilson Professor of Civil and Environmental Engineering
- Thesis,-Stigervisor
Accepted by
Daniele Veneziano
Customer Loyalty in the Public Transportation Context by
Valerie Webb
Submitted to the Department of Civil and Environmental Engineering on January 18, 2010 in partial fulfillment of the requirements for the degree of
Master of Science in Transportation
Abstract
Public transportation agencies, much like other service industries, have a constant churn of their customer base. New customers are entering and current customers are defecting every day. Traditionally, efforts to increase this customer base have focused on attracting more first-time users. However, preventing the loss of customers to competitive modes, such as the auto, has many added benefits that are not often realized. Loyal customers provide recommendations to others, increase and diversify their use of the service, and do not require the acquisition costs associated with new customers.
This study aims to develop a strategy to identify the key drivers of customer loyalty to public transportation agencies, using the Chicago Transit Authority (CTA) as a case study. Once these influencing factors have been identified for the general population, loyalty differences between key market segments can be tested and analyzed. Based on these results, specific areas of service provision can be targeted for improvement and marketing campaigns can be developed so that customer segments can be targeted based on which areas are most important to them.
Factor analysis and structural equation modeling were used to create a customer loyalty model for the CTA. Factors identified as contributing to a rider's loyalty were problem experience, perceptions of service quality', service value, perceptions of CTA, and customer satisfaction. The
results for the general population showed that the average customer bases their decision to continue to use the service in the future fairly evenly on perceptions of service quality, service
value, and customer satisfaction with the remaining two factors playing only indirect roles. The
most important factor for a customer to recommend the service to others is their perceptions Qf service quality.
The model results were then applied to key market segmentations (captive vs. choice riders, riders with low vs. high accessibility to transit, and bus riders vs. rail riders) using ANOVA, MIMIC, and multiple group analysis. It was found that captive riders are highly sensitive to
problem experience; they report experiencing more problems and those problems more strongly
factors higher than those with low accessibility and are, in turn, more loyal. Finally, bus riders' loyalty is more highly affected by their perceptions of service quality which could stem from the
unpredictability of bus service resulting from exogenous factors.
By developing a more thorough understanding of what keeps their customers coming back, public transportation agencies can more effectively use their limited resources by growing a base
of loyal customers, and in turn, increasing their revenues.
Thesis Supervisors: Nigel H.M. Wilson and Jinhua Zhao
Acknowledgements
I would like to start out by giving thanks to my advisors, Professor Nigel Wilson, John
Attanucci, and Jinhua Zhao. Your support, insight and dedication to this program have added a tremendous amount of value to my time at MIT. Special thanks to Jinhua whose enthusiasm and wealth of knowledge pushed me to achieve as much as possible within this thesis.
Also, thanks to Fred Salvucci, and Mikel Murga for their input and contribution to the Transit Research Group.
Another special thanks to Rabi Mishalani who has been a great support system to me for the majority of my undergraduate and graduate career. His perspective and encouragement have always been greatly appreciated.
Beginning with an internship in the summer of 2009 and continuing with research work this fall, my experiences with the Chicago Transit Authority have been a very valuable part of the
education I have received. Special thanks to Jason Minser and Michelle Goldberg for pushing my limits, helping to steer this thesis topic into what it is today, and teaching me a tremendous amount along the way.
My family and friends from home have also been exceptionally supportive during my time in Boston and I cannot thank them enough. I would not be who or where I am today if it was not for their unwavering love and encouragement.
Finally, I would like to thank each and every one of the amazing people I have met during my time at MIT. During the past 18 months, I have made friends that I know will last a lifetime. Special thanks to Liz, Winnie, Candy, Jared, Yossi, Tony, Juliin, Andrew, Harvey, and David for making me smile everyday. You guys are the best!
Table of Contents
1 In tro d u c tio n ... ... ... 1 3 1 .1 S e ttin g th e S ta g e ... 1 3
1.2 Significance and Benefits of Customer Loyalty... 15
1.3 How Can Transit Agencies Realize the Benefits and Increase Loyalty? ... ... 17
1.4 R esearch O bjectiv es... ... . 18
1.5 R esearch A p p ro ach ... . 19
1.6 T hesis O rganization ... . . 22
2 L ite ra tu re R ev iew ... 2 4 2.1 D efinitions of C ustom er L oyalty ... 2 4 2.1.1 Conceptual Definition... .... 24
2.1.2 Operational Definition ... .... 25
2.2 A ntecedents of Custom er Loyalty ... 27
2 .2 .1 S atisfactio n ... . . 2 8 2 .2 .2 S erv ice Q u ality . ... ... . . 2 9 2 .2 .3 P u b lic Im a g e ... 3 0 2 2 .4 T ru st ... 3 0 2.2.5 Service V alue and Price Fairness ... 31
2.2.6 Complaints or Problem Experience ...... 3131.... 2.2.7 Attractiveness of Alternatives and Switching Costs... 32
2.3 Customer Loyalty Modeling Methodologies ... 33
2 .3 .1 F acto r A n a ly sis ... . . 3 4 2.3.2 Structural Equation Modeling ... ... 36
2.3.3 Multiple-Indicator Multiple-Cause (MIMIC) Analysis ... 38
2.3.4 Multiple Group Analysis (MGA) ... 38
2.4 Applying the Literature to the Public Transportation Industry ... 39
2.4.1 D efinition of C ustom er L oyalty ... 39
2.4.2 A ntecedents of Custom er Loyalty ... 40
3 Chicago Transit Authority's Customer Experience Survey ... ... 44
3.1 C o llectio n M eth o d ... . . 4 5 3.2 Demographics and General Ridership Statistics of Respondents ... 46
3.3 Creating Model Constructs from Survey Data... ... 49
3.3.1 Perceptions of the CTA... ... 50
3.3.2 Service Quality Perceptions ... .... 51 7
3.3.3 Problem Experience... ... 51
3 .3 .4 S erv ice V alu e ... ... .5 4 3.3.5 Customer Satisfaction ... ....55
3 .3 .6 C u sto m er L oy alty ... . . 5 5 4 General Population Analysis ... 57
4 .1 F a cto r A n a ly sis ... 5 7 4.1.1 Factor Analysis for the Perceptions of Service Quality Loyalty Driver ... 58
4.1.2 Factor Analysis for Perception of CTA Loyalty Driver... 63
4. 1.3 Formation of Other Constructs to be Included in the Analysis ... 65
4.2 Structural Equation Modeling ... 65
4.2.1 Hypothesized Relationships between Model Factors...67
4.2.2 Configuration A Structural Equation Model Results ... 74
4.2.3 Configuration B Structural Equation Model Results... 79
5 Market Segment Analysis - Methodology and Results ... 85
5.1 C hoosing M arket Segm ents ... . 85
5.2 Loyalty Differences between Captive and Choice Riders ... 89
5.2.1 Captive vs. Choice D escriptive Statistics ... 89
5.2.2 Captive vs. Choice MIMIC Model (0=Captive, 1=Choice) ... 90
5.2.3 Captive vs. Choice M ultiple Group Analysis ... 91
5.3 Loyalty Differences with Level of Accessibility... ... 96
5.3.1 High vs. Low Accessibility Descriptive Statistics ... 97
5.3.2 High vs. Low Accessibility MIMIC Model (0=Low Access, 1=High Access)...98
5.3.3 High vs. Low Accessibility Multiple Group Analysis ... 99
5.4 Loyalty D ifferences betw een M odes ... 104
5.4 .1 M ode D escriptive Statistics ... 104
5.4.2 Mode MIMIC Model (0=Primary Bus Rider, 1=Primary Rail Rider) ... 105
5.4.3 M ode M ultiple G roup A nalysis... 106
6 Summary and Conclusions ... 114
6.1 Summary of Results for the General Population ... ... 115
6.2 Summary of the Results of M arket Segment Analysis ... 116
6.3 Marketing Implications ... 117
6.4 Customer Research Implications ... 119
6.4.1 Suggested Content of Customer Surveys to Support Loyalty Modeling... 119
6 .5 F u tu re R e se a rc h ... 12 2 R E F E R E N C E S ... 1 2 5
APPENDIX A: DESIRED VALUES FOR STATISTICAL MEASURES ... 129
APPENDIX B: CORRELATION MATRIX OF MODEL FACTORS ... 130
APPEND IX C: SAM PLE M PLU S CODE ... 131
APPENDIX D: GENERAL POPULATION SEM RESULTS -CONFIGURATION A ... 134
APPENDIX E: GENERAL POPULATION SEM RESULTS -CONFIGURATION B... 139
APPENDIX F: CAPTIVE VS. CHOICE MIMIC MODEL RESULTS - CONFIGURATION B 144 APPENDIX G: CAPTIVE VS. CHOICE MULTIPLE GROUP ANALYSIS RESULTS -C O N F IG U R A T IO N B ... 14 9 APPENDIX H: HIGH VS. LOW ACCESSIBILITY MIMIC MODEL RESULTS -C O N F IG U R A T IO N B ... 15 7 APPENDIX I: HIGH VS. LOW ACCESSIBILITY MULTIPLE GROUP ANALYSIS RESULTS - CONFIGURATION B ... ... 162
APPENDIX J: BUS VS. RAIL MIMIC MODEL RESULTS - CONFIGURATION B ... 170
APPENDIX J: BUS VS. RAIL MIMIC MODEL RESULTS - CONFIGURATION B ... 170 APPENDIX K: BUS VS. RAIL MULTIPLE GROUP ANALYSIS RESULTS
List of Tables
Table 2-1: D efinitions of Custom er Loyalty...27
Table 2-2: Factors Motivating Loyalty in Other Industries ... .... 28
Table 2-3: Hypothesized Drivers of Customer Loyalty for Public Transportation...43
Table 3-1: Descriptive Statistics for Select Demographic Data ... 46
Table 3-2: General Ridership Questions and Summary Statistics.... ... 48
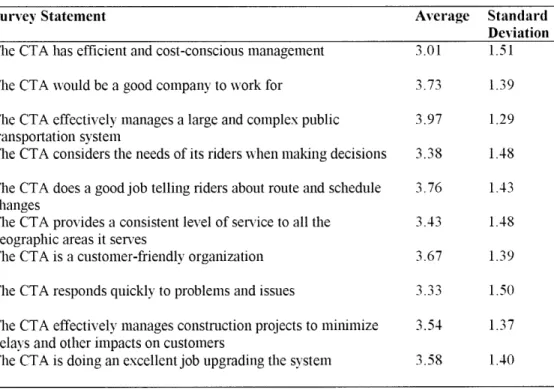
Table 3-3: Perceptions of CTA Summary Statistics... ... 50
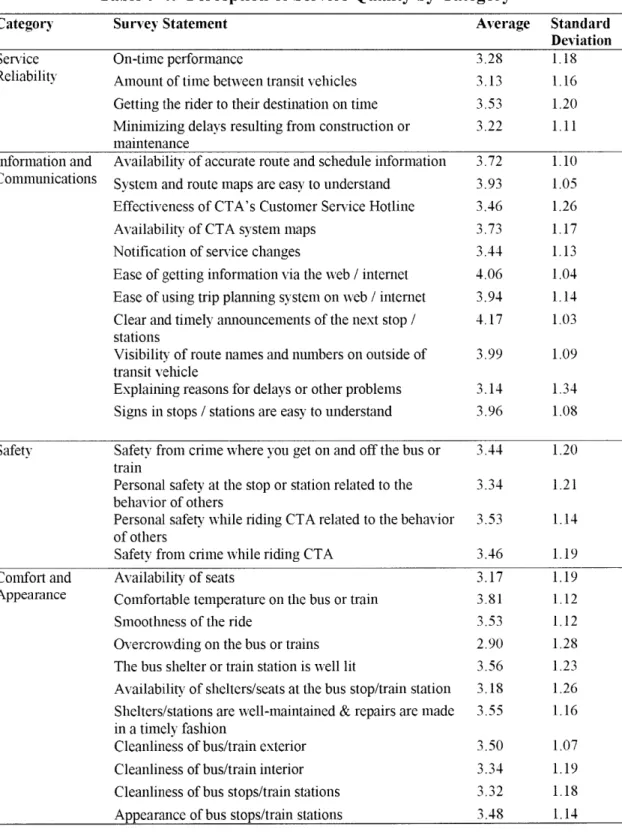
Table 3-4: Perception of Service Quality by Category... ... 52
Table 3-5: Frequently Reported Problem s... 53
Table 3-6: Problem Experience Summary Statistics...53
Table 3-7: Service Value Summary Statistics...55
Table 3-8: Customer Loyalty Questions and Summary Statistics...55
Table 4-1: Factors to be Explored in the Loyalty M odel...58
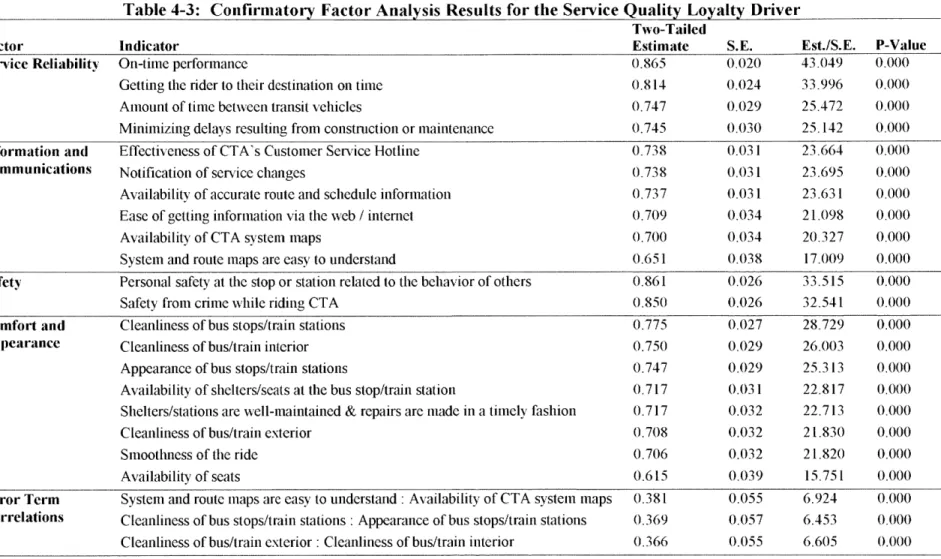
Table 4-2: Goodness of Fit Results for Confirmatory Factor Analysis of the Service Quality L o y alty D riv er...6 0 Table 4-3: Confirmatory Factor Analysis Results for the Service Quality Loyalty Driver...61
Table 4-4: Service Quality Factor Reliability...63
Table 4-5: Perceptions of CTA Confirmatory Factor Analysis Results...64
Table 4-6: Goodness of Fit Results for Perceptions of CTA Confirmatory Factor Analysis... 64
Table 4-7: Definition of Remaining M odel Factors...66
Table 4-8: Factor Categorization...68
Table 4-9: Possible Model Structures... ... ... 73
Table 4-10: Structural Equation Model Goodness of Fit -Configuration A...74
Table 4-11: Direct, Indirect, and Total Effects on Output Measures -Configuration A... 78
Table 4-12: Structural Equation Model Goodness of Fit -Configuration B...79
Table 4-13: Direct, Indirect, and Total Effects on Output Measures -Configuration B...84
Table 5-1: Average Ridership Statistics by Market Segmentation...87
Table 5-2: Captive vs. Choice ANOVA Results... 89
Table 5-3: Effects of Captive vs. Choice on each Model Factor...91
Table 5-5: Direct, Indirect, and Total Effects on Output Measures for Captive and Choice
Riders... ... 93
Table 5-6: Captive vs. Choice MGA Goodness of Fit Results...95
Table 5-7: Chi-Square Difference Test Results for Captive vs. Choice Segmentation... 95
Table 5-8: High Vs. Low Accessibility ANOVA Results... ... 98
Table 5-9: Effects of Accessibility on each M odel Factor...99
Table 5-10: Accessibility MIMIC Goodness of Fit Results...99
Table 5-11: Direct, Indirect, and Total Effects on Output Measures for Low and High Accessibility Riders...101
Table 5-12: Accessibility M GA Goodness of Fit Results...103
Table 5-13: Chi-Square Difference Test Results for Accessibility Segmentation...103
Table 5-14: M ode AN O V A R esults... .. ... 105
Table 5-15: Effects of M ode on each M odel Factor...106
Table 5-16: M ode M IM IC Goodness of Fit Results...106
Table 5-17: Direct, Indirect, and Total Effects on Output Measures for Bus and Rail R id e r s ... ... ... ... ... ... ... ... ... ... ... ... ... ... ... ... ... ... ... ... ... ... ... ... ... ... ... 1 0 8 Table 5-18: M ode M GA Goodness of Fit Results...II1 Table 5-19: Chi-Square Difference Test Results for Mode Segmentation...111
List of Figures
F igu re 1-1- T hesis Stru ctu re ... 2 2
Figure 2-1: Effect of Variable A on Variable B...38
Figure 3-1: R easons for U sing Transit...47
Figure 3-2: Captive versus Choice Riders... ... 48
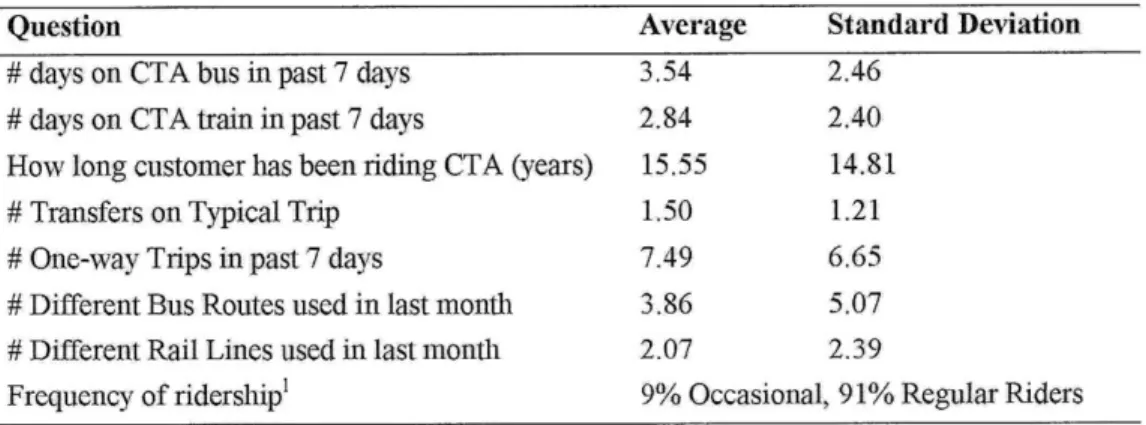
Figure 3-3: Transit Mode Split... 49
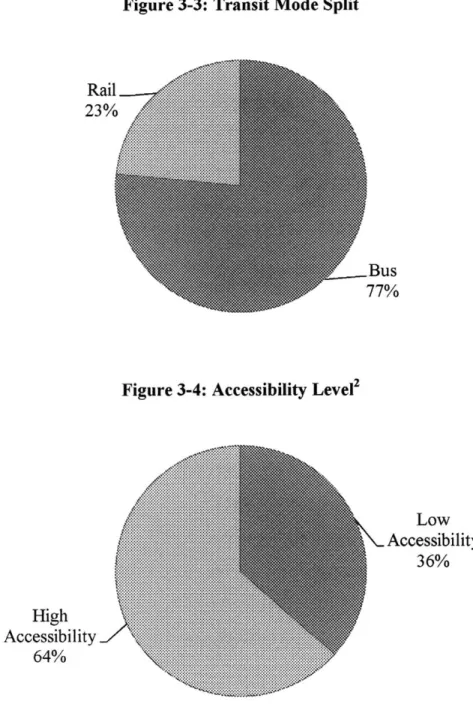
Figure 3-4: Accessibility Level...49
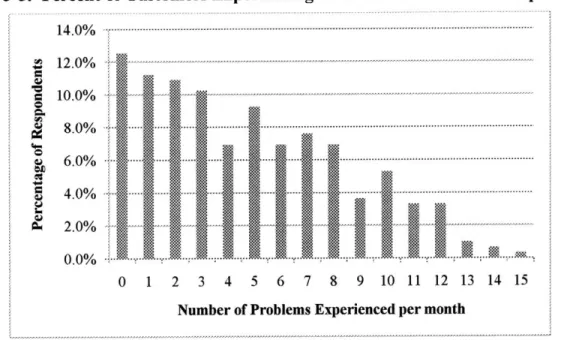
Figure 3-5: Percent of Customers Experiencing Each Number of Problems per Month... 54
Figure 4-1: Service Quality Factor Structure Option 1...72
Figure 4-2: Service Quality Factor Structure Option 2...72
Figure 4-3: Structural Equation Modeling Results - Configuration A.... ... 77
Figure 4-4: Structural Equation Modeling Results - Configuration B...83
Figure 5-la: Captive Riders MGA Model Results - Configuration B... ... 92
Figure 5-lb: Choice Riders MGA Model Results - Configuration B...92
Figure 5-2: Distribution of Accessibility Ratings... 97
Figure 5-3a: Low Accessibility MGA Model Results - Configuration B... 100
Figure 5-3b: High Accessibility MGA Model Results - Configuration B...100
Figure 5-4a: Bus MGA Model Results - Configuration B...107
1
Introduction
Across the United States, public transportation struggles to compete with the convenience of the private automobile. When transit agencies do see a growth in ridership, it can often be attributed to exogenous factors (e.g. high gas prices) that encourage persons with other available modes to choose public transportation for at least some trips (Foote, Stuart and Elmore-Yalch 2001). Many service industries have realized the benefit of quantifying the influences of customer loyalty and have developed methods for doing so. This thesis aims to gain a more thorough understanding of customer loyalty to public transportation systems over other available modes. The specific factors that influence loyalty will be determined and the interactions between these factors examined using factor analysis and structural equation modeling. Differences in the loyalty model among various market segmentations will also be analyzed in order to gain a better understanding of what drives various parts of the diverse transit customer base to continue to use the mode. The Chicago Transit Authority will be used as a case study using data from the 2008 Customer Experience Survey. Results of this analysis will be used to suggest service provision improvements and marketing strategies that will help increase customer loyalty for the agency.
1.1 Setting the Stage
The concept of gaining long-term customers has been widely studied in private, competitive industry as its benefits can prove to be the driver of company development and success. In his book The Loyally E/fect, Frederick Reichheld states, "[r]etention is not simply one more operating statistic, it is the central gauge that integrates all the dimensions of a business[...]" (1996) Understanding customer loyalty has long been a business tool of private industry and this research will try to bring these benefits to the public transportation field.
Traditionally, marketing strategies in public transportation have focused on attracting new riders, with fewer resources devoted to keeping current customers satisfied. However, having a strict focus on bringing in new customers could even be considered an underutilization of resources. Increasing market share is, of course, the goal of every transit agency but a more effective way of doing so may be to shift some of the focus from increasing new customers to increasing customer loyalty since customer retention not only increases market share but has many other benefits (Murphy 200 1).
Even with the goals of marketing aligned towards gaining long-term customers, the public sector is still at a disadvantage when compared with private industry. In the past, marketing was generally a distant focus for public agencies, never receiving much creative attention. As a stronger managerial focus has emerged, marketing usually has been given its own department and has begun to play a more important role (Walsh 1994). On the other hand, the private sector has long devoted their most creative minds to creating marketing campaigns that reach their targeted customers most effectively, expose them to the product or service, and
eventually increase profitability. Unfortunately, budget constraints and inertia inhibit the public sector from focusing the same level of resources on marketing as the private sector. As a result, the public sector must be creative with their limited funds to create strategic marketing
campaigns that target the appropriate market segments with the appropriate message.
Understanding the drivers of customer loyalty and which of their customers are most affected by these drivers will allow transit agencies to create marketing strategies that help them gain the greatest return on their investment.
1.2 Significance and Benefits of Customer Loyalty
What can increasing customer loyalty do for an organization? The benefits that will be discussed are in the context of private industry, however the ties to the public transportation industry are plentiful and these parallels will be noted as each benefit is presented.
In a private, competitive market, the number one goal is to increase profits through some combination of reducing costs and increasing revenue. Most companies quickly jump to the obvious strategy of adding new customers. However, focusing solely on gaining new customers may not be the most efficient way to increase profitability. The flow of customers who use a particular product or service is dynamic; there are always new customers entering but at the other end, current customers defect and switch to a competing alternative. Broadening the focus to retaining current customers can help boost profits since the cost of acquiring new customers is generally much greater than that of retaining current patrons (Murphy 2001). Customers who already use the product or service do not require any attraction and education costs because they are already familiar with the company and its product. Persuading a current customer to make a future purchase that they may not otherwise have made adds the same amount of revenue as getting a new customer to make that same purchase.
Focusing on areas that will keep current patrons coming back also has the side benefit of indirectly attracting new customers since both groups are interested in similar services or product qualities. Studies have shown that increasing loyalty by just 2% leads to a 10% cost reduction (Passikoff 2006). While the public transportation industry's main focus is not making a profit but staying competitive in the transportation market, limited budgets make it important both to find ways to cut costs and to increase revenue at the same cost. It seems likely that focusing
A loyal customer will continue to purchase or use the product or service in the future; however, not only do they continue their patronage but they also tend to increase their purchase volume over time (Reichheld 1996). As their trust in a product or service provider increases, they will feel more comfortable increasing and diversifying their purchases with that provider. Again, the translation to the transit industry is clear. For example, a person may start to take the bus for their commute trip to avoid high downtown parking costs. If they receive quality service and are satisfied with the service, they will become more comfortable with this travel option and may start using it for other trips.
Another benefit of repeat customers who trust the product or service provider is that they will be more likely to give that provider the benefit of the doubt when problems arise. If they have one negative experience, a loyal customer will be less likely to defect because they know their overall experience has been positive and they trust that the provider will correct the mistake so that the problem is not repeated. A first time train rider may never ride again if they happen to be on a train that experiences a long delay, whereas, a loyal rider knows that this is not a common occurrence and this one bad experience is less likely to cause them to choose another mode. Similarly, customers who trust the product or service will be less likely to be attracted by
competing marketing strategies. They know what their current service offers and are less likely to switch to a new service because it brings an element of the unknown. This knowledge of their
chosen product or service also makes them less dependent on employees for information, freeing staff time for other duties (Reichheld 1996).
Finally, recommendations given by loyal customers to non-users are of great value to the company or agency. Non-users who are unfamiliar with the product or service to which they are being recommended are more likely to believe the opinions of someone they trust over the
advertisements or marketing campaigns for an unfamiliar product or service (Reichheld 1996). This not only reduces marketing costs for the company but there are also strong indications that these referred customers are more likely to become loyal customers themselves (Murphy 2001). As stated previously, people rely heavily on their mode of transportation to get them to their destination on-time and without problems; it plays a crucial role in their lives and it may be difficult to convince them to change their current habits. However, having a recommendation from a family member or friend may be the best way to get them to do so. The opinion of those they trust will most likely be more persuasive than the advertisements of the transit agency themselves.
1.3 How Can Transit Agencies Realize the Benefits and Increase Loyalty?
The benefits are plentiful and many companies have concluded that increasing customer loyalty is an effective business strategy. The next question is, how can this be achieved? In any business, the customers should be the focal point and attention should be paid to understanding and satisfying their needs. Companies who recognize the importance of loyalty steadfastly follow this principle. These companies considered their customers to be assets and, just as with a physical asset, they will do everything possible to maintain them and maximize their value
(Reichheld 1996). Understanding their customers is not a static task; continuous market research and customer surveys must be used to track their changing expectations and to increase the value provided (Passikoff 2006). This customer value is enhanced by product or service
improvements and only the customer can inform the company of areas where improvements would provide them with the greatest additional benefit. Without proper research, the company may improve areas that are inconsistent with the customers' expectations and thus they will not provide the maximum benefit to their customers. Once key areas as established by the patrons
have been identified, it is necessary to track and assess the cost and impact of the improvements in order to achieve the best return on future investments (Murphy 2001).
Service improvements are only half of the battle. Marketing strategies also need to be developed in way that will show the most increase in repeat patronage and will garner an emotional attachment to the product or service. Companies should find ways to reach out to their loyal customers and to make them feel appreciated. They provide numerous benefits to the company and it is crucial to do whatever is possible to increase their satisfaction and keep them from switching to competitors. The remainder of this thesis will provide a methodology for realizing these benefits by determining the keys areas on which to focus these service improvements and the key customer bases to which to direct these marketing strategies.
1.4 Research Objectives
Given the wide array of benefits that increased customer loyalty provides, this thesis will explore how these benefits can be achieved in the public transportation industry by accomplishing the following objectives:
" Review the existing literature to provide evidence from other industries that increasing customer loyalty is an efficient way to increase revenue, since loyal customers provide many benefits that new customers do not.
" Use the Chicago Transit Authority as a case study to find the most influential factors to increasing customer loyalty to transit agencies and determine the strengths of the interactions among these factors and between these factors and loyalty.
" Examine loyalty model differences among various market segments. It is hypothesized that the following market segmentations will be of interest:
o High accessibility versus low accessibility
o Transit dependents versus choice riders
o Bus riders versus rail riders
" Use model results to make recommendations on how to increase customer loyalty in the transit industry:
o Improvements to what factors of service provision would show the most return on investment in terms of loyalty?
o What market segments should be targeted?
e Provide suggestions for implementing this type of research at other transit agencies.
1.5 Research Approach
The first step to exploring customer loyalty in the public transportation industry is to complete an extensive literature review of its various conceptual and operational definitions. These
definitions will then be adapted to the transit context. Research on the exact approaches used in other industries to model loyalty's influencing factors must also be conducted. Each of the hypothesized influencing factors should then be researched in order to gain a full understanding of what they entail, how they have been measured in the past, and how they have been applied.
After an exhaustive literature review resulting in hypotheses about influencing factors of loyalty to transit agencies, a case study can be undertaken. The case study provides an example of how the methodologies for customer loyalty modeling that have been established in the literature can be applied in the public transportation industry. In this research, the Chicago Transit Authority (CTA) is used as the case study. The CTA conducts a biennial Customer Experience survey that contains proxies for many of the factors that are likely to affect loyalty.
The most recent version of this data (2008) was used for this research. While it would be ideal to have two agencies in the case study, there was no other data available from another transit
agency that could be used in a parallel analysis. A case study provides a good example of the information that can be gleaned from this type of study, but it should not divert the focus away from developing generalizable results. Transit agencies across the country face similar
circumstances; they must provide attractive services to as many customers as possible within a budget constraint. These customers are diverse and are looking for a variety of attributes in their trip-making. While specific characteristics of the geographic area served may have some impact on loyalty, the fundamental factors that drive loyalty should be similar. This type of analysis has the additional benefit of being able to measure the interactions between these factors rather than just comparing static measurements of the various contributing factors. The benefits discussed
earlier are important to all transit agencies that want to increase their ridership and revenues and provide better service to their current customers, which is likely to lead to new customers in the future.
To conduct the actual analysis, methods used in other industries were reviewed. The most common method, used by the service management, telecommunications, and airline
industries, is structural equation modeling to hypothesize and validate the relationships between various motivators and customer loyalty (Bloemer et. al 1990, Lu and Lu 2009, Chou and
Changwan 2009, Beerli et. al. 2004, Wen et. al. 2005, Zins 2001, Park et. al. 2006). Based on the sample size, structure, and detail of the available data, structural equation modeling was also chosen as the appropriate analytical method for this study. There will be many different formulations of the model structure, testing all interesting hypotheses about the relationships between the influencing factors and loyalty. Initially, the model will be tested using the entire
data set; the final version of the model will be chosen when theory is supported and statistical goodness of fit measures are the highest of all theoretically sound models.
Once the model fit has been confirmed, this model should be applied to various subsets of that data. There is a distinct division among transit riders between those who choose to take transit over other available modes and those who take transit because it is their only option. It is likely that the loyalty drivers for each of these groups are different given their varied needs. Choice riders may fit the more traditional loyalty definition, whereas transit-dependent riders may have a modified or completely separate set of motivators. It is also possible that loyalty motivators vary between those customers who (primarily) ride the bus and those who take the train. Since rail operates in its own right of way, it is not as heavily influenced by outside factors such as traffic signals and congestions. Bus operations do not enjoy this luxury. This causes a distinct division in service quality, which could lead to significant differences in the loyalty
patterns of the two transit modes; these differences will be explored in this study. Finally, loyalty differences are also expected between customers who have direct and convenient access to transit and those who have to walk long distances and make difficult journeys just to get to a bus stop or station. Those with poor accessibility might have particularly negative views of the transit agency because they feel that they are not being served as well as they should. Again, these differences could be reflected in the loyalty models. For all segmentations, significant differences in the models will be noted and analyzed.
Results will then be summarized so that recommendations can be developed for loyalty modeling in the public transportation industry. Depending on the findings when using the various subsets of the data, it may be necessary to tailor these recommendations to individual
the motivating factors that exerted the most influence on customer retention. Creative ideas on how to improve factors that are not easily quantifiable should be proposed. Having proven the benefits of a loyal customer base and with the motivating factors established, suggestions on future customer research should be made to allow for active and continued monitoring of loyalty at the agency.
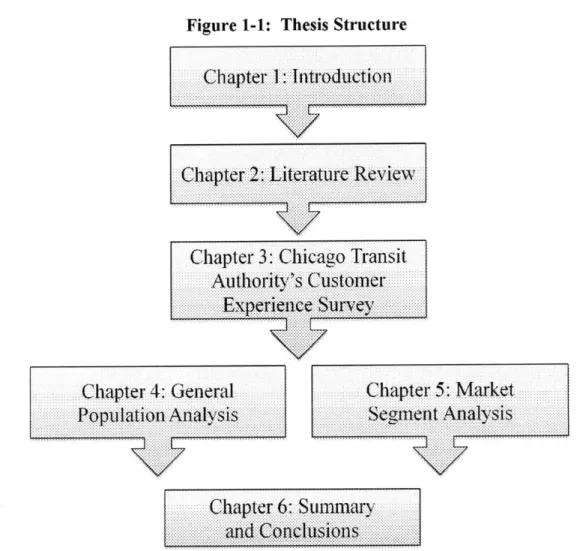
1.6 Thesis Organization
This thesis follows the structure laid out in Figure 1-1.
Figure 1-1: Thesis Structure
Chapter 1: Introduction
Chapter 2: Literature Review
Chapter 3: Chicago Transit
Authority s Customer
Experience Survey.
Chapter 4: General
Chapter 5: Market
Population Analysis
Segment Analysis
Chapter 6: Summary
and Conclusions
Chapter 2 explores the literature on customer loyalty and its antecedents in other
used to test the relationships between these factors. The third chapter describes the Chicago Transit Authority's Customer Experience survey which is used as the case study in this analysis. 4 creates and examines a loyalty model based on the entire usable CTA Customer Experience Survey respondent population, followed by Chapter 5, which investigates how loyalty differs among various groups within the population. Chapter 6 summarizes and draws conclusion from this research.
2
Literature Review
Due to limited literature and a lack of theory for understanding customer loyalty in the public transportation industry, the literature reviewed is based on other industries. These industries
provide meaningful insights into the definition of customer loyalty, the factors that shape a patron's preference for one product or service over another, and the methodologies used to examine the relationships between the two. First, customer loyalty will be defined conceptually and operationally in order to provide a clear picture of this construct. Next, antecedents of customer loyalty that are commonly explored in other industries will be described. Once the definitions of loyalty and its influencing factors have been established, the methods used by other industries to examine the relationships between them will be reviewed. Finally, the most appropriate factors and methodologies for application in the public transportation industry will be chosen for use in the remainder of this research.
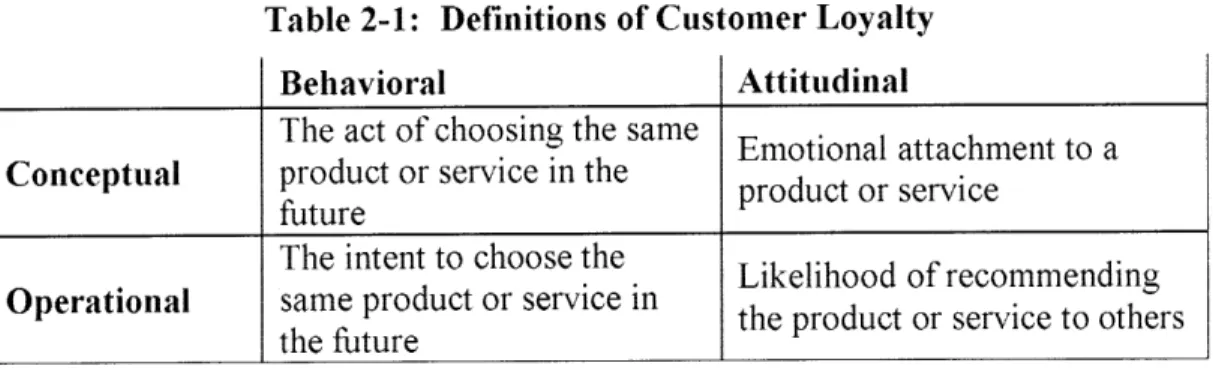
2.1 Definitions of Customer Loyalty
Before moving forward, a sound definition of customer loyalty needs to be established. Since this concept is not concrete, it is useful to consider its definition in two parts: conceptual and operational. The conceptual definition provides the abstract meaning whereas an operational definition provides a concrete way to model the concept.
2.1.1 Conceptual Definition
Private industry has had an on-going debate on the conceptual definition of customer loyalty and while a clear consensus has yet to emerge, there are some common threads that appear
throughout the literature that seem to be accepted. Loyalty can be divided into two aspects. The first is behavioral; this is the surface level aspect of loyalty that is indicated by someone's
repetitive selection of a certain brand over the competition (Odin et. al. 2001). This brand (or product) selection is driven by some psychological decision-making process which may not always seem rational. However, these seemingly illogical choices can usually be traced to the
second aspect of loyalty, the attitudinal aspect. A customer's purchase or service selection decisions are not made entirely on concrete fact comparison but rather on a combination of facts and emotion. If a customer develops an emotional attachment to a product or service, they will have increased trust and this trust might influence their decision making process beyond the objective facts. Dick and Basu (1994) discuss these two aspects as separate entities that integrate to form a customer's total loyalty stating that loyalty is the "[... ] relationship between the
relative attitude toward an entity (brand/service/store/vendor) and patronage behavior." This two-part behavioral-attitudinal definition of loyalty is what will be used throughout the remainder of this thesis.
2.1.2 Operational Definition
The operational definition provides a way for abstract concepts to be represented as tangible and functional constructs. Again, the literature does not give a universal way of defining customer loyalty operationally; however, there are three main components that are used in combination to provide a concrete picture of a customer's behavioral and emotional attachment to a product or service. These components are intent to repurchase or reuse, likelihood of recommending to others, and overall customer satisfaction (Allen 2004).
The first of these components is aimed at measuring the customer's willingness to choose the same product or service in future purchase decisions. This does not map exactly to the behavioral aspect of the conceptual definition since that refers strictly to the act of choosing the same product or service again, not simply the intent to do so. Ideally the statement of repurchase intention would be validated against actual repurchase behavior data. However, since time series 25
data is usually hard to collect for individual customers, generally the intent of future use or purchase is used as the best indicator of continued patronage.
The link between attitudinal loyalty and an operational construct lies in the likelihood of a customer recommending a given product (or service) to others. The act of repeat purchase or reuse is a passive way of showing loyalty, whereas encouraging friends and family to use the product or service is an active effort. With an emotional attachment, the customer feels
compelled to spread the information on the product (or service) benefits to those close to them. Taking this one step further, a customer can be considered to be an advocate of the product or service, meaning they actively seek opportunities to promote the company to non-users; be it casually to friends or in a formal setting. Making recommendations to others is an important component of customer loyalty that should be measured and analyzed.
The final component that is sometimes used to define customer loyalty is customer satisfaction. Satisfaction can be described as the customer level of contentment with the product (or service). In some industries, this has sometimes been viewed as a perfect proxy for loyalty, but it can be argued that being satisfied with a product or service is only part of the complete picture. There are plenty of situations one can imagine in which a satisfied customer switches
services or where a dissatisfied customer remains loyal. The satisfied but defecting customer may not see anything wrong with the service he or she is leaving; they are just changing to an
option that better suits their needs. Murphy describes this scenario best in his book The Lifebelt
(2001):
Customer satisfaction used to be regarded as a positive feeling, but for many customers now it means the absence of a negative feeling. Many who say they are satisfied have neither negative nor positive feelings, but are neutral. They have no reason to leave and no reason to remain.
The dissatisfied yet seemingly loyal customer can be explained as follows. With certain services, there are some customers who do not have the luxury of switching providers, even when their current service falls below their expectations or desires. For these reasons, the remainder of the thesis will consider customer satisfaction to be a driver of customer loyalty,
rather than part of customer loyalty itself, an assumption that has been made in many other industries (Bloemer et. al. 1990, Olsen and Johnson 2005, Oliver 1999, Chou and Changwan 2009, Mittal and Kamakura 2001, Brown et. al. 2005).
Table 2-1 provides a summary of the conceptual and operational definitions of loyalty that will be used in this research.
Table 2-1: Definitions of Customer Loyalty
Behavioral Attitudinal
The act of choosing the same Emotional attachment to a Conceptual product or service in the product or service
future
The intent to choose the Likelihood of recommending Operational same product or service in the product or service to others
the future theproductorervicetoother
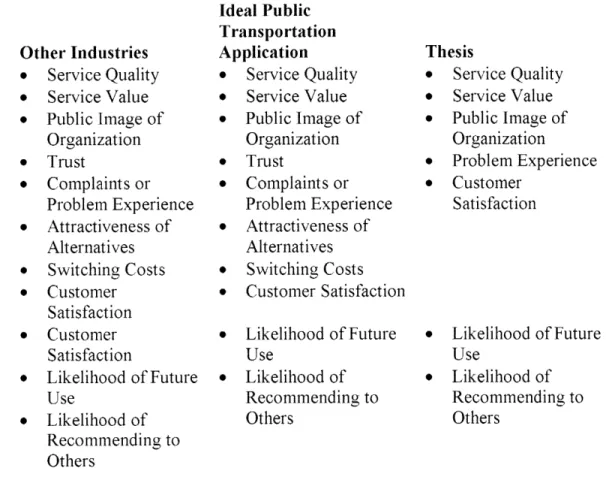
2.2 Antecedents of Customer Loyalty
Having conceptual and operational definitions of loyalty provides some basis for understanding the construct and provides a starting point for discovering its potential motivating factors. Similar studies have explored the influence of a wide array of factors on customer loyalty and within these disparate areas, common threads have emerged. These threads are then explored as potential motivators of public transportation customer loyalty.
Table 2-2 summarizes the factors that have been identified in other industries as influencing customer loyalty. While this list is not intended to be exhaustive, these factors
appeared most often in the reviewed literature and are thought to have the strongest potential for application in the public transportation industry.
Table 2-2: Factors Motivating Loyalty in Other Industries
Factor Used By:
Satisfaction Medical Care, Catering, Banking, High Speed Rail., Online Retail, Auto Repair Airlines
Service Ouality Catering, High Speed Rail, Banking, Online Retail, Auto Repair, Airlines
Service Value and Price Fairness Catering, Online Retail, Airlines, Auto Repair
Public Image of the Organization Banking, High Speed Rail, Airlines
Trust Medical Care, Auto Repair
Complaints or Problem Experience High Speed Rail
Attractiveness ofAlternatives Medical Care, Banking
and Switching Costs
2.2.1 Satisfaction
Customer satisfaction is the level of contentment that results from the difference in what a user was expecting from a service and what he or she actually received (Bloemer et. al. 1990). Thus satisfaction can be thought of as a post-usage assessment of the service. This type of service evaluation can pertain either to one particular service experience (i.e. transaction specific satisfaction) or to the collective evaluation of the historical experiences the customer has had with the service (i.e. cumulative satisfaction) (Olsen and Johnson 2005). To measure a service providers' past and future performance most effectively, the literature suggests that cumulative satisfaction is the better indicator.
Oliver (1999) argues that, although satisfaction is a necessary element in predicting loyalty, it is not sufficient to use satisfaction as the sole indicator of loyalty. There is no direct equivalence between satisfied customers and loyal customers, even though conversely, loyal
customers are usually satisfied (Chou and Changwan 2009). There are many studies that have used satisfaction and loyalty as two separate entities, as shown in Table 2-2. When measured
separately, there is strong evidence that satisfaction influences both customer repurchase
intentions and the likelihood of recommending the service to others (Mittal and Kamakura 2001, Brown et. al. 2005). In order to examine these influence, satisfaction will be measured separately
from loyalty in this thesis and its interactions with both of the components of customer loyalty analyzed.
2.2.2 Service Quality
Service quality is the customer's evaluation of the execution of the service provided. Measuring it can often be difficult, as it involves not only the evaluation of the outcome of the service, but also the actual process of service delivery (Parasuraman 1985). There have been numerous efforts to categorize the various aspects of service quality (Parasuraman 1985, Brady and Cronin 2001, Cronin and Taylor 1992, Dabholkar et. al. 2000). Since customers' perceptions of a company's performance are based on individual components, the literature supports using customer evaluations of these individual components of service quality to form a measure of overall service quality, rather than using a single summary measure (Brady and Cronin 2001). Since the customer journey begins at varying stages, it is important to measure those key touch-points where the customer's experience is most likely to be impacted by problems.
While the conceptual definition of service quality can be applied widely across service industries, each industry operationalizes this concept in a distinct manner. For instance, in the telecommunications world, one of the many aspects of service quality may be how many calls are dropped due to poor connections; however, this is clearly irrelevant to the quality of service
at a restaurant chain. There are elements of service quality that are important to specific industries that may not be at all generalizable. Therefore, it is important for each industry to
determine its own set of service quality characteristics that best suit the service they provide. In public transportation, areas such as service reliability, comfort, safety, and communications are often considered to be key dimensions of service quality.
2.2.3 Public Image
The consumer's image of a service provider can have a lasting effect on how they perceive the performance of the service being delivered. The public image of the organization is generally thought to be derived from attitudes accumulated through direct experience with the service combined with indirect experiences through marketing and communications (Andreassen and Lindestad 1998). Gronroos (1988) describes image as a preconceived notion or memory of an organization held by the customer that may influence the perception of the service provided. There has been debate, however, on whether image affects customer loyalty directly or is
mediated by other factors (Bloemer et. al. 1990). Dowling suggests that in the airline industry, a passenger's evaluation of service quality and service value is influenced by the perception of airline image (Dowling 1994). It has also been speculated that image not only influences perceptions of service quality and value of service but also a customer's satisfaction with the
service (Andreassen and Lindestad 1998). 2.2.4 Trust
In industries where one-on-one employee-to-customer relationships are the focus of the service provided, trust is an important construct. As with any human interaction, trust is a key factor in forming a lasting positive relationship. In the literature, trust was included in the loyalty model for both the medical care and auto repair industries. The customer must have complete
confidence when putting their health or automobile in another's hands, and if that trust is broken the customer will be highly unlikely to feel comfortable returning to that particular service provider.
2.2.5 Service Value and Price Fairness
Service value captures the difference between the benefits received and costs paid for a service; a high-benefit, low-cost service will have a high value whereas a low-benefit, high-cost service will be perceived as providing low value (Lee and Cunningham 2001). Human nature is for a customer to tend toward products and services that provide them with what they see as greater value for money. Quantifying value can be a formidable task. A customer's value of a service depends on variables such as costs (monetary and non-monetary), tastes and preferences, and characteristics of the customers themselves (Bolton and Drew 1991). Non-monetary value-added components of a service can provide great benefit to the user and have been the subject of much research. However, these components are usually very difficult to measure. The monetary component is also important; customers must feel that the price of the product or service is reasonable so that they are willing to pay it.
Adding another level of complexity, perceived value is also dependent on the specific service situation and varies considerably by the circumstances under which the evaluation of the service occurs (Holbrook and Corfman 1985). A customer who has just had a bad experience with the service will perceive its value to be much lower than someone who has just received superior service.
2.2.6 Complaints or Problem Experience
With any service, the delivery process will occasionally suffer disruptions which will be undesirable to customers. While minimizing these problems is a goal of all organizations, it is impossible to eliminate them completely, and therefore their impact must be examined. Hocutt and Stone (1998) state that it takes only one bad experience to have a lasting negative effect on the customer's satisfaction with the service. It follows that as customers encounter more service delivery problems, they will evaluate the quality of service received more negatively. These
negative impacts are then reflected in customers' service quality evaluations and outcome measures such as customer satisfaction.
A less explored relationship is that between problem experience and corporate image. In a public transportation context considering the complexity of the public's perception of the agency, this interaction is important to understand, and should be included in the loyalty model. It is hypothesized that this relationship is reciprocal in nature; a poor image of the company will cause a customer to perceive and report a higher incidence of problems, just as encountering more problems will negatively impact a customer's image of the company.
2.2.7 Attractiveness of Alternatives and Switching Costs
These two concepts are intertwined and involve some of the same concepts. Attractiveness of alternatives is the customer's perception of other available services that provide similar functions as the current provider (Jones et. al. 2000). Switching costs are what the customer sees to be the economic, emotional, and psychological costs related to switching service providers (Selnes
1993). If these costs are greater than the incremental benefit the individual will receive by making the change, they are unlikely to make the change (Withey and Cooper 1989). Both of these constructs are thought to influence loyalty. As better alternatives become available with incremental benefits exceeding the switching costs, customers will begin to defect from their current provider. This effect, of course, varies by industry (Fornell 1992); for example, the emotional costs of switching to a new primary care provider may be much greater than in other non-personal service industries causing patients to be highly unlikely to switch away from a satisfactory provider.
Due to differences between industries, not all of these factors will be relevant to public transportation. However, it is important to understand and consider each to decide whether or not they should be included in the transit loyalty model.
2.3 Customer Loyalty Modeling Methodologies
Many industries have realized the benefits of understanding what motivates its customers to be loyal to their product or service by creating models that describe the interactions between the influencing factors and loyalty itself To define the hypothesized drivers of customer loyalty, factor analysis is used and the most common technique to examine the relationships between these drivers and loyalty is structural equation modeling (SEM). SEM allows for the creation of latent factors which aggregate observed variables into categories (or factors) that describe an underlying concept of these variables. It also enables the researcher to test the interactions between these factors in a more complex manner, creating a web of factors connected by
directional paths (Garson 2010). The follow list is a selection of industries that have applied this methodology.
* Banking (Bloemer et. al. 1990, e Medical Care (Torres et. al. 2009)
Beerli et. al. 2004) 9 Education (Helgesen 2008)
e Telecommunications (Lai et. al. 0 Online Retail (Kim 2009)
2009) 0 Tourism (Chia 2008)
" Auto Service and Repair (Yieh et. al. 2007)
This technique has also been used successfully in other transportation sectors, such as the airlines and intercity bus and rail operations in Taiwan (Chou and Changwan 2009, Wen et. al. 2005, Zins 2001, Park et. al. 2006).
To test the differences among market segments, multiple-indicator multiple-cause analysis (MIMIC) and multiple group analysis (MGA) can both be used as extensions to the established structural equation model. Factor analysis, SEM, MIMIC, and MGA will each be described in detail in the following sections.
2.3.1 Factor Analysis
This statistical method is used when a researcher has a large set of variables which they wish to reduce to smaller subsets. Once each variable (or indicator) has been assigned to a subset (or factor), a common theme should emerge that can be used to characterize each factor. Factor analysis can be used for both data reduction and structure exploration. Data reduction is helpful when the researcher is faced with a very large dataset that would be impossible to model if all of the available variables were used. Factor analysis can be used to select those variables that have the highest correlation with each factor. The second application of this statistical method is for structure exploration, which is used to identify the interrelations among the variables. Both methods will be used in this application. The indicators (survey question responses) will be grouped into factors to represent the various drivers of customer loyalty and then data reduction will be used to ensure that only the most appropriate indicators are analyzed.
With the concept and purpose of factor analysis described, it is now necessary to examine the process itself There are two stages to this method, exploratory and confirmatory factor analysis. Exploratory factor analysis (EFA) is used to identify the structure of the indicators and should be employed when the researcher has no apriori beliefs about which indicators will be associated with which factors. In cases where a priori knowledge or theoretical reasoning can be used to group certain indicators under common factors, this step becomes unnecessary because the structure is already hypothesized. For instances where EFA is required, the researcher must first determine the number of factors to extract. This can be done with a variety of tests. In this research, the Kaiser Criteron will be used. This test examines the eigenvalues, or the amount of variance extracted with each factor, and suggests that the factor should be kept as long as its eigenvalue is above 1, meaning that the factor extracts as least as much as the equivalent of one
original variable (StatSoft, Inc. 2010) Having determined the number of factors to be used, EFA can be used to identify which indicators can be grouped together to form these factors.
Confirmatory factor analysis (CFA) determines if the loadings of the indicators onto their specified factors follow the hypotheses formed using either a priori knowledge or EFA. Factor loadings are the correlation coefficients between the indicators and the factors. Ideally, these loadings should be above 0.70 to confirm that the factor describes at least half of the variance of the indicator. Realistically, study data usually does not meet this standard and the researcher must always use theory to interpret the appropriateness of factor loadings based on theoretical beliefs rather than relying on pre-established thresholds. If a factor loading is extraordinarily low or lower than that of the other indicators for that factor, the corresponding indicator should be considered for elimination from the analysis and should only be kept if the researcher feels it is important to the definition of the factor.
After appropriate eliminations have been made, it should be determined if any indicators have correlated error terms. If they do, this could signify that those indicators are not only correlated due to being grouped to the same factor, but that some of the correlation is brought on by an outside unmeasured variable. To determine the existence of these correlations, the
modification indices can be examined. Modification indices provide the predicted drop in the chi-square (i.e. improvement in fit) if the correlation is allowed to be freely estimated in the model (Muth6n and Muth6n 2007). The higher the index, the more justification there is for action to be taken. In this situation, one of the indicators should be eliminated or the researcher should allow for this error term correlation to be freely estimated in the analysis.
Depending on the number of indicators, the number of factors into which they grouped, and the theoretical concept being explained, it is possible that a second round of factor analysis is
needed. This second-order factor analysis examines the correlation matrix of the factors
themselves to determine if they too can be grouped to form another level of factors to which they act as indicators. This may be necessary when the dataset is very complex or when the first-tier factors are important but only to define the second-tier factors. Establishing the second level of factors is done using the same procedures as described above.
Once all of the above steps have been taken, goodness of fit measures should be examined to ensure that they are at an acceptable level. This ensures that the most appropriate factor-indicator groupings are being used, which increases the strength of the subsequent
structural equation models by introducing less error in the latent variables. Appendix A lists the acceptable levels for goodness of fit and other statistical measures used in this analysis.
2.3.2 Structural Equation Modeling
Structural equation modeling (SEM) is used to test simultaneously the interrelation of constructs and their influence on a dependent variable. This method has the ability to provide powerful results in a variety of applications. It combines well-studied statistical practices with a theory-based network of observed and unobserved variables (Chin et. al. 2008). Each of the unobserved variables is represented by a collection of observed variables. For the purposes of this model, the
observed variables are considered constructs of customer loyalty.
The SEM method involves two concurrent steps, a confirmatory measurement model followed by a confirmatory structural model. The measurement model establishes the
relationship between the indicators and the factors, which should reflect the results of the factor analysis. The structural model specifies and tests the theory-based hypotheses made about the relationships between exogenous and endogenous factors and observed constructs (Anderson and Gerbing 1988). In the context of this model, the hypotheses make inferences about the
estimation of measurement errors for the observed variables, which offers the researcher more confidence in the unbiased nature of the path coefficients. For each endogenous variable, the amount of unaccounted variance due to unmeasured causes is also reported, known as
disturbance (Golob 2003). The results of a completed model provide insight into the relative strengths of the various relationships and the overall goodness of fit of the theoretical model being tested.
The relationships between model factors can be categorized into three types: direct, indirect, and total effects. Direct effects are those that occur between factors, without any other intermediate factors. Indirect effects are those that occur between factors through a mediating factor and are quantified by multiplying the path coefficient from the exogenous to the mediating variable by the path coefficient from the mediating variable to the endogenous variable (Golob 2003). The combination of direct and indirect effects creates the total effect. Figure 2-1 represents the direct and indirect effects.
Once specified, the overall fit of the model is assessed using a variety of goodness of fit measures. Each of the hypotheses are then accepted or rejected by examining the significance of the calculated path coefficients. Finally, R2 values are reported for each of the endogenous variables which indicates how much of that construct's variance is explained by the model structure. Acceptable values for statistics such as factor loadings and goodness-of-fit measures are summarized in Appendix A.
SEM has been applied in many contexts including psychology, biological science, political science, and market research (as in this research). Although it has not been applied
behavior research, starting as early as 1980 (Den Boon 1980, Lyon 1981, Golob et. al. 1996, Morikawa and Sasaki 1998, Pendyala 1998, Lu and Pas 1999, Fujii and Kitamura 2000).
Figure 2-1: Effect of Variable A on Variable B a) Direct Effect
Latent Latent
Variable A Variable B
b) Indirect Effect (via Variable C)
Latent Latent Latent
Variable A (Variable C / Variable B
2.3.3 Multiple-Indicator Multiple-Cause (MIMIC) Analysis
MIMIC modeling allows the researcher to alter the structural model by regressing model factors on heterogeneity defining characteristics; factor loadings of the indicators are held constant across groups. For example, a latent variable, such as service value, can be regressed against an accessibility dummy variable (0=1ow accessibility, 1=high accessibility). This allows the researcher to determine if the factor means vary between groups. The path coefficient between the gender variable and service value will be statistically equivalent to zero if accessibility does not have any effect on service value ratings; if it is significant and non-zero, service value ratings do vary between accessibility levels.
2.3.4 Multiple Group Analysis (MGA)
The other method for testing for heterogeneity is multiple group analysis (MGA). MGA allows for factor loadings and path coefficients to be estimated freely across groups; the least