HAL Id: hal-02151784
https://hal-amu.archives-ouvertes.fr/hal-02151784
Submitted on 10 Jun 2019
HAL is a multi-disciplinary open access
archive for the deposit and dissemination of
sci-entific research documents, whether they are
pub-lished or not. The documents may come from
teaching and research institutions in France or
abroad, or from public or private research centers.
L’archive ouverte pluridisciplinaire HAL, est
destinée au dépôt et à la diffusion de documents
scientifiques de niveau recherche, publiés ou non,
émanant des établissements d’enseignement et de
recherche français ou étrangers, des laboratoires
publics ou privés.
Radical-assisted polymerisation in interstellar ice
analogues: formyl radical and polyoxymethylene
T. Butscher, Fabrice Duvernay, G. Danger, R Torro, G Lucas, Y Carissan, D.
Hagebaum-Reignier, T Chiavassa
To cite this version:
T. Butscher, Fabrice Duvernay, G. Danger, R Torro, G Lucas, et al.. Radical-assisted polymerisation
in interstellar ice analogues: formyl radical and polyoxymethylene. Monthly Notices of the Royal
Astronomical Society: Letters, Oxford Journals, 2019, �10.1093/mnras/stz879�. �hal-02151784�
radical and polyoxymethylene
T. Butscher,
1
F. Duvernay,
1
?
G. Danger,
1
R. Torro,
2
G. Lucas,
2
Y. Carissan,
2
D. Hagebaum-Reignier,
12
and T. Chiavassa
1
Aix Marseille Univ, CNRS, PIIM, Marseille, France2Aix Marseille Univ, CNRS, Centrale Marseille, ISM2, Marseille, France
Accepted XXX. Received YYY; in original form ZZZ ABSTRACT
We present new laboratory experiments on the low-temperature formation of COMs such as polyoxymethylene (POM), glycolaldehyde (GA), ethylene glycol (EG) and possibly glycer-aldehyde (GCA) and glycerol (GCO) through radical-induced reactivity from VUV photolysis of formaldehyde in Ar and Xe matrices. The radical reactivity and the endogenous formation of COMs were monitored in-situ via infrared spectroscopy in the solid state and post photol-ysis with temperature programmed desorption (TPD) using a quadripole mass spectrometer. Based on experimental finding and quantum calculations, we elaborate a formation pathway for formaldehyde polymerisation induced by radicals ( HCO and CH2OH) that support the
POM formation in cometary environments. In addition, fragmentation patterns obtained from the sublimation of short chain-length POM are consistent with data collected by the Ptolemy instrument on-board the Rosetta mission and strengthen the POM identification made by this instrument.
Key words: Astrochemistry – Molecular processes– Comets:general– Methods: laboratory: molecular
1 INTRODUCTION
About 180 organic molecules were observed in the interstellar medium. They are generally simple molecules but almost 50 of them have 6 or more atoms and are called Complex Organic Molecules, hereafter COMs (Woods et al. 2013). Despite the large molecular diversity and complexity observed in space in most cases we are unaware of their formation mechanism. However, it is generally accepted that COMs form on the surfaces of icy dust grains. This idea is supported by laboratory results and astrochemical simula-tions, indicating that surface and bulk reactions induced by atom addition/abstraction, cosmic rays, VUV-photons, and by thermal processing are efficient processing for COMs formation in space.
In cold and dark environments (molecular clouds or dense cores), non-energetic processing mainly consists of atomic and hy-drogenation reactions. One of the most well known reaction is the CO hydrogenation (Watanabe et al. 2003,2004;Fuchs et al. 2009;
Minissale et al. 2016):
CO→H HCO→H H2CO→H CH2OH→H CH3OH Along H-atom addition reactions on CO, two important radicals are formed HCO and CH2OH. It has been recently proven that direct recombination HCO and CH2OH free radicals form
glycolalde-? E-mail:[email protected]
hdye (GA, HOCH2CHO), ethylene glycol (EG, HOCH2CH2OH)
(Butscher et al. 2015;Fedoseev et al. 2015;Chuang et al. 2015,
2017;Fedoseev et al. 2017). However,Butscher et al.(2017)
re-cently showed that HCO in astrophysical conditions is not able to dimerise into glyoxal (CHOCHO) but instead forms CO and H2CO:
CH2OH + HCO → HOCH2CHO
CH2OH + CH2OH → HOCH2CH2OH
HCO + HCO → CO + H2CO
Similar mechanisms based non-energetic processing and rad-ical recombination in interstellar ice analogues can also re-sult in the formation of biologically relevant molecules such as glyceraldehyde (GCA, HOCH2(OH)CHO) and glycerol (GCO, HOCH2CH(OH)CH2OH) (Fedoseev et al. 2017). In this reaction scheme, carbon backbone increase is realized through recombi-nation of CO-bearing radicals such as HCO and CH2OH on HOCH2CHOH intermediate radical formed from H-atom addi-tion/abstraction on GA and EG:
HOCH2CHO−−−−→+ H HOCH2CHOH−−−−−HCO→HOCH2CH(OH)CHO HOCH2CH2OH
−H
−−−−→HOCH2CHOH−−−−−−−CH2OH→HOCH2CH(OH)CH2OH
Energetic processing (photons, electrons, X-rays) that are prominent during later stages of the star and planet formation pro-cess can also trigger reactive intermediates and radicals forma-tion. It has been extensively shown that laboratory experiments on CH3OH-rich ice analogues exposed to such energetic processing
can efficiently produce a large diversity of COMs including amino acids and sugars. (Caro et al. 2002;Öberg et al. 2009;Abou Mrad
et al. 2014,2016;Kaiser et al. 2015;Henderson & Gudipati 2015;
Chuang et al. 2017).
COMs are also detected in comets that harbor the most pristine material in our solar system that may have preserved their interstel-lar heritage (Goesmann et al. 2015;Wright et al. 2015;Biver et al.
2014;Crovisier et al. 2004;Huebner 1987) as recently revealed by
the Rosetta mission. Twenty five minutes after lander Philae’s ini-tial comet touchdown onto comet 67P/Churyumov-Gerasimenko, COSAC instruments performed analyses that displayed 16 organic compounds -including CHO-bearing molecules such as glycolalde-hyde (GA) and ethylene glycol (EG)- while Ptolemy instrument detected regular mass distributions suggesting the presence of a radiation-induced POM-like polymer (Wright et al. 2015). This backs up analysis made with the PICCA instruments on comet Halley during the Giotto mission where a similar regular pattern of peaks has been observed, which was also tentatively assigned at that time to POM-like structures (Huebner 1987). Even if the POM detection by both Rosetta and Giotto missions is controver-sial (Mitchell et al. 1989;Altwegg et al. 2017), the presence of POM in comets (Schutte et al. 1993) cannot be excluded. First, it is so far the best candidate to explain the distributed source of CO and formaldehyde observed in coma (Cottin & Fray 2008; Fray
et al. 2006). It is also supported by laboratory experiments. POM
and POM-like polymers can be easily formed from the heating of interstellar/cometary ice analogs containing H2CO, H2O, and a
nu-cleophile (NH3, CN−) (Schutte et al. 1993;Danger et al. 2014;
Noble et al. 2012;Vinogradoff et al. 2011;Duvernay et al. 2014)
or from UV irradiation of interstellar/cometary ice analogues con-taining formaldehyde (Butscher et al. 2016).
Thus, by exposing energetic and non-energetic processing on ice analogues, COMs formation is indeed observed but almost no reaction intermediates are identified this way (Schutte et al. 1993;
Butscher et al. 2016;Bennett & Kaiser 2007). To solve this problem,
we resort to the cryogenic matrix technique. Already used before for the characterisation of radicals of astrophysical interest (
Milli-gan & Jacox 1969;Hiraoka et al. 1995;Pirim & Krim 2011;Lee
et al. 2015), it consists in trapping the starting material in a rare
gas matrix and submitting it to energetic processes. This way, all species are isolated from one another in a cold environment. This technique has two advantages. First, the way the molecules are iso-lated prevents them from rotating freely so that most of rotational contributions are removed and no intermolecular interactions are possible if molecules are present in monomeric form in their cage. The resulting spectrum becomes close to that of gas phase without rotational structure. Also, since trapped molecules are alone in their cage, reactive species are not able to find a partner to react with, so when radical species are produced, their lifetime and stability in the rare gas matrix are greatly increased, making their characterisation easier with infrared spectroscopy. Then, by quickly removing the rare gas cages, radicals and reactive species are free to react and recombine (Butscher et al. 2015,2017).
The objective of the present work is to go further in the under-standing of the reactivity of small organic radicals. Using cryogenic matrix technique, we specifically study the formaldehyde polymeri-sation initiated by radicals that might explain some observations made on comet 67P/Churyumov-Gerasimenko by the Ptolemy in-strument on-aboard Rosetta’s lander Philae (Wright et al. 2015) or on Halley comet by the Giotto mission. The experimental setup is described insection 2and the results of each step of our experiments as well as theoretical calculations are detailed insection 3.
Discus-sion includes a confrontation with astrophysical observations and implications.
2 EXPERIMENTAL AND COMPUTATIONAL METHODS
2.1 Experimental details
Argon an Xenon (99.999 % of purity) used as matrix rare gas (Rg) were purchased from Air Liquide. Formaldehyde was purchased as a polymer from Sigma Aldrich (99.95 % of purity) and was heated to about 90oC to produce the gas-phase monomer. For
refer-ences, glycolaldehyde was purchased as a dimer from Sigma Aldrich (99.95 % of purity) and heated under vacuum to about 80oC to
produce gas-phase monomer. Ethylene glycol was purchased from Sigma Aldrich. The experimental AHIIA system has already been described precisely in a previous article (Butscher et al. 2015).
All experiments described are performed in a high vacuum chamber with a background pressure of 10−8mbar at 295 K and
10−9mbar at 13 K. The temperature is controlled using a model 21
CTI cold head, a resistive heater and a Lakeshore 331 temperature controller. Products were mixed in 2/1000 ratio of H2CO/Rg in a Pyrex vacuum line using standard manometric techniques. Gaseous mixtures were deposited at a rate of 5 10−2 mbar s−1 on a
gold-plated surface kept at 30 K for xenon experiments and 13 K for argon experiments. Glycolaldehyde and ethylene glycol solid films can be obtained by directly dosing them onto the sample holder in order to get spectroscopic references. POM used for spectroscopic reference is produced directly onto sample holder by a thermally-induced formaldehyde polymerisation catalysed by ammonia (
Du-vernay et al. 2014;Schutte et al. 1993).
Radicals are produced from the VUV photolysis of formalde-hyde H2CO in a rare gas matrix. The VUV photons are generated from a microwave induced low pressure H2 plasma using a
mi-crowave magnetic applicator (Boreal Plasma) fed by a mimi-crowave generator (Opthos instruments). In a such low pressure H2plasma
(20 10−3mbar), the VUV emission is dominated by Lyman alpha
photons at 121.6 nm but molecular H2emission at 160 nm cannot
be excluded. The VUV flux is transmitted from the plasma chamber to the vacuum chamber through an MgF2window. The photon flux
has been measured using the O2→O3actinometry method (Cottin
et al. 2003) to c.a. 2.5 1013photons cm−2s−1, which is 1010times
larger than the UV secondary flux in dense molecular clouds. The sample are monitored using a Bruker Tensor 27 FTIR spectrometer with MCT detector between 4000 and 600 cm−1 in
reflection mode (reflection angle <5o) which can be considered
as double transmission technique since the infrared beam angle of incidence is closed to the normal. Each spectrum was aver-aged over 20 scans with a 0.5 cm−1 resolution, except for the
background averaged over one hundred scans with the same res-olution. The quantification of products observed in the solid film after rare gas desorption is based on infrared analysis. The column density N (molecule cm−2) can be determined by integrating
ei-ther the absorbance A(ν) or the optical depth τ(ν), according to the equations:N =
∫ τ(ν) 2cos(5)F=
ln(10) ∫ A(ν)
2cos(5)F , where F is the band strength (cm molecule−1) and ln(10) is needed to convert the
in-tegrated absorbance to optical depth. The column density of GA is obtained from the IR band at 1746 cm−1(F = 2.6 ×10⁻¹⁷cm
molecule−1), the amount of EG is obtained from the IR band at 1089
cm−1with a strength F = 3.9 × 10⁻¹⁸cm molecule−1(Hudson et al.
2005), and the amount of POM is obtained from the IR band at 902
cm−1with a strength F = 5 × 10⁻¹⁹cm molecule−1(Schutte et al.
1993). It has to be noted that the values of the band strengths depend on the nature, composition, and temperature of the ice in which they are found, and this dependence is a major source of uncertainties when evaluating the column densities of frozen molecules.
All the experiments described below were done in three steps : (i) Radical formation from VUV photolysis of radical precur-sor formaldehyde; (ii) Rare gas matrices annealing; (iii) Rare gas desorption at 35 K for argon and 85 K for xenon. After rare gas desorption, a ramp of 4 K min−1 is applied while the ion
cur-rent is recorded from RGA quadrupole mass spectrometer (MKS Microvision-IP plus) to obtain a full temperature programmed des-orption (TPD) profile, relative to various products. The ionisation source was a 70 eV impact electronic source and the mass spectra were recorded between 1 and 100 amu in a full scan.
2.2 Computational details
Density Functional Theory (DFT) and coupled-cluster calculations were performed using the Turbomole V7.2 package. The struc-tures of the reactants, transition states and products were fully optimised using the Becke’s three-parameter hybrid functional (B3LYP) (Becke 1993) in an unrestricted formalism, along with the dev2-TZVP basis set (Weigend & Ahlrichs 2005). These struc-tures were caracterised by vibrational harmonic frequencies and zero-point energies (ZPE) calculated at the same level of theory using the aoforce module (Deglmann et al. 2004).
For all stationary points, single-point calculations were carried out at the explicitly correlated Unrestricted Coupled Cluster Single and Double with inclusion of a perturbative estimation for triple excitations (UCCSD(T)-F12) (Tew & Klopper 2010) level along with the cc-pVTZ basis set (Dunning 1989). Explicitly correlated (F12) methods allow rapid orbital convergence and can lead to near basis set limit accuracy using small basis sets, with a small extra computational cost compared to conventional methods (Hättig et al. 2012). They are very useful for benchmarking, especially in the field of thermochemistry, and have proven to be highly accurate for astrochemically relevant systems (Stein et al. 2015).
3 RESULTS AND DISCUSSION
3.1 Experimental results
3.1.1 Formaldehyde photolysis atλ>120 nm : radicals formation
in argon and xenon matrices
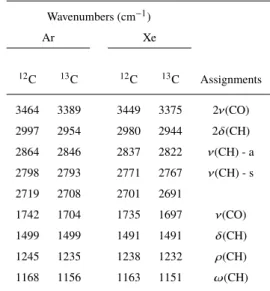
A gaseous mixture of formaldehyde and argon in a 2/1000 ratio is deposited on a cold surface (13 K in our case) at low pressure (10−8 mbar) with a controlled flow rate. In Ar matrix, the main
bands of H2CO are observed at 2864, 2798, 1742 and 1499 cm−1
(negative bands in Fig.1, Table1). These absorptions correspond to asymmetric and symmetric CH stretching mode, C=O stretching mode and CH bending mode respectively and are down-shifted with 12C to 13C isotopic change (Milligan & Jacox 1969). The
corresponding values in Xe matrix are listed in Table1. We assume that formaldehyde is trapped as monomer inside the matrix since the infrared signatures of formaldehyde dimer are not detected after the deposition (Nelander 1980). In this work, we tried to figure out the reactivity of formyl radical HCO when the main reactivity partner is formaldehyde H2CO. To make it possible, we performed
an VUV irradiation (λ>120 nm) at low fluence (2.7 1018photons
cm−2corresponding to 30 min of irradiation) of H
2CO trapped in
Table 1.Infrared absorption bands and assignments of H2CO in Ar and Xe
matrices at 13 K. Wavenumbers (cm−1) Ar Xe 12C 13C 12C 13C Assignments 3464 3389 3449 3375 2ν(CO) 2997 2954 2980 2944 2δ(CH) 2864 2846 2837 2822 ν(CH) - a 2798 2793 2771 2767 ν(CH) - s 2719 2708 2701 2691 1742 1704 1735 1697 ν(CO) 1499 1499 1491 1491 δ(CH) 1245 1235 1238 1232 ρ(CH) 1168 1156 1163 1151 ω(CH)
ν: stretching; δ: bending; ρ: rocking; ω: wagging.
3 5 0 0 3 0 0 0 2 5 0 0 2 0 0 0 1 5 0 0 1 0 0 0 - 1 , 0 x 1 0- 1 - 5 , 0 x 1 0- 2 0 , 0 5 , 0 x 1 0- 2 H 2C O H 2C O H 2C O H C O A b s o rb a n c e W a v e n u m b e r ( c m - 1) H C O C O * H C O H 2C O H2O
Figure 1.Difference infrared spectrum after VUV photolysis (30 min, λ>120
nm) at 12 K in Ar matrix. Negative bands stand for H2CO, while positive
bands stand for photo-products. Bands labeled with stars refer to unknown species.
rare gas matrices. This way, only 7% of formaldehyde is consumed and photo-products are then produced.
Figure1displays the difference spectrum showing the effects of VUV irradiation in Ar matrix. The negative bands in Fig. 1
are due to the consumed formaldehyde and the positive bands to the newly formed products. Table 2displays IR assignments of products observed after12C and 13C formaldehyde photolysis in both Ar and Xe matrices. HCO radical is clearly identified in12C
experiments by the bands in Ar matrix at 2482 cm−1, 1863 cm−1
and 1085 cm−1, corresponding to its CH stretching, C=O stretching
and CHO bending vibrational modes respectively (Milligan & Jacox 1969) (Table2, Fig.1). The corresponding value in Xe matrix and for13C experiments are listed in Table2. CO and CO2 are also
visible and characterised by their bands in Ar matrix at 2138 cm−1
and 2345 cm−1 respectively, corresponding to the CO stretching
mode (Abe et al. 1999;Schriver et al. 2000). Finally, a band at
Table 2.Infrared absorption bands and assignments of produced species after12C and13C formaldehyde photolysis (λ>120 nm, 30 min) at 12 K in
Ar and Xe matrices. Wavenumbers (cm−1) Ar Xe 12C 13C 12C 13C Modes Species 2482 2476 2442 2436 ν(CH) HCO 2345 2279 2334 2269 ν(CO) CO2 2138 2091 2133 2086 ν(CO) CO 1863 1823 1857 1817 ν(CO) HCO 1624 1624 δ(OH) H2O 1346 1346 ? ? 1085 1078 1082 1076 δ(CHO) HCO 953 953 ν(XeH) as Xe2H+ 903 903 ν(ArH) as Ar2H+ 843 843 ν(XeH) as Xe2H+ 731 731 ν(XeH) as Xe2H+
ν: stretching; δ: bending; ρ: rocking; ω: wagging; τ: twisting.
903 cm−1 is detected after photolysis in Ar matrix. Its intensity
increases with the irradiation duration, proving that it is a product from VUV photolysis. According toKunttu et al.(1992), this band can be assigned to Ar2H+since small hydrides are known to form
ionic complexes in rare gas matrices (Pettersson et al. 2000). When photolysis is performed in Xe matrix three bands are observed at 952, 842, and 730 cm−1assigned to Xe
2H+(Pettersson et al. 2000).
Thus, the main radical species formed in both Ar and Xe matrices at
low fluence in a H2CO-dominated environment is the formyl radical
( HCO).
3.1.2 Matrix annealing : in situ hydrogenation reactions
The second step of our experiment is an annealing step, in which we heat at 30 K (50 K in Xe matrix) during 10 min without desorbing the matrix and then cool down the system back to 13 K. This way, all H-atoms - formed during the formaldehyde photolysis - will diffuse through the matrix and will react whenever a partner is met. New species coming from hydrogenation reactions within the rare gas matrices are then detected on the infrared spectrum. This technique has been already successfully used in our previous work to form the hydroxymethyl radical CH2OH from in situ hydrogenation reactions of formaldehyde (Butscher et al. 2015,2016). During the annealing small molecules or small radicals may also be able to exit from their matrix cage but because of the high dilution used in our experiments they will enter in a matrix cage that is most likely empty. In these particular conditions radical-radical recombination are unlikely and only products coming from reaction with H-atoms, the most diffusive species, are expected.
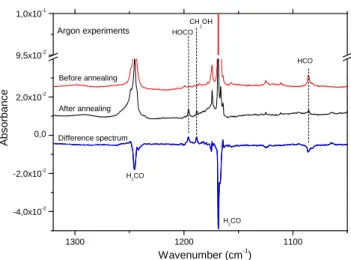
Annealing the irradiated sample results in noticeable changes in the difference IR spectrum (Fig.2). The study is focused on the 1400-1000 cm−1zone of the difference spectrum, known as the
fin-gerprint zone, to make the assignment easier. New products formed from in situ hydrogenation reactions are shown as positive bands
1 3 0 0 1 2 0 0 1 1 0 0 - 4 , 0 x 1 0- 2 - 2 , 0 x 1 0- 2 0 , 0 2 , 0 x 1 0- 2 9 , 5 x 1 0- 2 1 , 0 x 1 0- 1 B e f o r e a n n e a l i n g C H 2O H H2C O A b s o rb a n c e W a v e n u m b e r ( c m - 1) H2C O H O C O H C O A f t e r a n n e a l i n g D i f f e r e n c e s p e c t r u m A r g o n e x p e r i m e n t s
Figure 2.Infrared difference spectrum showing the effect of annealing at
30 K after the VUV photolysis (λ>120 nm, 30 min) of formaldehyde in Ar matrix. Positive bands relates to formed species and negatives bands to consumed species
on the difference spectrum in Figure2, whereas negative bands re-late to consumed species. Infrared frequencies and assignments of present species after annealing step are listed on Table3along with their evolutions during the annealing. This annealing step makes the Ar2H+ band at 903 cm−1 disappears (the same is true with
Xe2H+in Xe matrix experiments), proving that all H-atoms reacted
(Butscher et al. 2015;Pettersson et al. 2000). Due to the low fluence
used in our experiments, only a low amount of free H-atoms were produced. However, CO is still partially consumed to form HCO by hydrogenation reactions since CO band at 2138 cm−1decreases
during the annealing (Table3). This radical will also be partially hydrogenated to form formaldehyde H2CO. However, as seen in
Fig.2, the HCO radical is still present after the annealing in the matrix.
A new radical species appears by the hydrogenation of formaldehyde H2CO. Hydroxymethyl radical CH2OH is detected
in Ar matrix from its bands at 1358, 1183 , and 1048 cm−1
corre-sponding to its HOC bending mode, CH bending mode, and HCOH bending mode respectively. These assignments are in good agree-ment with previous works and are confirmed in 13C and xenon experiments (Butscher et al. 2015;Jacox & Milligan 1973) (Table.
3. A band at 1188 cm−1is also detected. It is assigned to the CH
bending mode of CH2OH:CO molecular complex (Butscher et al. 2015). As only a few free H-atoms were formed, only a small amount of CH2OH is produced whereas methanol CH3OH-the fully
sat-urated molecule in the CO hydrogenation chain- is not detected. Another radical is also detected HOCO from its bands located at 1843 cm−1in Ar matrix(Jacox 1988;Ryazantsev & Feldman 2014).
A small band at 1195 cm−1(Fig.2) is tentatively assigned to the
HOC bending mode of HOCO:CO molecular complex (Jacox 1988;
Ryazantsev & Feldman 2014). At this stage, the present molecules
are H2CO, HCO, CO, CO2, CH2OH, and HOCO.
3.1.3 Radical induced polymerisation : reactivity with an
unsaturated molecule
The last step of our experiments is the rare gas desorption. The rare gas matrices are quickly heated at 35 K for Ar and 85 K for Xe, making the matrix cages disappear forming an amorphous solid film
Table 3.Infrared absorption bands and assignments of present species after annealing step (heating to 30 K in Ar matrix and 55 K in Xe matrix and cooling down back to 12 K).
Wavenumbers (cm−1)
Ar Xe
12C 13C 12C 13C Modes Species Bands
evolution∗ 2482 2476 2442 2431 ν(CH) HCO Ø 2345 2279 2334 2269 ν(CO) CO2 Ú 2138 2091 2133 2086 ν(CO) CO Ø 1863 1823 1857 1817 ν(CO) HCO Ø 1843 - - - ν(CO) HOCO Ú 1358 1355 1355 1350 δ(HOC) CH2OH Ú 1195 - - - δ(HOC) HOCO:CO Ú 1188 - - - δ(CH) CH2OH:CO Ú 1183 1176 1176 1162 δ(CH) CH2OH Ú 1085 1078 1082 1076 δ(CHO) HCO Ø 1048 - 1044 1040 δ(CHOH) CH2OH Ú
ν: stretching; δ: bending.∗: Infrared bands evolution during the annealing
at 30 K. 3 5 0 0 3 0 0 0 2 5 0 0 2 0 0 0 1 5 0 0 1 0 0 0 0 , 0 5 0 , 1 0 0 , 1 5 0 , 2 2 0 , 2 3 * * * * * * * 2 0 0 K 1 5 0 K 1 0 0 K A b s o rb a n c e ( a rb it ry u n it s ) W a v e n u m b e r ( c m - 1) 5 0 K * νO H r e g i o n νC - O r e g i o n A r g o n e x p e r i m e n t s
Figure 3.Infrared spectrum of the solid film obtained after argon desorption
(35 K) from the sample recorded during the warming from 50 to 200 K (4 K min−1). Bands labeled with stars are due to formaldehyde.
in which freed radicals will then react with other partners from rad-ical/radical and radical/non-radical reactions, forming new species. Figure3(top spectrum) displays the solid film infrared spectrum recorded after Ar desorption at 50 K. As expected, it is dominated by H2CO signatures but new infrared contributions are also visible
at 3238 cm−1in the OH stretching region and at 1116, 941, and 905
cm−1in the C-O stretching region. (Fig.3, top spectrum). The solid
obtained after Ar desorption at 50 K is warmed at a rate of 4 K min−1. The infrared spectra recorded at specific temperatures (100,
150, and 200 K) are displayed in Figure3. Between 50 and 100 K, the most striking differences are the increase of bands located at 1116, 941, and 905 cm−1in the CO stretching region and the
refine-ment of infrared absorption bands of formaldehyde mainly due to
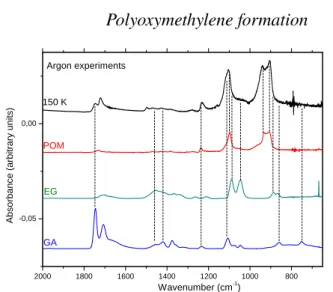
2 0 0 0 1 8 0 0 1 6 0 0 1 4 0 0 1 2 0 0 1 0 0 0 8 0 0 - 0 , 0 5 0 , 0 0 W a v e n u m b e r ( c m - 1) 1 5 0 K P O M E G G A A r g o n e x p e r i m e n t s A b s o rb a n c e ( a rb it ra ry u n it s )
Figure 4.Infrared spectrum of the solid film recorded at 150 K after Ar
desorption from the sample at 35 K. It is compared to reference spectra of polyoxymethylene, ethylene glycol, and glycolaldehyde
3 5 0 0 3 0 0 0 2 5 0 0 2 0 0 0 1 5 0 0 1 0 0 0 0 , 0 0 0 , 0 2 0 , 0 4 0 , 0 6 0 , 1 0 0 , 1 5 * * * * * * * * A b s o rb a n c e ( a rb it ra ry u n it s ) W a v e n u m b e r ( c m - 1) 8 5 K 1 0 0 K 1 5 0 K 2 0 0 K * νC - O r e g i o n νO H X e n o n E x p e r i m e n t s
Figure 5.Infrared spectrum of the solid film obtained after xenon desorption
(85 K) from the sample recorded during the warming from 85 to 200 K (4 K min−1). Bands labeled with stars are due to formaldehyde.
crystallisation of the solid film. At 150 K, the bands of formaldehyde are not present due to its desorption from the sample holder (Fig.3). In order to determine the new-formed species, attributions are made on the 2000-700 cm−1area that is a more characteristic region for
identification. In this figure, the IR spectrum recorded at 150 K af-ter formaldehyde desorption is compared with reference spectra of polyoxymethylene (POM), ethylene glycol (EG, HOCH2CH2OH),
and glycolaldehyde (GA, C(O)HCH2OH) (Fig4). As seen on
Fig-ure4(top spectrum), the bands at 1116, 941, and 905 cm−1 can
easily be identified as C-O stretching modes of formaldehyde poly-mer polyoxymethylene (POM) (Schutte et al. 1993;Duvernay et al. 2014). Apparently, the low amount of radicals ( HCO, CH2OH, etc) is sufficient to initiate chain-propagating H2CO polymerization
reactions right after the rare gas sublimation but also during the warming. Finally the bands of POM start to decrease around 180 K and totally disappear after 250 K (Fig.3). This is due to POM sub-limation and thermal decomposition into formaldehyde (Duvernay
et al. 2014).
Glycolaldehyde (GA, C(O)HCH2OH) and ethylene glycol
(EG, HOCH2CH2OH) are also detected in this experiment.
2 0 0 0 1 5 0 0 1 0 0 0 0 , 0 0 0 0 , 0 0 3 0 , 0 0 6 0 , 0 0 9 0 , 0 1 2 0 , 0 1 5 0 , 0 1 8 A b s o rb a n c e ( a rb it ra ry u n it s ) W a v e n u m b e r ( c m - 1 ) 1 5 0 K G A E G P O M X e n o n e x p e r i m e n t s
Figure 6.Infrared spectrum of the solid film recorded at 150 K after Xenon
desorption from the sample at 85 K. It is compared to reference spectra of polyoxymethylene, ethylene glycol, and glycolaldehyde. See experimental part for details.
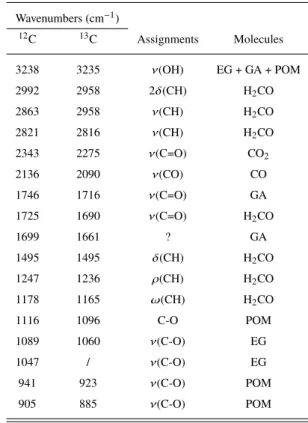
Table 4.Infrared absorption bands and assignments of present species in
the solid film at 50 K. Wavenumbers (cm−1) 12C 13C Assignments Molecules 3238 3235 ν(OH) EG + GA + POM 2992 2958 2δ(CH) H2CO 2863 2958 ν(CH) H2CO 2821 2816 ν(CH) H2CO 2343 2275 ν(C=O) CO2 2136 2090 ν(CO) CO 1746 1716 ν(C=O) GA 1725 1690 ν(C=O) H2CO 1699 1661 ? GA 1495 1495 δ(CH) H2CO 1247 1236 ρ(CH) H2CO 1178 1165 ω(CH) H2CO 1116 1096 C-O POM 1089 1060 ν(C-O) EG 1047 / ν(C-O) EG 941 923 ν(C-O) POM 905 885 ν(C-O) POM
ν: stretching; δ: bending; ρ: rocking; ω: wagging.
portantly, theses species were not detected in rare gas matrix before rare gas sublimation indicating that COMs observed in the solid films come from radical reactivity during the rare gas sublimation. The GA C=O stretching mode at 1746 cm−1is clearly visible. Two
bands at 1089 and 1047 cm−1hint that EG is also present in the
short-irradiation experiment. Nevertheless, it is also interesting to note that glyceraldehyde (GCA) and glycerol (GCO) have simi-lar frequencies and they could also contribute to these bands. All
Table 5.GA, EG, and POM column densities (mol cm−2) observed in solid
films after VUV photolysis and rare gas desorption. Ar experiments GA EG POM 50 K 2± 0.2×10¹⁵ 4± 0.3×10¹⁵ 4± 0.2×10¹⁵ 150 K 2± 0.2×10¹⁵ 4± 0.3×10¹⁵ 13± 0.2×10¹⁵ Xe experiments GA EG POM 85 K 1± 0.3×10¹⁵ 20± 0.1×10¹⁵ 3± 0.4×10¹⁵ 150 K 1± 0.3×10¹⁵ 20± 0.1×10¹⁵ 4± 0.2×10¹⁵
frequencies and attributions are listed on Table4. As previously suspected, infrared absorptions of methanol are not visible on the spectra of this experiment. It is a direct consequence of the limited production of H-atoms from the photolysis of formaldehyde H2CO.
We calculated the column densities of GA, EG, and POM (Ta-ble 5). At 50 K (ie after the Ar sublimation) EG and POM are the dominant products with a column densities of 4±0.3 1015mol cm−2each whereas the column densities of GA is 2±0.2 1015mol
cm−2. At 150 K as seen in Fig.4, POM is efficiently formed and
becomes the main product whereas there is no evolution on GA and EG column densities during the warming. This indicates that GA and EG are mainly formed during Ar sublimation when cage opening released HCO and CH2OH radicals that quickly react forming GA and EG (Butscher et al. 2015;Fedoseev et al. 2015;
Chuang et al. 2015, 2017;Fedoseev et al. 2017). After the rare
gas sublimation is complete, remaining radicals in low amount (be-low the detection limit) are isolated in a formaldehyde-dominated environment inhibiting radical-radical recombination but allowing chain-propagating H2CO polymerisation reactions as the tempera-ture is increased.
This is confirmed with xenon experiments that allow matrix cage sublimation at higher temperature than in argon. Figure5 dis-plays the solid film infrared spectrum recorded after Xe desorption at 85 K. The same products as previously are detected but now EG is the most abundant product (see Table5). During the warming from 85 K to 150 K no evolution is observed on GA and EG col-umn densities and only a small variation of POM (Fig.6and Table
5). Since the xenon desorption occurs at higher temperature than in Ar, radical-radical recombination is more efficient due to higher radical mobilities. The dramatic consumption of radical initiators -especially CH2OH- inhibits formaldehyde polymerisation in the solid film explaining the small POM formation during the warm-ing. This may also indicate that CH2OH radical is a more important radical in chain-propagating H2CO polymerization reactions than
HCO radical. This point will be clarified in the theoretical part. Attributions were also confirmed using Temperature Pro-grammed Desorption (TPD) experiment with a quadrupole mass spectrometer. The objective of such an experiment is to identify the desorbing molecules by mass spectrometry. Indeed, desorption temperature and fragmentation pattern are inherent to a molecular structure. Figure7shows the TPD graph from 125 K to 300 K, after the formaldehyde desorption. At least seven desorption peaks are observed during the TPD experiments indicating that more than the three previously assigned products have been formed in the experiments (Fig.7).
The first desorption peaks at 160 K can be assigned to GA from signal at m/z 60 and m/z 43. (Fedoseev et al. 2017). EG is also
1 4 0 1 6 0 1 8 0 2 0 0 2 2 0 2 4 0 2 6 0 0 , 0 2 , 0 x 1 0- 1 1 4 , 0 x 1 0- 1 1 6 , 0 x 1 0- 1 1 8 , 0 x 1 0- 1 1 1 , 0 x 1 0- 1 0 1 , 2 x 1 0- 1 0 1 , 4 x 1 0- 1 0 1 , 6 x 1 0- 1 0 1 , 8 x 1 0- 1 0 2 , 0 x 1 0- 1 0 2 , 2 x 1 0- 1 0 2 , 4 x 1 0- 1 0 m / z 6 2 x 2 . 5 m / z 6 0 m / z 4 3 m / z 6 1 Q M S s ig n a l T e m p e r a t u r e ( K ) G A E G , G A , P O M , G C A P O M G C O m / z 4 7 E G G A E G P O M G C A ? ? P O M
Figure 7. Temperature Programmed Desorption (TPD) spectra of the
solid film formed after rare gas desorption step of the photolysis at 12 K (λ>120 nm, 30 min) of H2CO/Ar = 2/1000 matrix. m/z
43: CHOCH+
2; m/z 47: HOCH2O+; m/z 60: HOCH2CHO+; m/z 61:
HOCH2CH2O+/HOCH2OCH+2; m/z 62: HOCH2CH2OH+. GA: m/z 61,
43; EG: m/z 62, 61, 43; POM: m/z 61, 47, 43; GCA: m/z 61, 43; GCO: m/z 61 43. GCA and GCO detections are only tentative.
easily assigned from its characteristic desorption around 210 K for
m/z62. These two products were previously detected using infrared
spectroscopy. The third product detected by infrared spectroscopy POM is also confirmed by the QMS analysis from its characteristic fragments at m/z 47, 43, and 61 (Duvernay et al. 2014). It has to be noted that m/z 47 is only due to POM fragmentation whereas
m/z43 and 61 are also common fragments to other molecules such
as GA, EG. This explain why the evolution of m/z 47 is different from the one observed for m/z 43 and 61. In13C experiment, m/z
43 becomes m/z 45 and m/z 47 becomes m/z 49. These matches different fragments of polyoxymethylene (POM). This is shown in Figure 8 that displays different fragmentation patterns for poly-oxymethylene (POM) according to terminal groups. For example the fragment at m/z 43 indicates that the polymerisation process has been initiated/terminated by HCO radical while the fragment at
m/z47 indicates CH2OH radical was the initiator/terminator. Also,
an interesting point is their desorption temperature ranging from 180 K to 250 K (m/z 47). It depends on the length of the polymer and increases when the polymer grows (Duvernay et al. 2014). Two small peaks at 165 K and 180 K on the signal m/z 61 are coming from the desorption on unknown products.
The desorption peak starting at around 185 K for m/z 43 cannot be explained by the desorption of POM only. We also observe in this temperature range co-desorption with GA at 200 K (m/z 60) and EG at 210 K (m/z 62). These two species contribute to the
m/z43 signal observed between 180 K and 220 K since POM, GA,
and EG share this mass fragement. Co-desorption of glyceraldehyde (HOCH2CH(OH)CHO) as reported byFedoseev et al.(2017) cannot also be excluded since the desorption temperature for this compound is observed at 215 K and the m/z 43 and 61 are the most intensive peaks (Fedoseev et al. 2017). Thus, the co-desorption observed between 180 K and 220 K can be explained by the fact that GA, EG, and other COMs have been trapped in POM and are driven away from the sample holder during the POM desorption.
Finally, the last desorption peak is observed around 235 K for
m/z61, m/z 47, and m/z 43. The presence of m/z 47 indicates POM
desorption but again other contribution cannot be excluded.
Com-Figure 8.Polyoxymethylene fragmentation pattern according to end-groups.
plex molecules such as glycerol (GCO, HOCH2CH(OH)CH2OH) may also contribute to the desorption peak observed at 235 K (
Fe-doseev et al. 2017) for m/z 61. The difficulty of mass assignments
comes from the fact that EG, POM but also GCA, and GCO all share the same characteristic fragments m/z 43 and 61. The sus-pected formation of both GCA and GCO can be explained by the mechanism prosposed by Fedoseev et al. (2017). Both GA and EG -two products observed in our experiments- can participate in H-induced reactions, producing two carbon bearing radical interme-diates HOCH2CHOH. This later, in turn, can react in a barrierless radical-radical recombination with HCO or CH2OH radicals re-sulting in the formation of GCA and GCO respectively (Fedoseev
et al. 2017). In a such mechanism, sugar formation (e.g. GCA and
GCO) are competitive reactions with formaldehyde polymerisation (e.g. POM formation). However, more experiments are needed to confirm the GCA and GCO formation in our experiments.
Thus, after radical recombination, detected products are poly-oxymethylene (POM), glycolaldehyde (GA), ethylene glycol (EG) and possibly glyceraldehyde (GCA) and glycerol (GCO).
3.2 Theoretical results
In this section, we aim at providing a possible formation mechanism of POM, using state-of-the-art quantum calculations. We considered the two following polymerisation reactions :
HCO H2CO
−−−−→ HC(O)CH2O −−−−→H2CO HC(O)CH2OCH2O −−−−→H2CO . . .(1) CH2OH −−−−→H2CO HOCH2CH2O −−−−→H2CO HOCH2CH2OCH2O −−−−→H2CO . . .(2)
For both reactions (1) and (2), the initiation step can a priori proceed via the two addition reactions : either a C−C bond (steps (3) and (5)) or a C−O bond (steps (4) and (6)) is formed.
H O
.
+ H H O −→ H C H2 O O.
(3) H O.
+ H H O −→ H O O CH2 (4)O + H H O −→ O C H2 O (5) O + H H O −→ O O CH2 (6)
3.2.1 Initiation steps for the HCO/ CH2OH+H2CO
polymerisation
The results for the initiation steps (3), (4), (5) and (6) at the UCCSD(T)-F12 level are shown onFigure 9, where the reaction path for reaction (1) appears on the right-hand side of the figure and the one for reaction (2) appears on the left-hand side. For both reactions, the C−O bond formation appears to be much less favoured than the C−C bond formation, with barriers as high as ' 60 kJ.mol−1for
the former and up to ' 30 kJ.mol−1for the latter. Interestingly, the
formyloxymethyl radical HC(O)OCH2is thermodynamically more stable than the formylmethoxy radical HC(O)CH2O (the same is true although less pronounced for the CH2OH counterpart). Under the current experimental conditions (@ 35 K) however, the "C-O" products are unlikely to be formed. Thus, only the initiation step (3) and (5) for reactions (1) and (2) respectively will be considered in the following. For this step, reaction (2) is more likely to happen than reaction (1) at low temperatures, with a barrier of ' 12 kJ.mol−1for
the former and ' 30 kJ.mol−1for the latter. However, it is difficult
to estimate if a barrier of ' 12 kJ.mol−1is low enough under the
experimental conditions (@ 35 K) so that the polymerisation reac-tion can be initiated. A comparison at the same level of calculareac-tion with the hydrogenation reaction of CO, known to occur at temper-atures as low as 3 K (Pirim & Krim 2011) will be informative with regard to this question and will be discussed in section3.2.3. Even if we were to assume that the initiation step was possible, one has to check if the next formaldehyde additions proceed through lower energy barriers than the first one, that is if the initiation step is the rate-determining step for the formaldehyde polymerisation reaction. A careful inspection of the propagation steps for both reactions (1) and (2) will help providing an answer.
3.2.2 Propagation steps for the HCO/ CH2OH+H2CO
polymerisation
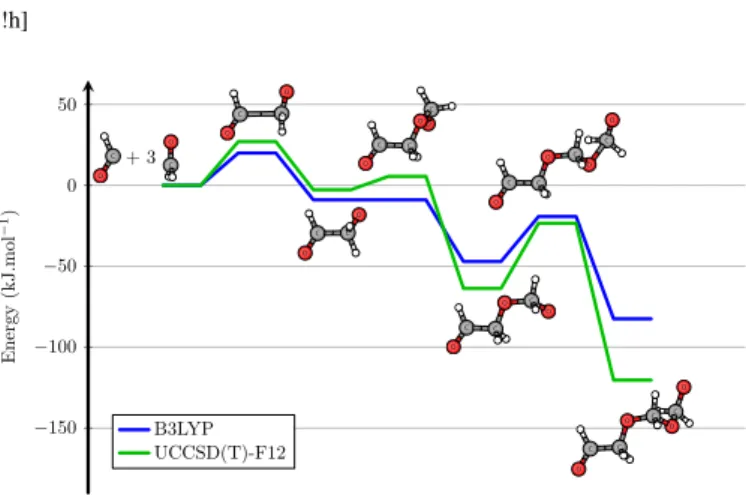
We calculated the reaction paths for the next two propagation steps of reactions (1) and (2). The reaction paths at both B3LYP and UCCSD(T)-F12 levels of theory are shown for each reaction in
Fig-ure 10andFigure 11, respectively, and the corresponding energy
values are reported in table6. For each path, the reference energy corresponds to the sum of energies of the HCO (resp. CH2OH) radical and of n H2CO moieties (n ∈ [1 − 3]) calculated separately, corrected by the ZPE at the B3LYP level. Each step of the reac-tion paths corresponds to the addireac-tion of a formaldehyde molecule. Among the possible conformers of the products, only the most stable one was kept for the reaction path.
As can be seen onFigure 10andFigure 11, both DFT and cou-pled cluster calculations show the two following important results : (a) the polymerisation of formaldehyde initiated by both HCO and CH2OH radicals is thermodynamically favourable and (b) the energy barriers of the propagation steps all lie lower (or nearly) than
−100 −50 0 50 100 C O +C O C O O C O C C O O O C C O C O C O C + C O C O O C O O C C O C C O O C C O .CH 2OH + H2CO .HCO + H2CO Energy (kJ.mol − 1)
C−O : UCCSD(T)-F12/B3LYP with ZPE C−C UCCSD(T)-F12/B3LYP with ZPE
Figure 9.Left: CH2OH + H2CO reaction paths for the C−C bond formation
(green) and C−O bond formation (yellow) in the initiation steps (5) and (6). Right: HCO + H2CO reaction paths for the C−C bond formation (green) and
C−O bond formation (yellow) in the initiation steps (3) and (4) respectively (See text). [!h] −150 −100 −50 0 50 C O + 3 C O O O C C O C O C O C C O C O O O C C O C C O O C O C O C C O O O C O C C Energy (kJ.mol − 1) B3LYP UCCSD(T)-F12
Figure 10.Reaction path of the initiation step (C-C bond formation) and the
first two propagation steps for reaction (1) (See text). [!h] −200 −150 −100 −50 0 50 O C + 3 C O O C C O O C C O C C O O C O C C O O O C C C C O O O O C C O C O C O O C Energy (kJ.mol − 1) B3LYP UCCSD(T)-F12
Figure 11.Reaction path of the initiation step (C-C bond formation) and the
first two propagation steps for reaction (2) (See text).
[!h]
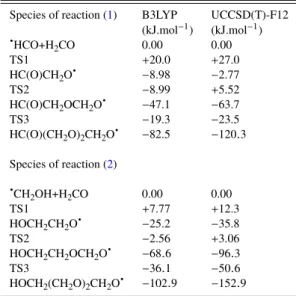
Table 6.B3LYP and UCCSD(T)-F12 energies (ZPE corrected, in kJ.mol−1)
of reactants, transition states and products of the first three steps of poly-merisation reactions of formaldehyde from HCO and CH2OH radicals.
Species of reaction (1) B3LYP UCCSD(T)-F12 (kJ.mol−1) (kJ.mol−1) HCO+H2CO 0.00 0.00 TS1 +20.0 +27.0 HC(O)CH2O −8.98 −2.77 TS2 −8.99 +5.52 HC(O)CH2OCH2O −47.1 −63.7 TS3 −19.3 −23.5 HC(O)(CH2O)2CH2O −82.5 −120.3 Species of reaction (2) CH2OH+H2CO 0.00 0.00 TS1 +7.77 +12.3 HOCH2CH2O −25.2 −35.8 TS2 −2.56 +3.06 HOCH2CH2OCH2O −68.6 −96.3 TS3 −36.1 −50.6 HOCH2(CH2O)2CH2O −102.9 −152.9
the initial energy of the reactants, showing that the rate-determining step for the polymerisation is namely the initiation step. If the first barrier can be overcome, the polymerisation reaction would proceed and would be driven by the formation of even more thermodynami-cally stable species, which is consistent with the detection of POM in our experiments. Before focusing on the rate-determining step, it is interesting to analyse the differences between the DFT and cou-pled cluster results on one hand and on the differences between both reaction paths on the other hand, from the values ofTable 6.
For both reactions, the DFT method underestimates energy barriers as well as exothermicities compared to the coupled cluster ones. The only exception regarding exothermicities appears for the formylmethoxy radical HC(O)CH2O , which is found to be about
6 kJ.mol−1less stable and almost isoenergetic with the reactants
at the coupled cluster level. Apart from this case, the differences between DFT and coupled cluster values are particularly well pro-nounced for the second propagation step with a difference in the energy barrier up to 14 kJ.mol−1and in the exothermicity up to
22 kJ.mol−1for reaction (2). At the UCCSD(T)-F12 level, the
en-ergy release of each propagation step remains more or less constant (' 60 kJ.mol−1), and this for each reaction, whereas they range
from 35 to 43 kJ.mol−1at the DFT level.
Regarding the differences between the two reaction paths, both methods predict more stable products in reaction (2) than in reac-tion (1) : a plausible explanation is the possibility of an hydrogen bond between the O−H group brought by the hydroxymethyl radical and the oxygen of formaldehyde, which stabilises the newly formed radical and is absent in the case of the formyl radical. This is particu-larly obvious for the hydroxymethylmethoxy radical HOCH2CH2O which is stabilised by ' 36 kJ.mol−1with respect to its reactant,
whereas the formylmethoxy radical HC(O)CH2O is only stabilised by ' 3 kJ.mol−1. Another feature of both reaction paths is that the
first energy barrier is lower for reaction (2), indicating that this re-action could possibly be the dominant mechanism for the formation of POM.
[!h]
Table 7.B3LYP and UCCSD(T)-F12 energies (ZPE corrected, in kJ.mol−1)
of reactants, transition states and products of the hydrogenation reaction of CO B3LYP UCCSD(T)-F12 (kJ.mol−1) (kJ.mol−1) H+CO 0.00 0.00 TS 1.88 11.2 HCO -85.3 -56.5
3.2.3 Interpretation of the experimental results
The calculated reaction paths for both reactions (1) and (2) have shown that these reactions are good candidates to explain the poly-merisation of formaldehyde into POM, provided the first energy barrier can be overcome. Since the DFT method is known to under-estimate energy barriers, we will refer in the following discussion to the more reliable values obtained by the UCCSD(T)-F12 method. The lowest barrier was found to be 12.3 kJ.mol−1for the addition of
formaldehyde on the hydroxymethyl radical (See Table6). In order to estimate if this barrier can be overcome at 35 K, one can compare it to the barrier of the elementary reaction of hydrogenation of CO. Pirim and Krim (Pirim & Krim 2011) have recently shown that the reaction of non-energetic H-atoms with CO can occur to form formyl radicals at temperatures as low as 3 K. We calculated the en-ergy barrier for this reaction at DFT and UCCSD(T)-F12 levels and the results are reported inTable 7. As can be seen, if one would trust the DFT values, one would conclude that the small energy barrier of 1.88 kJ.mol−1and the high exothermicity are compatible with the
experimental observations. The UCCSD(T)-F12 energy barrier is however much higher (11.2 kJ.mol−1) and very close to the energy
barrier of reaction2. If one trusts the coupled cluster value, this gives an indication that such a ' 10 kJ.mol−1barrier is obviously
not contradictory with the fact that this reaction efficiently occurs at very low temperature. Hence, one can put forward the following hypotheses to explain the formation of POM :
(i) There is a possible "cage effect" of the desorbing Ar atoms that could artificially stabilise the first transition state and thus lower the reaction barrier. It seems however difficult to support experimentally this idea by probing the Ar matrix at its desorbing temperature in order to have an idea on the local environment of the reactants.
(ii) Tunneling effects are known to be important at very low temperature, mainly for light species. In the case of the hydro-genation of CO, the tunneling of H-atom certainly enhances the reactivity. In our case, tunneling effect would correspond to a C−C bond formation. The imaginary frequencies of the transition states, 263i cm−1 and 286i cm−1 for the initiation
steps of reactions (1) and (2), respectively, indicate that, in the framework of the simple standard Eckart model, the barriers are not thin enough for the tunneling to be important. However, important tunneling effects for heavy atoms are known to occur at very low temperature (Borden 2016;Meisner & Kästner 2016;
Goumans & Andersson 2010) and tunneling has recently been
recognised as the third reactivity paradigm (Schreiner 2017). It would certainly be interesting to investigate further the role of tunneling in the POM formation in the light of these recent findings. (iii) More likely, the energy release from the first step of reaction (2)
or from a fast radical-radical recombination reaction to form EG or GA could possibly be transferred to the reactants of reaction (1) and enable the barrier to be overcome.
Finally, the termination step can occur either with a recombi-nation with a HCO or CH2OH radical. This recombination step between two radicals is expected to proceed without any barrier and should thus be fast. The length of the POM chain would then depend on the amount of the remaining radicals as the Ar desorption is fully over. This is consistent with the mass spectra recorded between 150 and 230 K (Fig.7) that clearly shows chain-length distribution as well as both HCO and CH2OH end groups.
4 ASTROCHEMICAL IMPLICATIONS
The presence of polyoxymethylene in comets is an exciting story that started in 1986. During the Halley comet flyby by the Giotto mission, the PICCA instrument (Positive Ion Cluster Composition Analyser) recorded mass spectra displaying a periodic pattern with repeating units of m/z 16:14 consistent with an −O− and −CH2− addition/loss. At that time, this pattern was identified as being compatible with formaldehyde polymers, also referred to as poly-oxymethylene (POM) (Huebner 1987). Latter,Mitchell et al.(1989) showed that this regular pattern is generally characteristic of any kind of CHO-bearing molecules that include POM-like structures. Recently, a similar pattern was found by the Ptolemy instrument of the Rosetta mission (Wright et al. 2015) strengthening the POM detection in cometary nucleus. However, this is to be tempered since recent re-investigation of Ptolemy data and comparison with data from two others mass spectrometers on-board the Rosetta mission, COSAC and ROSINA suggest that the detection of polyoxymethy-lene by Ptolemy instrument cannot be confirmed (Altwegg et al. 2017). They calibrated the ROSINA flight spare instrument with commercially available polymer. POM was thermally desorbed in a vacuum chamber and then connected to ROSINA flight spare instru-ment. From the fragmentation pattern they observed, they concluded that thermal desorption of POM mostly produce monomer (m/z 28 30), and only very little dimer or longer chains and it does not pro-duce the observed periodic pattern with repeating units of m/z 16:14 as observed on Ptolemy instrument. In addition, the ROSINA re-sults obtained in laboratory are not compatible with the suggestion made byWright et al.(2015) that POM is responsible for high peak on m/z 91 and peaks between m/z 55 and 62. We would like to make comments on these results. It is well known that commercially avail-able POM thermally decompose at temperature higher than 40oC
into formaldehyde. Commercially available POMs mainly consist of long chain-length polymers that cannot sublimate easily. Instead, at temperature higher than 40oC, they start to depolymerise into
H2CO monomer (Duvernay et al. 2014;Le Roy et al. 2012).
How-ever, the mass spectra of formaldehyde oligomers (i.e. short chain-length POMs) are really different from the ones of commercially available POMs and present high similarities with data recorded by Ptolemy instrument supporting POM identification in cometary nu-clei made by both PICCA and Ptolemy instruments (Duvernay et al. 2014). Results from this study also bring some new elements that strengthen the likely formation of POM on cometary nuclei based on formaldehyde polymerisation initiated by radicals. The figure12
displays the mass spectra comparison between the POM desorbing from our sample holder at 260 K with some peaks extracted from the Ptolemy spectra (Wright et al. 2015). Those peaks at m/z 31, 43, 45, 47, 57, 59, 61, 73 have been proposed to be polyoxymethylene
(Wright et al. 2015) originating from the surface of the comet 67P.
3 0 3 5 4 0 4 5 5 0 5 5 6 0 6 5 7 0 7 5 0 , 0 5 , 0 x 1 0- 1 1 1 , 0 x 1 0- 1 0 1 , 5 x 1 0- 1 0 2 , 0 x 1 0- 1 0 2 , 5 x 1 0- 1 0 Q M S s ig n a l m / z P O M d e s o r p t i o n a t 2 6 0 K P e a k s e x t r a c t e d f r o m t h e P t o l e m y s p e c t r a 5 7 7 3 5 9 6 1 4 7 4 5 4 3 3 1
Figure 12.Mass spectrum of POM recorded at 260 K compared with
ex-tracted peaks from the Ptolemy spectra. m/z 44 is related to CO2
contami-nation.
These data fit well the mass spectra of volatile POM recorded at 260 K except three masses at m/z 57, 59, and 73. Mass spectra recorded by Ptolemy instrument do not reflect a single idealized compounds with its ends terminated by H-atoms. Rather they indicate a num-ber of different terminations with chain running as −CH2O−. For
instance, peaks at m/z 57, 59 and 73 on Ptolemy spectrum result POM fragmentation with (CO)CH3termination that is unlikely in our conditions since the only possible terminations are CHO or CH2OH. This may explain the absence of peaks at m/z 57, 59, and 73 on our sample. The question therefore remains whether POMs are an important component of comets and more laboratory/theoretical studies and space missions will be needed to close this passionate debate.
5 CONCLUSION
We report new laboratory experiments on the low-temperature solid state formation of formaldehyde polymer polyoxymethylene-through radical-induced reactivity from VUV photolysis of formaldehyde in Ar matrix. We show, based on experimental find-ing and quantum calculations, the ability of free radicals to react at low temperature with others on the double bonds of unsatu-rated molecules initiating COMs formation such as GA, EG, and formaldehyde polymerisation. This formation mechanism based on radical-induced reactivity is likely in interstellar ices or cometary grains and supports the presence of COMs and POM in cometary nuclei. In addition the fragmentation pattern we observe with mass spectroscopy for short chain-length POM polymers is consistent with the data collected by the Ptolemy instrument on-board the
Rosettamission.
ACKNOWLEDGEMENTS
The project leading to this publication has received funding from Excellence Initiative of Aix-Marseille University - A*MIDEX, a French "Investissements d’Avenir programme". This work was also supported by the PCMI (Physique et Chimie du Milieu Interstellaire) program and The CNES (Centre National d’Etudes spatiales). We
also thank G. Knizia for freely providing the renmol script for generating the molecular cartoons.
REFERENCES
Abe H., Takeo H., Yamada K. M., 1999, Chemical physics letters, 311, 153 Abou Mrad N., Duvernay F., Theulé P., Chiavassa T., Danger G., 2014,
Analytical chemistry, 86, 8391
Abou Mrad N., Duvernay F., Chiavassa T., Danger G., 2016, Monthly Notices of the Royal Astronomical Society, 458, 1234
Altwegg K., et al., 2017, Monthly Notices of the Royal Astronomical Society, 469, S130
Becke A., 1993, J. Chem. Phys, 98, 5648
Bennett C. J., Kaiser R. I., 2007, The Astrophysical Journal, 661, 899 Biver N., et al., 2014, Astronomy & Astrophysics, 566, L5
Borden W. T., 2016, Wiley Interdisciplinary Reviews: Computational Molecular Science, 6, 20
Butscher T., Duvernay F., Theule P., Danger G., Carissan Y., Hagebaum-Reignier D., Chiavassa T., 2015, Monthly Notices of the Royal Astro-nomical Society, 453, 1587
Butscher T., Duvernay F., Danger G., Chiavassa T., 2016, Astronomy & Astrophysics, 593, A60
Butscher T., Duvernay F., Rimola A., Segado-Centellas M., Chiavassa T., 2017, Physical Chemistry Chemical Physics, 19, 2857
Caro G. M., et al., 2002, Nature, 416, 403
Chuang K.-J., Fedoseev G., Ioppolo S., van Dishoeck E., Linnartz H., 2015, Monthly Notices of the Royal Astronomical Society, 455, 1702 Chuang K.-J., Fedoseev G., Qasim D., Ioppolo S., van Dishoeck E., Linnartz
H., 2017, Monthly Notices of the Royal Astronomical Society, 467, 2552 Cottin H., Fray N., 2008, Space Science Reviews, 138, 179
Cottin H., Moore M. H., Bénilan Y., 2003, The Astrophysical Journal, 590, 874
Crovisier J., Bockelée-Morvan D., Biver N., Colom P., Despois D., Lis D. C., 2004, Astronomy & Astrophysics, 418, L35
Danger G., Rimola A., Mrad N. A., Duvernay F., Roussin G., Theule P., Chiavassa T., 2014, Physical Chemistry Chemical Physics, 16, 3360 Deglmann P., May K., Furche F., Ahlrichs R., 2004, Chemical physics letters,
384, 103
Dunning T. H., 1989, The Journal of Chemical Physics, 90, 1007 Duvernay F., Danger G., Theulé P., Chiavassa T., Rimola A., 2014, The
Astrophysical Journal, 791, 75
Fedoseev G., Cuppen H., Ioppolo S., Lamberts T., Linnartz H., 2015, Monthly Notices of the Royal Astronomical Society, 448, 1288 Fedoseev G., Chuang K.-J., Ioppolo S., Qasim D., van Dishoeck E. F.,
Linnartz H., 2017, The Astrophysical Journal, 842, 52
Fray N., Bénilan Y., Biver N., Bockelée-Morvan D., Cottin H., Crovisier J., Gazeau M.-C., 2006, Icarus, 184, 239
Fuchs G., Cuppen H., Ioppolo S., Romanzin C., Bisschop S., Andersson S., van Dishoeck E., Linnartz H., 2009, Astronomy & Astrophysics, 505, 629
Goesmann F., et al., 2015, Science, 349, aab0689
Goumans T. P. M., Andersson S., 2010, Monthly Notices of the Royal Astronomical Society, 406, 2213
Hättig C., Klopper W., Köhn A., Tew D. P., 2012, Chemical Reviews, 112, 4
Henderson B. L., Gudipati M. S., 2015, The Astrophysical Journal, 800, 66 Hiraoka K., Yamashita A., Yachi Y., Aruga K., Sato T., Muto H., 1995, The
Astrophysical Journal, 443, 363
Hudson R. L., Moore M. H., Cook A. M., 2005, Advances in Space Research, 36, 184
Huebner W., 1987, Science, 237, 628
Jacox M. E., 1988, The Journal of chemical physics, 88, 4598
Jacox M. E., Milligan D. E., 1973, Journal of Molecular Spectroscopy, 47, 148
Kaiser R. I., Maity S., Jones B. M., 2015, Angewandte Chemie International Edition, 54, 195
Kunttu H., Seetula J., Räsänen M., Apkarian V., 1992, J. Chem. Phys., 96, 5630
Le Roy L., Briani G., Briois C., Cottin H., Fray N., Thirkell L., Poulet G., Hilchenbach M., 2012, Planetary and space science, 65, 83
Lee Y.-F., Chou W.-T., Johnson B. A., Tabor D. P., Sibert III E. L., Lee Y.-P., 2015, Journal of Molecular Spectroscopy, 310, 57
Meisner J., Kästner J., 2016, Angewandte Chemie International Edition, 55, 5400
Milligan D. E., Jacox M. E., 1969, J. Chem. Phys., 51, 277
Minissale M., Moudens A., Baouche S., Chaabouni H., Dulieu F., 2016, Monthly Notices of the Royal Astronomical Society, 458, 2953 Mitchell D., et al., 1989, Advances in Space Research, 9, 35 Nelander B., 1980, J. Chem. Phys., 73, 1026
Noble J., Theule P., Mispelaer F., Duvernay F., Danger G., Congiu E., Dulieu F., Chiavassa T., 2012, Astronomy & Astrophysics, 543, A5
Öberg K. I., Garrod R. T., Van Dishoeck E. F., Linnartz H., 2009, Astronomy & Astrophysics, 504, 891
Pettersson M., Khriachtchev L., Roozeman R.-J., Räsänen M., 2000, Chem-ical Physics Letters, 323, 506
Pirim C., Krim L., 2011, Phys. Chem. Chem. Phys., 13, 19454
Ryazantsev S. V., Feldman V. I., 2014, The Journal of Physical Chemistry A, 119, 2578
Schreiner P. R., 2017, Journal of the American Chemical Society, 139, 15276 Schriver A., Schriver-Mazzuoli L., Vigasin A. A., 2000, Vibrational
Spec-troscopy, 23, 83
Schutte W., Allamandola L., Sandford S., 1993, Icarus, 104, 118
Stein C., Weser O., Schröder B., Botschwina P., 2015, Molecular Physics, 113, 2169
Tew D. P., Klopper W., 2010, Molecular Physics, 108, 315
Vinogradoff V., Duvernay F., Danger G., Theulé P., Chiavassa T., 2011, Astronomy & Astrophysics, 530, A128
Watanabe N., Shiraki T., Kouchi A., 2003, The Astrophysical Journal Letters, 588, L121
Watanabe N., Nagaoka A., Shiraki T., Kouchi A., 2004, The Astrophysical Journal, 616, 638
Weigend F., Ahlrichs R., 2005, Physical Chemistry Chemical Physics, 7, 3297
Woods P. M., Slater B., Raza Z., Viti S., Brown W. A., Burke D. J., 2013, The Astrophysical Journal, 777, 90
Wright I., Sheridan S., Barber S., Morgan G., Andrews D., Morse A., 2015, Science, 349, aab0673