Science Arts & Métiers (SAM)
is an open access repository that collects the work of Arts et Métiers Institute of
Technology researchers and makes it freely available over the web where possible.
This is an author-deposited version published in:
https://sam.ensam.eu
Handle ID: .
http://hdl.handle.net/10985/18815
To cite this version :
S. TAMBOURA, M.A. LARIBI, J. FITOUSSI, M. SHIRINBAYAN, R. Tie BI, A. TCHARKHTCHI, H.
Ben DALI - Damage and fatigue life prediction of short fiber reinforced composites submitted to
variable temperature loading: Application to Sheet Molding Compound composites - International
Journal of Fatigue - Vol. 138, p.1-8 - 2020
Any correspondence concerning this service should be sent to the repository
Administrator :
[email protected]
Damage and fatigue life prediction of short
fiber reinforced composites
submitted to variable temperature loading: Application to Sheet Molding
Compound composites
S. Tamboura
a, M.A. Laribi
b,c,⁎, J. Fitoussi
c, M. Shirinbayan
c, R. Tie Bi
d, A. Tcharkhtchi
c,
H. Ben Dali
aaEcole Nationale d’Ingénieurs de Sousse, LMS, Pôle technologique, Route de Ceinture, 4054 Sousse Tunisia bInstitut Clément Ader ICA, CNRS UMR 5312, 3, Rue Caroline Aigle, 31400 Toulouse, France cArts et Metiers Institute of Technology, CNAM, PIMM, HESAM University, F-75013 Paris, France dZero Emission, FAURECIA CLEAN MOBILITY, 25550 Bavans, France
Keywords: Composites modeling Thermomechanical loading Fatigue life prediction Damage
A B S T R A C T
The majority of fatigue life prediction models which have been proposed for the Short Fiber Reinforced Composite (SFRC) materials have been developed for constant temperature. However, in real situations, SFRC structures are subjected to variable temperature. This study focus on the response of SFRC composites subjected to different sequences (or blocks) under variable temperature conditions. Experientially, this kind of study re-quires a lot of investment from the point of view of cost and time. In this paper, the results coming from modelling the fatigue life and residual stiffness of short fiber reinforced composites subjected to thermo-mechanical loadings are reported. In fact, we propose to use a hybrid microthermo-mechanical-phenomenological model to quantify the evolution of the local damage rate during each loading block. Indeed, damage accumulation is calculated and cumulated step by step through the calculation of the evolution of a local damage ratio which describes the evolution of micro-cracks density until failure. Life prediction for specimens submitted to a vari-able temperature loading found to give acceptvari-able results compared to experiments.
1. Introduction
Due to their several advantages, Short Fiber Reinforced Composites (SFRC) have been chosen for many decades as a good replacement for metallic structures in different domains, automobile, aeronautic and many other applications. However, the composite materials are strongly conditioned by the ability to design structures under various complexes loadings such as fatigue. They present a complicated beha-vior compared to homogeneous materials such as metals. Many para-meters can affect the fatigue properties of composites[1];fiber length andfiber orientation distribution[2], the reinforcement structure[3], loading and environmental conditions like temperature [4], cycling frequency[5], stress ratio[6],…).
For SFRC, damage starts very early. Damaged zones growing gra-dually are associated to a progressive loss of stiffness and strength[7]. Damage threshold and kinetic depend on the different loading condi-tions such as amplitude, temperature, stress ratio and frequency. There
has been a great effort to develop methods that can predict fatigue life of SFRC. These models can be classified into three main categories[1]: empirical, used generally for metals and based on S-N curves, phe-nomenological based on a macroscopic damage description or residual stiffness and micromechanical models which are generally based on microscopic damage mechanisms.
Many empirical and phenomenological approaches based on stiff-ness or strength degradation have been introduced for composite ma-terials fatigue researches[8–14]. Many of them were reviewed in many outstanding studies[15–18]. Commonly, authors have limited experi-mental data available to assure approach robustness. Generally, re-sidual strength models or rere-sidual stiffness-based models are used. However, despite a more important scattering, the strength model is generally preferred.
Indeed, at the microscopic scale, the local damage occurring in short fiber reinforced composites strongly influence the macroscopic non-linear behavior. Therefore, phenomenological models need very large
⁎Corresponding author at: Institut Clément Ader ICA, CNRS UMR 5312, 3, Rue Caroline Aigle, 31400 Toulouse, France. E-mail addresses:[email protected](M.A. Laribi),joseph.fi[email protected](J. Fitoussi),
[email protected](M. Shirinbayan),[email protected](R.T. Bi),[email protected](A. Tcharkhtchi).
experimental campaign to be predictive for any microstructure. Experimental investigation of strength evolution is money and time consuming. Only one residual strength value can be obtained per spe-cimen. In industrial applications, in which a high-level of assurance is required, the design for composites often use advanced statistical ana-lysis.
Moreover, effect of temperature on fatigue behavior and life has been studied by several authors but mainly in the case of shortfiber reinforced thermoplastics obtained by injection molding. A lot of stu-dies focus on polyamide-based composites[22–27]. Launay et al.[28] emphasized a temperature humidity equivalence when considering the gap between the working temperature and the glass transition. Some authors studied the combined effect of mechanical and thermal cycling on PBT based composites [29–31]. Although SMC composite compo-nents are subjected to thermomechanical fatigue, to our knowledge, there are no study carried out on this topic whether in experimental or modelling approach.
In this paper, we used a new hybrid model able to predict the fa-tigue life for SFRC materials under different temperature conditions [32]. This model aims to share the benefits of both the phenomen-ological and micromechanical approaches. This original hybrid ap-proach consists in using an existing micromechanical damage model developed for monotonic tensile test simulation[33]. This multi-scale model is then adapted to predict the fatigue life of SFRC submitted to various thermomechanical profile.
It is well known that SFRC submitted to quasi-static or fatigue loading mainly develop fiber–matrix interface damage [33,34]. The Mori Tanaka approach is used to introduce this predominant damage mechanism through a local quadratic criterion which aims to describe statistically the evolution offiber–matrix interface micro-cracks during loading until failure. This multi-scale damage model relates the mac-roscopic relative stiffness E/E0 to micro-cracks density. As result, a state equation relating the macroscopic damage rate E/E0 to a local damage rate d/dc(where dc corresponds to the micro-cracks density at
failure of sample) can be established[32]. Then, the analytic expression of the loss in stiffness under fatigue loading coming from experimental investigation can be introduced in the derived equation established in the case of monotonic loading. This leads to the expression of the equation of state in the case of fatigue loading. In a previous study, this hybrid approach allowed fatigue life prediction in the case of constant amplitude and temperature. The aim of this paper isfirst to present experimental results coming from fatigue tests performed at constant amplitude and variable temperature. The results are presented in the form of progressive loss of stiffness and fatigue life for different mi-crostructures of Sheet Molding Compound. Then, an adaptation of the hybrid micromechanical approach allowing fatigue life prediction for variable temperature loading schemes is proposed and validated by comparison to experimental results.
2. Material, experimental methods and analysis 2.1. Material
Sheet Molding Compound (SMC) composites are typically used in automotive industry. SMC is a good mechanical performance material consisting of a polyester resin reinforced by chopped glassfibers (28% in mass) and CaCO3particles (37% in mass). Glassfibers are presented
in the form of coated resin bundles. For the need of the study, two types of SMC plates are molded using thermo-compression process under a pression of 60 Bar and a temperature of 165 °C. The first one is a randomly oriented material (RO material), obtained byfilling in the center of a rectangular mold (120 × 250 mm2) more than 80% of the
surface by non-reticulated SMC flanks. Then, because of the limited flowing in the mold during thermo-compression, no preferential ma-terial orientation is be obtained (Fig. 1, (a)). The second microstructure is a high oriented materiel obtained by placing the SMCflanks in one
edge of the mold and recovering only 50% of its surface. This leads to a high orientedfibers distribution in the flow direction (HO material). (Fig. 1, (b)).
One can notice that the used SMC was supplied by Faurecia com-pany. The primary characterisation results have been presented in[32]. 2.2. Experimental methods
2.2.1. Specimen geometry
Overall mechanical test has been realized on a MTS 830 hydraulic fatigue machine.Fig. 2shows the specimen geometry.
2.2.2. Test configuration
Several types of mechanical tests have been performed:
- Tensile tests were performed with the load velocity of 5 mm/min (seefigure XXX).
- Quasi-static loading–unloading tensile tests with increasing max-imum stress. The analysis of the reloading slope leads to the determi-nation of the corresponding loss of stiffness.
– Tension-tension stress-controlled fatigue tests at different applied maximum stress (σmax). The chosen stress-ratio and frequency were
R = 0.1 and f = 10 Hz.
– Tension-tension fatigue loading with variable temperature at con-stant amplitude. To this aim, a specific thermal scheme was defined to be representative of real variations undergone by automotive structures such as tailgates (Fig. 3). Five sequences are applied noted from S1to S5. Each one is characterized by a couple temperature,
number of applied cycles during the considered sequence: =
Si ( ,T Ni i).
This procedure was applied on three microstructure configurations: RO, HO-0° and HO-90°. Each configuration was tested on three speci-mens.
2.3. Experimental analysis
2.3.1. Loss of stiffness during tensile loading
From the results of testing[32]that we have performed, we propose to describe the evolution of the loss of stiffness during monotonic loading by a linear function (Fig. 4). This equation is based on the stress at threshold of damage,σTiS and is expressed by:
⎜ ⎟ ⎛ ⎝ ⎞ ⎠ = + σ −σ E E 1 a (Ti Ti) S 0 imp (1) where E0and E are the Young’s modulus of the non-loaded and the
damaged one (after the application of σimp). The index,“T
i,” indicates
the considered temperature. Therefore,σiSanda
i define the value of
stress at threshold and the kinetics of damage under uniaxial load, re-spectively. Note that for fatigue loading, the same expression may be used to evaluate thefirst loss of stiffness consecutive to the application of thefirst cycle at an imposed stress, σimp.
2.3.2. Loss of stiffness under fatigue loading
From the experimental results, the loss in stiffness under fatigue loading at a given temperature (index “i”) can be described by the following power function (Fig. 5):
⎜ ⎟ ⎛ ⎝ ⎞ ⎠ = A E E TN B 1 N i Ti (2) whereE1represents residual stiffness after the first cycle and A and B are material parameters dependent only on applied temperature.
Note that, in fatigue test, because of the hydraulic system the re-quested loading cannot be applied instantly. Generally, it requires a given number of cycles, Ns to obtain the stabilization of the hydraulic
device. It is rather a parameter relative to the machine. It has been established that this stabilization stage does not increase the damage rate. So, we can consider that:
⎜ ⎟ ⎜ ⎟ ⎛ ⎝ ⎞ ⎠ = ⎛ ⎝ ⎞ ⎠ = = E E E E 0 N Ns 0 N 1 Besides, ⎜ ⎟ ⎜ ⎟ ⎜ ⎟ ⎛ ⎝ ⎞ ⎠ = ⎛ ⎝ ⎞ ⎠ ∗ ⎛ ⎝ ⎞ ⎠ = E E E E E E 0 N 1 1 0 N Ns Thefirst term
( )
EE1 , defines the loss in stiffness after the first cycle
(a)
(b)
Bundle of fibers Polyester (in black) CaCO3 particles (white points)Fig. 1. (a) RO_Material and (b) HO_Material.
Fig. 2. SMC specimen geometry.
Fig. 3. Fatigue profile with variable temperature.
Fig. 4. (a) Tensile curves and (b) Loss of stiffness in tensile loading for the RO material for three temperatures. Fig. 5. Loss of stiffness in fatigue loading.
determined by the parameters AiandBi (Eq.(2)) whereas the second term =
( )
E E N Ns 10 , corresponds to the loss of stiffness due to the application
of thefirst cycle which can be determined by Eq.(1).
Therefore, one can deduct the following expression for the loss of stiffness during fatigue:
⎜ ⎟ ⎛ ⎝ ⎞ ⎠ = + σ −σ ∗ ⌊ ⌋ N E E (1 a ( )) N T TS s B 0 N imp i i Ti (3) One can note that experimental results show that the damage ki-netic parameters, Bi, may be considered independent of the applied
amplitude. However,ai,σiSandBidepend on microstructure and
tem-perature. The damage threshold,σiS, and the damage kinetic parameter
under monotonic loading,ai, should be identified experimentally or
numerically using a micromechanical damage model such as the one proposed by Jendli et al.[33].
3. Hybrid model for fatigue damage and life prediction
The hybrid methodology used in this work has been detailed in a previous paper [32]. This approach combines a damage micro-mechanical model to a phenomenological approach. A local damage criterion is introduced in a Mori and Tanaka model in order to predict statistically the evolution of thefiber–matrix interface damage which is known to be the main damage mechanism[33]. Therefore, the mono-tonic tensile behavior is predicted as a function of the microstructure. At each loading step, the damaged microstructure is defined by three populations of heterogeneities: the non-damagefibers, the active fibers (including both the non-damagedfibers and a part of the damaged fi-bers) and the micro-cracks whose volume fractions are respectively given by: = − ∗ = + ∑ = + − = − − − f (1 P ) f f f k P ·f f f h·P ·f n ND r n n 1 ND n act n ND i 1 n r i i 1 ND n mc n 1 mc r n n 1 ND (4) where k present a reduction, coefficient applied to fibers partially da-maged and h is the ratio between the volume of the introduced penny shape (representing interfacial micro-crack) and thefiber evaluated by geometric considerations. Subsequently, a Mori and Tanaka homo-genization procedure integrating matrix, reinforcements and micro cracks can be achieved in order to predict the evolution of the residual stiffness tensor of the composite during a monotonic tensile loading. Therefore, macroscopic damage evolution should be related to the local damage parameter,d, defined by: = −d 1 fND. Moreover, the critical
value of the local damage density, dc, has been identified. Then, a local
failure criterion is defined: d = 1.
dc The stress–strain curves and the associated loss of stiffness and local damage rate are finally derived (see figure. Indeed, the micromechanical damage model establishes a re-lationship between the local and the macroscopic damage rates corre-sponding respectively to d
dc and the relative loss of stiffness,
E E0.
The identification of the latter allows describing step by step the evolution of the local damage during a monotonic loading until failure. The main assumption of the proposed hybrid approach is to consider that this relationship is intrinsic and can be described by a unique state equation independent of the microstructure and the type of loading. Therefore, the state equation can be established under monotonic loading using the micromechanical damage modelling briefly described above[32]and be still valuable under fatigue loading.
The identified state equation is then given by the following equation [32]: ⎜ ⎟ ⎜ ⎟ ⎜ ⎟ ⎛ ⎝ ⎞ ⎠ = ⎡ ⎣ ⎢⎛⎝ ⎞⎠ ⎤ ⎦ ⎥ + ⎡ ⎣ ⎢⎛⎝ ⎞⎠ ⎤ ⎦ ⎥+ d d α E E β E E γ c T T N T N T 0 2 0 i i i i (5) whereαi,βiandγiare micromechanical parameters depending only on
temperatureTi, and simply identified on the basis of tensile modelling
and reverse engineering for each working temperature.
The originality of the proposed approach stands in the integration of the outputs of the micromechanical damage model validated for a monotonic quasi-static tensile loading into the phenomenological for-mulation of the fatigue loss of stiffness. Indeed, the introduction of Eq. (3)into Eq.(5)leads to the following expression:
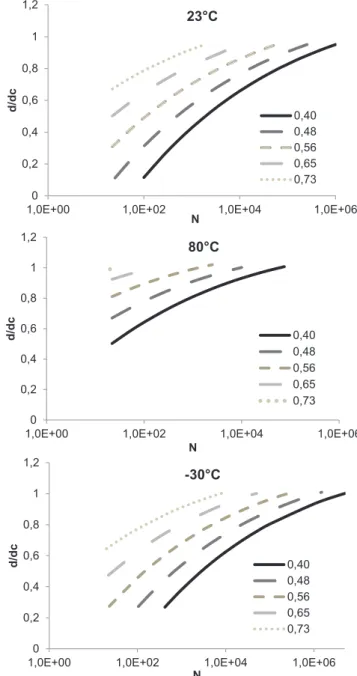
⎜ ⎟ ⎛ ⎝ ⎞ ⎠ = ⎡ ⎣ ⎢ + − ∗ ⎤ ⎦ ⎥ + ⎡ ⎣ ⎢ + − ∗ ⎤ ⎦ ⎥+ d d α a σ σ N N β a σ σ N N γ (1 ( )) (1 ( )) c T N T T imp TS s B T T imp TS s B T ( , ) 2 i i i i i Ti i i i Ti i (6) Therefore, this hybrid methodology allows converting the evolution of the phenomenological macroscopic loss of stiffness to the evolution of a local damage indicator under fatigue for different temperature. Eq. (6)allows plotting the evolution of the local damage ratio d/dc under
0 0,2 0,4 0,6 0,8 1 1,2
1,0E+00 1,0E+02 1,0E+04 1,0E+06
d/dc N
23°C
0,40 0,48 0,56 0,65 0,73 0 0,2 0,4 0,6 0,8 1 1,21,0E+00 1,0E+02 1,0E+04 1,0E+06
d/dc N
80°C
0,40 0,48 0,56 0,65 0,73 0 0,2 0,4 0,6 0,8 1 1,21,0E+00 1,0E+02 1,0E+04 1,0E+06
d/dc N
-30°C
0,40 0,48 0,56 0,65 0,73Fig. 6. The evolution of the local damage rate under fatigue loading for dif-ferent temperature at various normalized applied stress: RO material.
fatigue for several values of the applied macroscopic stress versus the applied number of cycles (seeFig. 6):
Note that the resolution of Eq. (6)for d = 1
dc gives access to the
expression of the number of cycles to failure versus the applied stress:
= ∗ ⎡ ⎣ ⎢ + − ⎤ ⎦ ⎥ = − ± − − N N G σ σ G β β α γ α 1 a ( ) where 4 ( 1) 2 R S i T TS i Ti Ti Ti Ti Ti imp 2 i i BTi1 (7) Therefore, predicted SN curve may be plotted and compared to the
experimental ones for the three working temperatures. Good agree-ments inFig. 7justify the efficiency of this approach.
One can observe fromFig. 7that the fatigue behavior of RO sample is close to the HO_90° material. This is a known topic in SMC composite [35]. This lies to the local damage scenario which are quite similar for these two microstructures.
4. Variable temperature fatigue and cumulative damage simulation
4.1. Cumulative damage methodology
Once the micromechanical damage model is identified and vali-dated, it may be used to predict the cumulative local damage until failure for a defined succession of loading sequences including tem-perature variations. Fig. 8 illustrates the proposed methodology to follow the evolution of the local damage rate throughout the successive loading sequences and to predict when failure should occur. In this figure, for the sake of illustration three curves are plotted corre-sponding to the evolution of the local damage rate for three fatigue loading at constant temperature, T1, T2and T3. These curves should be
plotted from Eq.(6)as well as those ofFig. 6. During the application of thefirst loading sequenceS1= ( ,T N1 1), the local damage rate increases until the corresponding value
( )
ddT N
( , )
c 1 1 determined by Eq. (6) for =
Ti T1. In order to cumulate the damage increase due to the second sequence, S2= ( ,T N2 2), one should use the local damage evolution corresponding toT2. This evolution is described by Eq.(6)whereTi=T2. At the beginning of the second sequence the following condition should be verified: ⎜ ⎟ ⎜ ⎟ ⎛ ⎝ ⎞ ⎠ = ⎛ ⎝ ⎞ ⎠ d d d d c ( ,T N1 1) c ( ,T N2 eq) (8)
whereNeqis the number of cycles corresponding to the same state of
damage for the new applied temperature T2. Therefore, the increment of local damage should be calculated from this point using Eq.(6)(with
=
Ti T2). The same procedure should be repeated for each transition from one loading sequence to another.
More generally, for each transition from a sequence to the following one, the same condition should be verified:
0 0,2 0,4 0,6 0,8 1 1,2 1,4 1,6
1,0E+00 1,0E+02 1,0E+04 1,0E+06
Normalized Stress N 23°C Model HO-0° RO HO-90° 0 0,2 0,4 0,6 0,8 1 1,2 1,4 1,6
1,0E+00 1,0E+02 1,0E+04 1,0E+06
Normalezed Stress N 80°C Model HO-0° RO HO-90° 0 0,2 0,4 0,6 0,8 1 1,2 1,4 1,6
1,0E+00 1,0E+02 1,0E+04 1,0E+06
Normalized Stress N -30°C Model HO-0° RO HO-90°
Fig. 7. Wohler curves predictions for the different microstructures: at 23 °C, 80 °C and−30 °C.
⎜ ⎟ ⎜ ⎟ ⎛ ⎝ ⎞ ⎠ = ⎛ ⎝ ⎞ ⎠ + d d d d c (T Ni, i) c (Ti 1,Neq) (9) The introduction of this relation in Eq.(6)allows the determination ofNeqapplicable for each transition:
= ∗⎡ ⎣ ⎢ + − ⎤ ⎦ ⎥ + + + N N a σ σ G ((1 ( )) eq S Ti imp TSi BTi 1 1 1 1 = − ± − ⎛ ⎝ − ⎞ ⎠ + + + + +
( )
G β β α γ α with 4 2 T T T T d d T N T 2 ( , ) i i i i c i i i 1 1 1 1 1Then, the value of the local damage rate at the end of the next se-quence should be computed using Eq. (6) setting T=Ti+1 and
= + +
N Ni 1 Neq. Finally, whendd
c exceeds 1 during a sequence, Si, the total number of cycles to failure may be computed following the next equation:
∑
= ∗ ⎡ ⎣ ⎢ + − ⎤ ⎦ ⎥ − + − = N N G a σ σ N N ((1 ( )) R S T imp TS eq i j j 1 1 i i BTi1 (10) To sum up, it could be said that the proposed methodology is based on the principle of superposition. It supposes that the variable tem-perature scheme can be simulated by the superposition of the corre-sponding constant temperature scheme.The computed algorithm is detailed inFig. 9. 4.2. Results
Simulations of the five sequences thermomechanical loading scheme described in Section 2.2.2 for the three microstructures
Fig. 9. Algorithm for cumulative damage calculation in the case of variable temperature loading.
0 0,2 0,4 0,6 0,8 1 1,2 d/dc N (Cycles)
Fig. 10. Example of simulated evolution of d/dc for imposed stress (RO ma-terial at 0.48 normalized stress).
configurations.
An example of the evolution of the local damage rate during a variable temperature loading scheme is given inFig. 10. These results indicate that the damage increases rapidly during first cycles. More-over, one can see some discontinuities corresponding to the transitions between sequences. One can also notice that damage kinetic differs from one sequence to another. Each passage from one sequence to another produces an acceleration of the damage. For each temperature step, the kinetics of local damage is also determined by the phenom-enological parametersaTi,σTiS andBTi and the micromechanical
para-metersαTi,βTiandγTithat depend on the temperature. It is noticeable,
in this example, that the application of the sequence S4, corresponding
to very low temperature fatigue do not have a significant influence on the local damage.
Failure happened when d = 1
dc andN=Nr. Experimental and
si-mulated results for the three material configurations are summarized in Table 1in terms of fatigue life prediction. Globally, one can see a good agreement between experimental and simulated results. The developed model can be considerate conservative. In Eq.(6), the parameters BTi
indicate the loss of stiffness kinetic for the temperature Ti. These
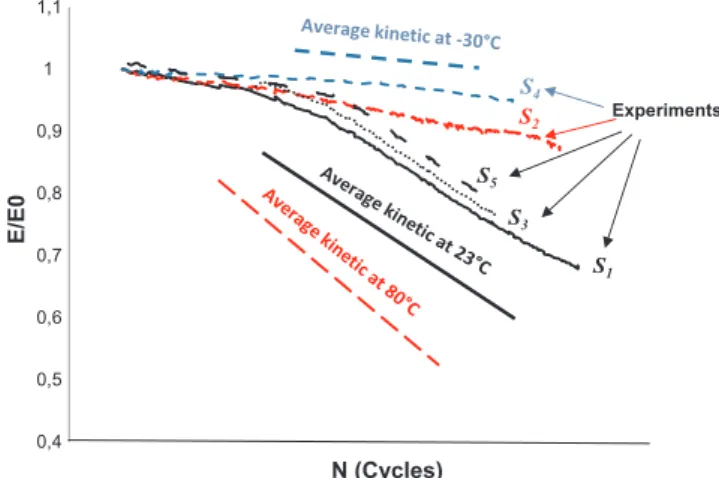
parameters are known in the case of constant temperature fatigue (see Fig. 5). Hereafter, they are called average kinetic. In the case of variable temperature scheme, they may be also identified by measuring the loss of stiffness slope during each sequence. Therefore, in order to evaluate the impact on the predicted fatigue life of a loading sequence on the following sequences, one can compare the model results obtained for the real kinetics to those obtained using the average ones.
We can note that the use of kinetics measured experimentally ac-cording to the previously proposed procedure leads to results that are obviously closer to reality (Table 2). Using that kinetics, the experi-ment-simulation gap is of the order of 9–12%. This gap reaches 28% in the case of the HO_0° material when using the average kinetics values. This acceptable considering the dispersion of this kind of material.
In order to understand the higher gaps when using average kinetics, one should analyze the influence of the application of one or several sequences on the damage kinetic of the following one.Fig. 11 empha-sizes that the application of loading sequences under 80 °C and−30 °C do not affect the damage kinetic at room temperature. The application of sequences under other temperatures (here 23 °C) affects significantly the kinetic at 80 °C. In this case, real kinetic is lower than the expected average one. Therefore, using average kinetic leads to lower predicted
fatigue life than reality. A specific study of the impact on the sequences on the damage kinetic of the following one should improve the appli-cation of the principle of superposition used here.
5. Conclusion
A hybrid model to predict fatigue life of SFRC materials based on a phenomenological approach coupled with a micromechanical damage model taking into account localfiber–matrix interfacial failure devel-opment has been presented. A state equation, whose parameters can be identified in the case of a simple tensile test and be used in the case of fatigue loading, relating a local damage rate to the applied stress, the number of cycle and micromechanical parameters has been derived. One parameter set has been identified for three temperature conditions. S-N curves at 23 °C, 80 °C and−30 °C have been predicted and have been found to be in good agreement with experimental data. Moreover, this approach allowed modelling the evolution of the local damage ratio under fatigue loading with variable temperature. The principle of su-perposition was used to determine the cumulative damage at the local scale during afive sequences variable temperature loading scheme. This approach has been applied for three different microstructural config-urations of SMC materials. The model allows determine the damage rate during fatigue until failure. It was shown that near than 80% of the fiber–matrix interfaces are broken during the first sequence. Then, lower increments of damage are observed for the next sequences. It has been also emphasized that the effect of very low temperature could have a neglectable influence on local damage accumulation. Indeed, a relatively slow loss of stiffness has been observed at −30 °C.
Moreover, it has been shown that the application of sequences at other temperature may have an influence on the damage kinetic at 80 °C where it doesn’t impact it at 23 °C. An experimental analysis should be performed in order to understand the influence of both cy-cling and temperature on the polymer morphology and its effect on the local damage kinetic. Therefore, our model should be improve. However, at this stage, the predicted fatigue lives remain acceptable regarding to the literature. For example, in the case of variable fatigue conditions, it is commonly agreed that life predictions based on the modeling procedures are validated when they are within a factor of 3 of the experimental lives[36]. In our case, we observe a gap of 30% only in the case of an intermediate stage at high temperature. Therefore, we can conclude that the proposed method has shown a real efficiency to predict fatigue life of SMC composites submitted to variable tempera-ture and constant amplitude.
Moreover, a good agreement between experimental and predicted fatigue lives have been found for all studied microstructures.
One can conclude that, although pragmatic, the proposed new
Table 1
Comparison between the experimental and the simulated results.
Model prediction µstructure Specimen Normalized
Amplitude N (Cycles) Average Kinetic Real Kinetic RO 1 0.48 36,860 55,000 51,000 2 0.48 52,015 65,000 3 0.48 47,055 36,000 HO_0° 1 0.82 51,976 60,000 42,000 2 0.82 38,544 49,000 3 0.82 49,447 66,000 HO_90° 1 0.40 48,234 52,000 43,000 2 0.40 33,902 35,000 3 0.40 56,207 47,000 Table 2
Analysis of variability of prediction compared to the real failure.
Microstructure Average Kinetic Experiment Kinetic
RO 21.39% 11.82%
HO_0° 28.60% 12.17%
HO_90° 12.76% 9.64%
Fig. 11. Illustration of real and average damage Kinetic for afive sequences variable temperature loading scheme, RO material.
hybrid model has shown a strong potential and a high level of relevance for SFRC fatigue life prediction. In the near future, the model will be extended to variable amplitude and temperature. The model should be introduced into afinite element analysis and adapted for fatigue design of SMC structural components. In further studies, the influence of other fatigue parameters should be integrated such as frequency and load ratio in order to improve the presented approach. Moreover, it should be applied in the case of thermoplastic composites for the visco-elastic and visco-plastic matrix behavior is highly coupled with damage at the local scale. Indeed, some authors have demonstrated the strong in flu-ence of the local plasticity around the fibers with specific effects on local debonding at the interface due to fatigue[37,38].
References
[1] Degrieck J, Van Paepegem W. Fatigue damage modelling offibre-reinforced com-posite materials: review. Appl Mech Rev 2001;54(4):279–300.
[2] Bernasconi A, Davoli P, Basile A, Filippi A. Effect of fibre orientation on the fatigue behaviour of a short glassfibre reinforced polyamide-6. Int J Fatigue
2007;29:199–208.
[3] Roundi W. Experimental and numerical investigation of the effects of stacking se-quence and stress ratio on fatigue damage of glass/epoxy composites. Compos B 2017;109:64–71.
[4] Bellenger V, Tcharkhtchi A, Castaing P. Thermal and mechanical fatigue of a PA66/ glassfibers composite material. Int J Fatigue 2006;28(10):1348–52.
[5] Khan R, Alderliesten R, Badshah S, Benedictus R. Effect of stress ratio or mean stress on fatigue delamination growth in composites. Crit Rev Compos Struct 2015;124:214–27.
[6] Eftekhari M, Fatemi A. On the strengthening effect of increasing cycling frequency on fatigue behavior of some polymers and their composites: Experiments and modeling. Int J Fatigue 2016;87:153–66.
[7] Belmonte E. Damage mechanisms in a short glassfiber reinforced polyamide under fatigue loading. Int J Fatigue 2017;94:145–57.
[8] Waddoups ME, Halpin JC. The fracture and fatigue of composite structures. Comput Struct 1974;4(3):659–73.
[9] Wolff RV, Lemon GH. Reliability predictions for adhesive bonds. Rep. AFMLTR-72-121. Air Force Materials Laboratory; March 1972.
[10] Broutman LJ, Sahu S. A new theory to predict cumulative fatigue damage in fi-berglass reinforced plastics. Composite materials: testing and design (second con-ference) ASTEM STP 497. American Society for Testing and Materials; 1972. p. 170–88.
[11] Yang JN, Liu MD. Residual strength degradation model and theory of periodic proof tests for graphite/epoxy laminates. J Compos Mater 1977;11:176–203. [12] Yang JN, Sun CT. Proof Test and fatigue of unnotched composite laminates. J
Compos Mater 1980.https://doi.org/10.1177/002199838001400208. [13] Yang JN, Jones DL. Load sequence effects on the fatigue of unnotched composite
materials. Fatigue Fibrous Compos Mater ASTM STP 1981;723:213–32. [14] Sendeckyj GP. Life prediction for resin-matrix composite materials. In: Reifsneider
KL, editor. Fatigue of composite materials. Elsevier Science Publishers; 1990. p. 43183.
[15] Passipoularidis VA, Philippidis TP. Strength degradation due to fatigue infiber dominated glass/epoxy composites: a statistical approach. J Compos Mater
2009;43(9):997–1013.
[16] Tserpes KI, Papanikos P, Labeas G, Pantelakis SP. Fatigue damage accumulation and residual strength assessment of CFRP laminates. Compos Struct 2004;63:219–30. [17] Philippidis TP, Assimakopoulou TT, Antoniou AE, Passipoularidis VA. Residual
strength tests on ISO standard ± 45_ Coupons, OB_TG5_R008_UP, July 2005. Available from:http://www.kcwmc.nl/optimatblades/Publications.
[18] Passipoularidis VA, Philippidis TP. A study of factors affecting life prediction of composites under spectrum loading. Int J Fatigue 2009;31(3):408–17. [22] Jia N, Kagan VA. Effects of time and temperature on the tension-tension fatigue
behavior of shortfiber reinforced polyamides. Polym Compos 1998;19:408–14. [23] Handa K, Kato A, Narisawa I. Fatigue characteristics of a glass-fiber-reinforced
polyamide. J Appl Polym Sci 1999;72:1783–93.
[24] Noda K, Takahara A, Kajiyama T. Fatigue failure mechanisms of short glass-fiber reinforced nylon 66 based on nonlinear dynamic viscoelastic measurement. Polymer 2001;42:5803–11.
[25] Sonsino CM, Moosbrugger E. Fatigue design of highly loaded short-glass-fibre re-inforced polyamide parts in engine compartments. Int J Fatigue 2008;30:1279–88. [26] De Monte M, Moosbrugger E, Quaresimin M. Influence of temperature and thickness
on the off-axis behaviour of short glass fibre reinforced polyamide 6.6 – cyclic loading. Compos Part A: Appl Sci Manuf 2010;41:1368–79.
[27] Guster C, Pinter G, Mösenbacher A, Eichlseder WC. Evaluation of a simulation process for fatigue life calculation of shortfibre reinforced plastic components. Procedia Eng 2011;10:2104–9.
[28] Launay A, Marco Y, Maitournam MH, Raoult I. Modelling the influence of tem-perature and relative humidity on the time-dependent mechanical behaviour of a short glassfibre reinforced polyamide. Mech Mater 2013;56:1–10.
[29] Pierantoni M, De Monte M, Papathanassiou D, De Rossi N, Quaresimin M. Viscoelastic material behaviour of PBT-GF30 under thermo-mechanical cyclic loading. Procedia Eng 2011;10:2141–6.
[30] Schaaf A, De Monte M, Hoffmann C, Vormwald M, Quaresimin M. Damage me-chanisms in PBT-GF30 under thermo-mechanical cyclic loading. In: The 29th in-ternational conference of the polymer processing society, vol. 1593. 2014. p. 600–5. [31] Schaaf A, De Monte M, Moosbrugger E, Vormwald M, Quaresimin M. Lifeestimation methodology for shortfiber reinforced polymers under thermo-mechanical loading in automotive applications. In: Proceeding of 4th symposium on structural dur-ability. Darmstadt, Germany; 2014.
[32] Laribi MA, Tamboura S, Fitoussi J, Tié Bi R, Tcharkhtchi A, Ben Dali H. Fast fatigue life prediction of shortfiber reinforced composites using a new hybrid damage approach: Application to SMC. Compos B Eng 2018;139:155–62.
[33] Jendli Z, Meraghni F, Fitoussi J, Baptiste D. Multi-scales modelling of dynamic behaviour for discontinuousfibre SMC composites. Compos Sci Technol 2009;69:97–103.
[34] Tamboura S, Sidhom H, Baptiste D. Evaluation de la tenue en fatigue du composite SMC R42. Matériaux et Techniques 2001;3–4:3–11.
[35] Shirinbayan M, Fitoussi J, Meraghni F, Laribi M, Surowiec B, Tcharkhtchi A. Coupled effect of loading frequency and amplitude on the fatigue behavior of Advanced Sheet Molding Compound (A-SMC). J Reinf Plast Compos 2017;36(4):271–82.
[36] Eftekhari M, Fatemi A. Variable amplitude fatigue behavior of neat and short glass fiber reinforced thermoplastics. Int J Fatigue 2017;98:176–86.
[37] Arif MF, Meraghni F, Chemisky Y, Despringre N, Robert G. In situ damage me-chanisms investigation of PA66/GF30 composite: Effect of relative humidity. Compos B 2014;58:487–95.
[38] Rolland H, Saintier N, Raphael I, Lenoir N, King A, Robert G. Fatigue damage mechanisms of shortfiber reinforced PA66 as observed by in-situ synchrotron X-ray microtomography. Compos B 2018;143:217–29.