HAL Id: hal-01560001
https://hal-univ-rennes1.archives-ouvertes.fr/hal-01560001
Submitted on 11 Jul 2017HAL is a multi-disciplinary open access archive for the deposit and dissemination of sci-entific research documents, whether they are pub-lished or not. The documents may come from teaching and research institutions in France or abroad, or from public or private research centers.
L’archive ouverte pluridisciplinaire HAL, est destinée au dépôt et à la diffusion de documents scientifiques de niveau recherche, publiés ou non, émanant des établissements d’enseignement et de recherche français ou étrangers, des laboratoires publics ou privés.
Richard Renou, Laurent Soulard, Emilien Lescoute, Corentin Dereure, Didier
Loison, Jean-Pierre Guin
To cite this version:
Richard Renou, Laurent Soulard, Emilien Lescoute, Corentin Dereure, Didier Loison, et al.. Silica Glass Structural Properties under Elastic Shock Compression: Experiments and Molecular Simula-tions. Journal of Physical Chemistry C, American Chemical Society, 2017, 121 (24), pp.13324-13334. �10.1021/acs.jpcc.7b01324�. �hal-01560001�
Silica Glass Structural Properties under Elastic
Shock Compression : Experiments and Molecular
Simulations
Richard Renou,
†Laurent Soulard,
†Emilien Lescoute,
†Corentin Dereure,
‡Didier
Loison,
‡and Jean-Pierre Guin
∗,‡†CEA, DAM, DIF, 91297 Arpajon, France
‡Institut de Physique de Rennes - UMR CNRS 6251, 263 Avenue Général Leclerc, Université de Rennes 1, 35700 Rennes, France
E-mail: [email protected] 3 4 5 6 7 8 9 10 11 12 13 14 15 16 17 18 19 20 21 22 23 24 25 26 27 28 29 30 31 32 33 34 35 36 37 38 39 40 41 42 43 44 45 46 47 48 49 50 51 52 53 54 55 56 57 58 59
Abstract
The behavior of silica glass material under shock compression has been investigated in this work. Laser-driven experiments and molecular dynamics simulations were combined to study the elastic regime of fused silica up to 8 GPa. Two simple pair potentials, BKS and CHIK, were tested and the shocked states of the glassy material were obtained by direct shocks and a new Hugoniostat method. The Hugoniot curves obtained numerically were in a very good agreement with the the experimental curves. Despite the simplicity of their mathematical form, the pair potentials tested (BKS and CHIK) were able to give a fair description of the silica glass behavior under shock load-ing conditions. The structural properties of silica glass were also thoroughly studied. It was found that in the elastic regime, the Short-Range Order (tetrahedra...) and the Medium-Range Order (rings...) were not impacted by the shock wave propagation in-side the material. The structural changes behind the shock front were mainly related to a free volume closing mechanism highlighting the importance of free volume analysis in silica glass materials.
Introduction
High power lasers are widely used in industrial processes for material design and in optical systems. One major problem is the damage an optical component can encounter under intense irradiation : density changes, spallation or crack initiation. Damaged component could initiate damages in other optical components leading to a global failure of the whole optical system. Understanding the damaging mechanisms occurring under shock loading conditions is crucial.
Amorphous materials do not exhibit a structural organization at long range. However, in silica glass, a two-level organization can be observed. Oxygen atoms are structured around silicon atoms in a tetrahedral fashion. The Short-Range Order (SRO) in silica is related to the tetrahedral properties (Si-O bonds, intra-tetrahedral angle). In addition,
3 4 5 6 7 8 9 10 11 12 13 14 15 16 17 18 19 20 21 22 23 24 25 26 27 28 29 30 31 32 33 34 35 36 37 38 39 40 41 42 43 44 45 46 47 48 49 50 51 52 53 54 55 56 57 58
Oxygen atoms are usually connecting several tetrahedra and rings composed of 3 to 10 tetrahedra are observed. The Medium-Range Order (MRO) corresponds to the rings properties (Si-Si distribution, inter-tetrahedral angle). Free volumes can also be observed in between rings due to the amorphous nature of glass materials. This peculiar two-level organization has been widely studied in the past. However little is known about the evolution of the silica structure under shock loading conditions.
The overall behavior of fused silica glass under shock compression has been studied for decades. First experiments of shock produced by explosive devices with free surface velocity measurement were published by Wackerle in 19621. In 1970, Barker published results of plate impact experiments on fused silica2. In these two papers, maximum pressure generated into the sample was about 10 GPa. From the early 1980s to the present day, other works have dealt with the shock compression behavior of fused silica under higher pressure condition up to 80 GPa3–5.
Accessing the atomic structure inside glasses by experimental means is quite challeng-ing. Usual methods for crystalline phases (for example X-ray diffraction) are not able to give reliable results for amorphous material. Raman spectroscopy however can be used to investigate small rings inside silica glasses and the inter-tetrahedral\OSiO angle
distri-bution. Larger rings and many other structural properties remains unavailable though. To overcome these limitations, numerical simulations are often carried out to investigate properties unavailable by experiments.
Molecular dynamic simulations is a powerful technique to gain insight on the micro-scopic properties of a material. Several works using non-equilibrium molecular dynamics simulations (NEMD) have been previously reported on fused silica under shock loading. Early works were published by Kubota et al. in which the authors studied a 1D-shock generated by a rigid wall impacting a fused silica system6,7. The authors focused on the analysis of the ring distribution in the densified silica glass. Su et al. used molecular dynamic simulations to investigate shock-induced ejection with high velocity impacts
3 4 5 6 7 8 9 10 11 12 13 14 15 16 17 18 19 20 21 22 23 24 25 26 27 28 29 30 31 32 33 34 35 36 37 38 39 40 41 42 43 44 45 46 47 48 49 50 51 52 53 54 55 56 57 58 59
(from 3000 to 5000 m/s) on a silica surface8. More recently, the transition of fused silica and α-quartz toward a high-pressure polymorph (stishovite) was thoroughly investigated by Wang et al. 9. Some alternative methods are able to reproduce shocked states without using direct shocks. Izvekov et al. 10investigated silica shocked states using the adptative Erpenbeck procedure11 where a succession of simulations in the isothermal-isobaric en-semble (NPT) is used to converge slowly toward a shocked state. The authors essentially focused on the structural properties of silica glass in the densification regime and under hydrostatic compression. Barmes et al. 12 studied the angular and ring distribution of densified states using both NEMD and a method called Hugoniostat. In the latter case, the motion equations are rewritten and the Hugoniot relations are used as a constraint. The volume is chosen at the beginning of the simulation and the system will thus converge toward a shocked state. Barmes et al. showed that this Hugoniostat method is a good alternative to NEMD simulations and could be successfully applied to glass materials12.
Despite the number of studies on fused silica, data in the elastic regime are somehow scarce. The aim of this paper is four-fold : 1) to provide experimental data on the shocked states of silica glass in the elastic regime, 2) to use these experimental results for molecular model calibration and validation, 3) to ensure that the new Hugoniostat method developed in a recent work13 is yielding correct results on glassy systems and 4) to investigate the structural silica glass properties under shock compression using molecular simulations. In this work, we report both experimental and molecular dynamic modeling results on the elastic behavior of fused silica glass under laser driven shock conditions.
Experimental Study
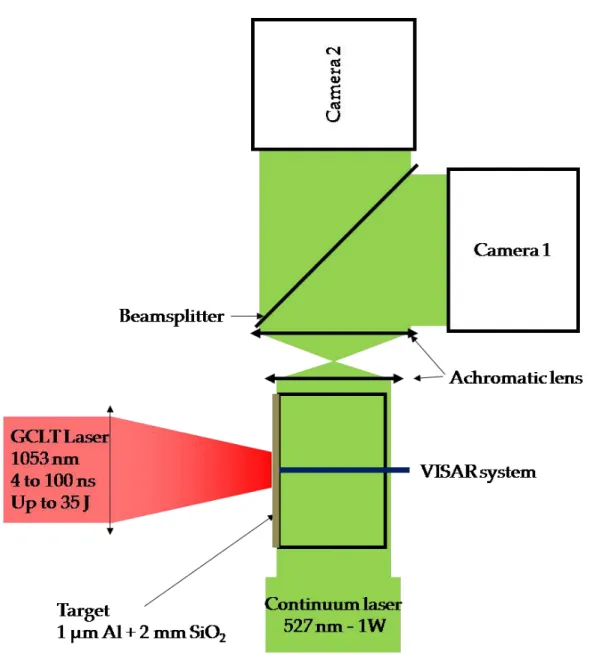
A series of experiments have been performed on the Transportable Laser Shocks Generator (GCLT) Facility of the CEA. Figure 1 presents the experimental setup. One laser shot consists in focusing, on the front face of the sample, the 1 mm in diameter spot of a laser
3 4 5 6 7 8 9 10 11 12 13 14 15 16 17 18 19 20 21 22 23 24 25 26 27 28 29 30 31 32 33 34 35 36 37 38 39 40 41 42 43 44 45 46 47 48 49 50 51 52 53 54 55 56 57 58
beam, which properties are as follow: a 1053 nm wavelength, a 4 to 100 ns duration, and an energy up to 50 J. The sample is a 10x10mm parallelepiped rectangle of fused silica glass, with a thickness of 2 mm, cut from a fused silica glass rod (spectrosil 2000)R
whose density is 2.2 g.cm−3. All surfaces are polished down to the micron level to reduce surface defects and to have a good optical transparency for instrumentation purpose. A 1 µm-thick aluminum is vapor deposited on the front face of the sample in order to promote a controlled and known interaction between the laser pulse and the matter. The later produces a high-pressure plasma whose expansion generates a shock wave that propagates into the sample. During the experiment, the sample is placed in a secondary vacuum chamber in order to avoid laser breakdown. The time resolved instrumentations used for each shot consists in: a transverse shadowgraphy to observe the shock wave while it propagates across the transparent sample14,15and a Velocity Interferometer System for Any Reflector (VISAR) apparatus2,16to measure the velocity of the interface between the aluminum layer and the fused silica glass accelerated by the shock near the front face.
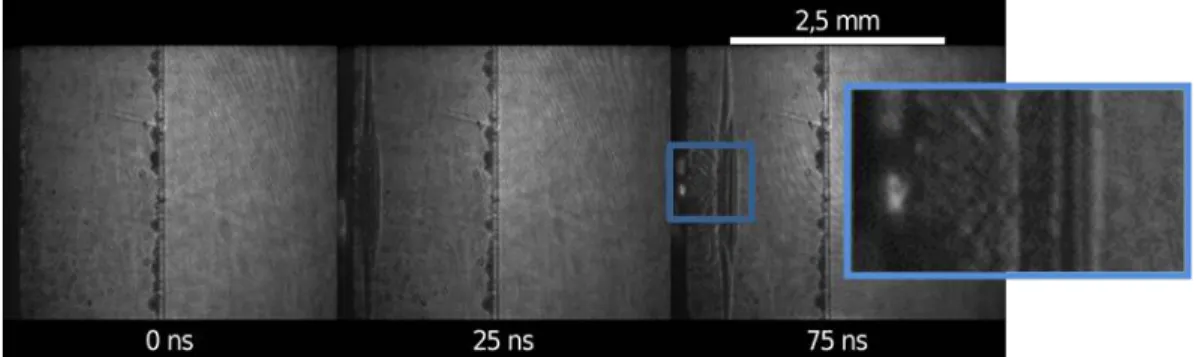
Regarding the transverse shadowgraphy technique, a continuous laser is collimated and crosses through the transparent fused silica glass to reach 2 ICCD cameras (4Picos from Stanford Computer Optics able to take 2 pictures with a minimum interframing about 500 ns). The propagation of the shock wave induces a pressure variation, which modifies the optical refractive index of the glass. The collimated light of the laser beam is therefore deflected in the shocked area, which creates a shadow contrast on the ICCD camera. The velocity of the shock wave is computed from the measure of the displacement of the shock wave within a controlled time gap. This time gap as to be kept as short as possible due to the action of the release waves that can modify the shock. The 4Picos cameras were trigged by a Stanford DG535 to obtain two images of the shock propagation with a small interframe, typically 50 ns. In order to limit motion blur, which is an issue to capture fast displacement, the acquisition time was set to 5 ns. Figure 2 presents several shadowgraph images of a sample irradiated by a 123.7 GW.cm−2intensity and 10 ns duration laser shot.
3 4 5 6 7 8 9 10 11 12 13 14 15 16 17 18 19 20 21 22 23 24 25 26 27 28 29 30 31 32 33 34 35 36 37 38 39 40 41 42 43 44 45 46 47 48 49 50 51 52 53 54 55 56 57 58 59
The first picture is captured before the laser shot and used as a reference image. The two other images are obtained at 25 ns and 75 ns respectively after the beginning of the laser matter interaction.
The diameter of the laser spot is usually chosen greater than the sample thickness in order to neglect two-dimensional effects17. In this work, we chose to work with larger samples for convenience and front shock velocities were extracted from a small region of the sample, depicted here as the inset of Figure 2 and on a very short duration of 50 ns. In these conditions, the 2D effects can be neglected and we assume a one-dimensional shock propagation.
Molecular Dynamics Simulations
Silica pair potentials
Two pair potentials were chosen to model silica glass behavior in this work: the Beer-Kramer-Sanden18 (BKS) and the Carré-Horbach-Ispas-Kob19 (CHIK) model. The BKS model was originally designed by quantum calculations to reproduce the quartz behavior at ambient temperature18. This potential has been used in many works and is still the reference potential for silica materials. A parametrization of this model was designed by Carre et al. 19in order to improve the performance of the BKS model for amorphous systems. This new CHIK model was adjusted to reproduce the radial distribution functions (RDF) of O-O, Si-O and Si-Si pairs obtained by Car-Parinello Molecular Dynamics (CPMD) simulations20. The choice of these two potentials was based on several comparative works. Cowen et al. 21 have proved that the BKS potential was able to reproduce the equation of state of the high-pressure silica polymorph (stishovite) in a better way compared to some other potentials. According to Soules et al. 22, the CHIK and BKS potentials were able to reproduce the glass behavior, whereas the potential developed by Takada et al. 23 failed to reproduce the densification mechanisms. Recently, Carre et al. 24 have shown that
3 4 5 6 7 8 9 10 11 12 13 14 15 16 17 18 19 20 21 22 23 24 25 26 27 28 29 30 31 32 33 34 35 36 37 38 39 40 41 42 43 44 45 46 47 48 49 50 51 52 53 54 55 56 57 58
some more sophisticated potentials obtained by force matching methods were unable to reproduce the silica glass structure compared to the simple CHIK model. Finally, Hor-bach et al. 25 have shown that the CHIK potential was able to reproduce the experimental equation of state of silica glass along different isotherms until 10 GPa. To conclude, the CHIK and BKS potentials are able to reproduce fairly well the overall silica glass structure, better than many other potentials. Potentials based on reactive force fields could have been more accurate than simple pair potentials. However those reactive potential are known to be resources consuming. In this work we choose to focus on low computational cost potentials to be able to simulate huge systems (several millions particles).
The CHIK and BKS potential are taking into account electrostatic and Van Der Waals interactions, Equation 1. A Buckingham potential is used here to model the Van Der Waals contribution. Uij =Uijvdw+Uijelec = Aijexp(−Bijrij) − Cij r6ij + qiqj 4πe0rij (1)
U is the potential, A, B, C are Buckingham parameters, q is the atomic charge, r is the distance between particles i, j. One major drawback of Buckingham-based potentials is the divergence for small distance values. This issue was addressed by adding a simple two-order polynomial as described by Barmes et al. 12. The new Van Der Waals contribution is therefore given by Equation 2.
Uijvdw = Aijexp(−Bijrij) − Cij r6ij rij >r 0 ij aijr2ij+bijrij+cij rij ≤r0ij (2)
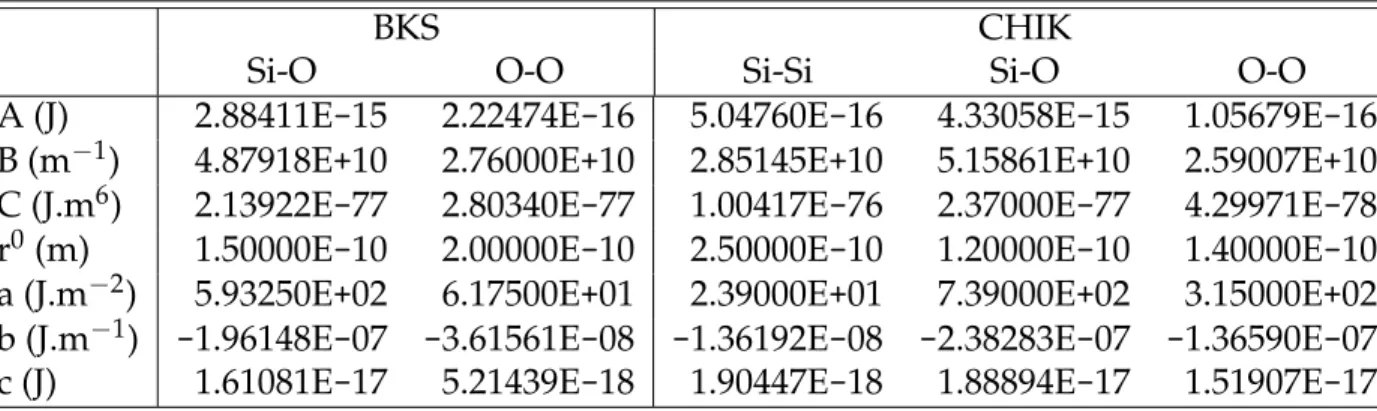
a, b, c are the two-order polynomial coefficients. r0is the cut-off distance between the two mathematical forms. The coefficients were adjusted in order to insure the continuity of potentials and forces and to fit smoothly the original potentials around the cut-off distance. The BKS and CHIK parameters used in this study are gathered in Table 1. The atomic
3 4 5 6 7 8 9 10 11 12 13 14 15 16 17 18 19 20 21 22 23 24 25 26 27 28 29 30 31 32 33 34 35 36 37 38 39 40 41 42 43 44 45 46 47 48 49 50 51 52 53 54 55 56 57 58 59
charges are qSi=2.4 and qO=-1.2 for the BKS model, and qSi=1.910418 and qO=-0.955209 for
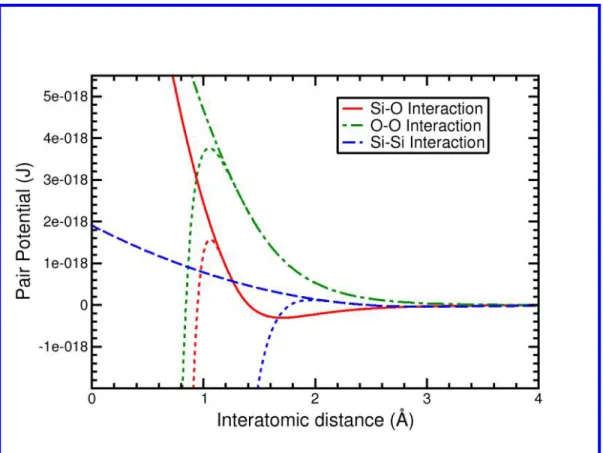
the CHIK model. The two-order polynomial coefficients for the BKS model were taken from the work of Barmes et al. 12. The coefficients for the CHIK model were developed in this work. Figure 3 presents the new CHIK model with corrected potentials. The dotted lines show the original non-corrected potentials diverging for small distances.
Table 1: BKS and CHIK parameters used to model silica glass. A, B and C are the Buckingham parameters taken from their original works18,19. a, b, c are two-order poly-nomial parameters used to correct the diverging potential at small distances.
BKS CHIK
Si-O O-O Si-Si Si-O O-O
A (J) 2.88411E-15 2.22474E-16 5.04760E-16 4.33058E-15 1.05679E-16 B (m−1) 4.87918E+10 2.76000E+10 2.85145E+10 5.15861E+10 2.59007E+10 C (J.m6) 2.13922E-77 2.80340E-77 1.00417E-76 2.37000E-77 4.29971E-78 r0(m) 1.50000E-10 2.00000E-10 2.50000E-10 1.20000E-10 1.40000E-10 a (J.m−2) 5.93250E+02 6.17500E+01 2.39000E+01 7.39000E+02 3.15000E+02 b (J.m−1) -1.96148E-07 -3.61561E-08 -1.36192E-08 -2.38283E-07 -1.36590E-07 c (J) 1.61081E-17 5.21439E-18 1.90447E-18 1.88894E-17 1.51907E-17
Electrostatics interactions are usually taken into account with the so-called Ewald summation26. However, another method with an interestingly low computational cost may be used for silica materials. This method, called Wolf method27, is a shifted and truncated coulombic potential given by Equation 3.
Uijwol f = qiqj 4πe0 ( 1 rij − 1 r0 w +rij−r 0 w r0 w ), rij ≤r0w (3)
r0w is the cut-off distance usually set at 10.17 Å. The potential decreases therefore smoothly to 0 when approaching r0w. Despite the significant error, this method has been proved to
give acceptable results with silica glass28 and is a good alternative to the Ewald method. We have checked (not shown) that the results obtained with both a Wolf method and an Ewald summation were identical under shock loading conditions. The Wolf method yields acceptable results on the pressure range tested.
3 4 5 6 7 8 9 10 11 12 13 14 15 16 17 18 19 20 21 22 23 24 25 26 27 28 29 30 31 32 33 34 35 36 37 38 39 40 41 42 43 44 45 46 47 48 49 50 51 52 53 54 55 56 57 58
Modelling glass materials
The initial amorphous structure is usually obtained using a thermal cycle29. This method is able to generate a silica glass material with a structure close to the experimental one with a low percentage of defects30. In this work, a β-cristoballite configuration was first generated and equilibrated at 300 K during 50 ps in the canonical ensemble (NVT) using a Langevin thermostat31. The system was then heated at very high temperature (8000 K) then cooled down to 300 K by decreasing the temperature by 500 K every 50 ps. Finally, the density was adjusted with a simulation in the isothermal-isobaric ensemble (NPT) at 300K using the so-called Nose-Hoover barostat 32. The final densities were of 2.203 g.cm−3and 2.260 g.cm−3for the CHIK and BKS respectively which is very close to the experimental value of 2.200 g.cm−3 29. According to Bidault et al.33, the unit cell should have a minimum length of 50 Å in order to obtain good silica ring statistics. We choose here to start with a cubic unit cell of 71 Å (24000 atoms) to be able to obtain 14-membered rings.
Simulating shocks with molecular dynamics simulations
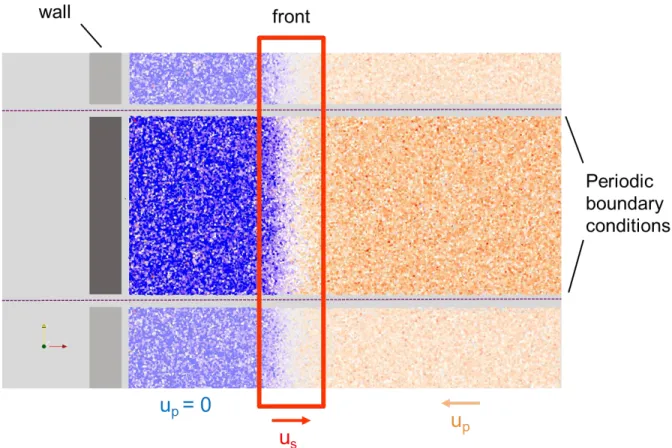
Investigating material behaviors under direct shock loading requires systems of huge dimension in order to catch all mechanisms involved. The unit cell of 24000 atoms was therefore replicated 160 times along the shock direction (in this work the x-direction). The system final dimensions are 1200x7x7 nm3 which approximately corresponds to 4 million atoms. Direct shock loading were simulated using Non-Equilibrium Molecular Dynamics simulations (NEMD). In this case the shock was generated with a silica glass system impacting a hard immobile wall with a high velocity up0, as depicted in Figure 4.
Periodic boundary conditions in the y and z directions were used to simulate an infinite system and thus a 1D-shock is studied here. Free boundary conditions were imposed along the shock direction. All NEMD shock simulations were performed in the microcanonical ensemble (NVE) and were run during 500 ps.
3 4 5 6 7 8 9 10 11 12 13 14 15 16 17 18 19 20 21 22 23 24 25 26 27 28 29 30 31 32 33 34 35 36 37 38 39 40 41 42 43 44 45 46 47 48 49 50 51 52 53 54 55 56 57 58 59
An alternative to direct shocks is the use of the Hugoniostat method. In this case the motion equations are rewritten so the system is naturally converging toward a shocked state. In this work we used the description established by Maillet et al. 13 where the system is explicitly described by the variables (q, p, T) where q is the particle positions, p the momentum and T the temperature. q and p are updated using a regular Langevin scheme. The temperature is updated using the Hugoniot relation as described by Equation 4.
T(q) = 1 NkB 2 4−c(< E> −U(q) + 1 2(P(q)+ < P >)(1−c)V) (4)
The bracket <... >denotes a statistical average over the different configurations. kB is
the Boltzmann constant, E the total energy, U the potential energy, P the total pressure, V is the initial volume and c is the compression rate. The temperature is computed using the Hugoniot relation and the positions and momentum are related to temperature changes by the Langevin scheme insuring a canonical distribution over time. The choice of a given compression ratio at the beginning of the simulation will therefore lead the system to converge toward the corresponding shocked state. Very small systems (3000 particles) may be used with this method reducing significantly the computational cost. However, one drawback is that the material experiences a thermodynamic path slightly different compared to the one observed in a direct shock. The successful application of this method on another material (or a different phase) may not be guaranteed. Moreover the dynamic phenomenon involved in a shock propagation are not available through the Hugoniostat method. As we seek to investigate the structural properties of the shocked state of silica glass, we carried out simulations with the Hugoniostat method along with NEMD simulations. All the simulations in this work were performed with the MD code STAMP developed by the CEA.
3 4 5 6 7 8 9 10 11 12 13 14 15 16 17 18 19 20 21 22 23 24 25 26 27 28 29 30 31 32 33 34 35 36 37 38 39 40 41 42 43 44 45 46 47 48 49 50 51 52 53 54 55 56 57 58
Results and Discussion
Hugoniot Curves
Assuming a 1D shock propagation, velocities, pressure and densities are related via mass and momentum conservative equations, respectively Equations 5a and 5b.
ρ1(us−up1) =ρ0(us−up0) (5a)
P1−P0=ρ0(us−up0)(up1−up0) (5b)
In these equations, index 0 and 1 refer to the state before and after the shock propagation respectively. usis the shock wave velocity, upis the velocity of the matter, P is the pressure
and ρ the density.
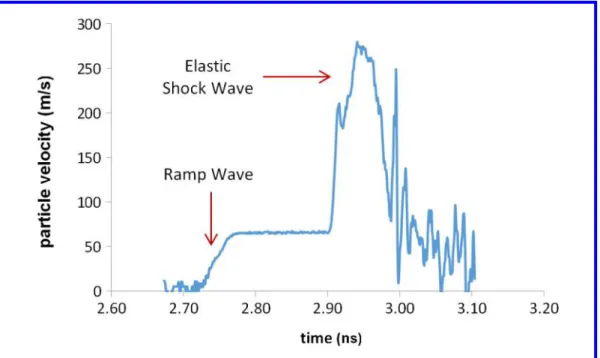
The experimental shock front velocities were calculated using shadowgraphs and the velocity of the matter at the aluminum layer-silica boundary induced by the shock is obtained from VISAR measurements. Figure 5 represents the time evolution of the velocity of the interface for the shot reported in Figure 2. A double-wave structure is observed from both the shadowgraphs and the VISAR measurements. The first wave corresponds to the ramp wave setting the material in motion up to 67 m.s−1. The second wave is depicted by the peak where the particle velocity reaches a maximum value of 277 m.s−1. Interestingly, a delay is observed between the two waves as shown by the plateau between the ramp and the shock wave. The origin of this delay is uncertain at the moment. Wave shapes are correlated to several parameters like laser shot duration and sample thickness34,35 and additional data are required to accurately investigate this phenomenon. We will address this question in a future work.
In the elastic regime, silica glasses exhibit a particular behavior as reported by Alexan-der et al. for fused silica, borosilicate and soda-lime glasses5. From the velocity profile of
3 4 5 6 7 8 9 10 11 12 13 14 15 16 17 18 19 20 21 22 23 24 25 26 27 28 29 30 31 32 33 34 35 36 37 38 39 40 41 42 43 44 45 46 47 48 49 50 51 52 53 54 55 56 57 58 59
the free surface, two waves can be distinguished : an elastic ramp wave and an elastic shock wave. Ramp waves were thoroughly studied theoretically and experimentally by Wang et al. 35and Davis et al. 34. Decaying waves were reported in the numerical studies of Su et al.8and Luo et al. 36. In the elastic regime, fused silica exhibit a non-linear behavior and the compressibility increases under compression which prevents the formation of standard shock waves. The final wave shapes, ramp wave or decaying wave, depends on many parameters like shock pressure, laser fall time and sample thickness.
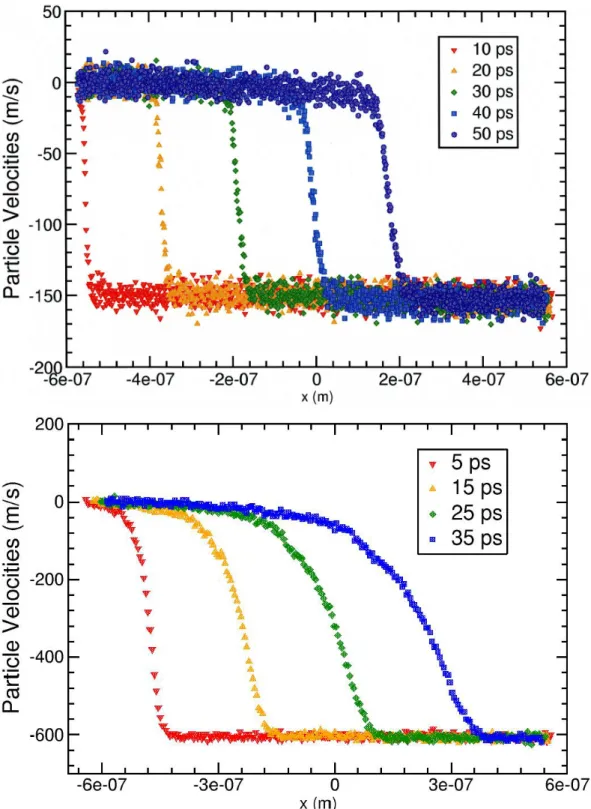
The particular double-wave structure is not observed in NEMD simulations. Examples of the time evolution of particle velocities in the material is shown Figure 6.a and Figure 6.b respectively extracted from the 2.07 GPa and 7.07 GPa NEMD simulation with the CHIK potential. A ramp wave is clearly observed in the first case and a decaying wave is seen in the latter case. However, the two-wave structure was not obtained in our simulations. Su et al. in their work defined two velocities to investigate decaying waves8. The head velocity corresponds to the velocity of the wave propagating at 0.9 up. The tail is the
velocity computed at up=200m/s. In our work, the tail velocity was chosen to be 0.1 up.
The head and the tail of the ramp wave are propagating at a constant velocity of 6272m/s. The front shape does not change over time. In the opposite, the decaying front becomes larger as the compression wave is crossing the material. The head and tail velocities of the decaying wave were estimated at 6317 m/s and 5765 m/s respectively. Pressures and densities can be extracted from molecular simulations, allowing us to use the Hugoniot relations to calculate the shock front velocity. Using Equation 5b the front is propagating at 5949 m/s which is close to the velocity of 5992 m/s computed at 0.5 up. In the following,
we chose to use the Hugoniot relations to estimate the shock velocity as it should yield a fair estimation of the front velocity. However, the definition of the front velocity is questionable in the case of decaying waves.
In order to compare both simulations and experiments, two methods were used to obtain the experimental shock front velocity. In the first method, only the second wave
3 4 5 6 7 8 9 10 11 12 13 14 15 16 17 18 19 20 21 22 23 24 25 26 27 28 29 30 31 32 33 34 35 36 37 38 39 40 41 42 43 44 45 46 47 48 49 50 51 52 53 54 55 56 57 58
velocity was considered as it corresponds to the maximum pressure. In the second method, two shocks were explicitly taken into account and the second wave velocity was computed using the first wave velocity. The differences between the two methods was less than 1%. The shock pressure, obtained through Equation 5b, does not depend on the wave shapes. The numerical and experimental shocked states can be safely compared regardless of the transient dynamic mechanisms involved. Only results obtained with the first method are presented in the following.
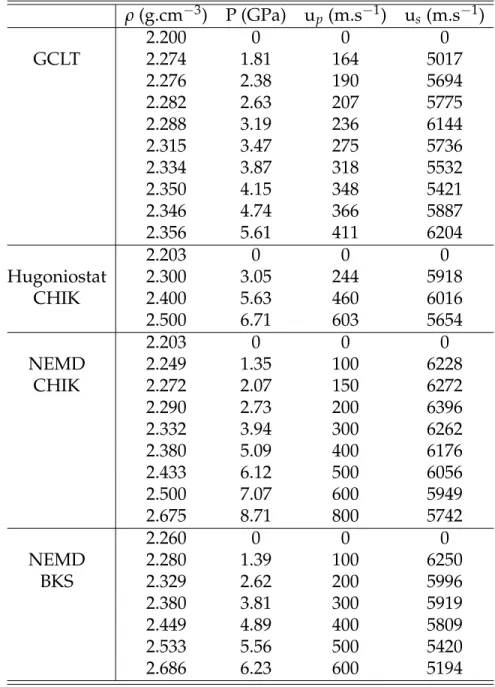
Experimental and numerical results are gathered in Table 2 and the Hugoniot curves are shown Figure 7.a and Figure 7.b. Our experimental work is labeled here GCLT. The direct shocks with NEMD simulations were carried out with the two BKS and CHIK models. The Hugoniostat method was only tested with the CHIK potential. Other data taken from works of reference1,5were also added on the Hugoniot curves. The pressure range studied here lies between 1.35 GPa and 8.71 GPa as the Hugoniot Elastic Limit (HEL) is around 8 GPA37and the scope of the article is to investigate the structure under elastic shocks.
First of all, the experimental and numerical Hugoniot curves are in agreement with the literature. The fact that our experimental results are very close to the literature and simulated 1D shock proves our 1D hypothesis acceptable in this pressure range. Both NEMD and Hugoniostat simulations are able to reproduce the behavior of fused silica under elastic shock loading although the simulated thermodynamic path is different. Interestingly, the simulations with the CHIK potential give superior results compared to the BKS potential. The relation between the pressure and the particle velocity is correct but the pressure-density formulation shows a significant discrepancy for the BKS potential. This result is not a surprise since the BKS fails to reproduce several silica glass properties like the density at ambient temperature23.
The differences between experimental and numerical front velocities are large. How-ever, comparing the two data sets is a difficult task especially with decaying wave front. The front shapes are different and the two-waves structure was not observed in our
simula-3 4 5 6 7 8 9 10 11 12 13 14 15 16 17 18 19 20 21 22 23 24 25 26 27 28 29 30 31 32 33 34 35 36 37 38 39 40 41 42 43 44 45 46 47 48 49 50 51 52 53 54 55 56 57 58 59
Table 2: Shock states properties : Densities ρ, shock pressure P, particle velocities up
and shock front velocities us. Maximum error observed on shock front velocities is
around 10% for GCLT experimental data and 4% in molecular simulations. ρ(g.cm−3) P (GPa) up(m.s−1) us (m.s−1) 2.200 0 0 0 GCLT 2.274 1.81 164 5017 2.276 2.38 190 5694 2.282 2.63 207 5775 2.288 3.19 236 6144 2.315 3.47 275 5736 2.334 3.87 318 5532 2.350 4.15 348 5421 2.346 4.74 366 5887 2.356 5.61 411 6204 2.203 0 0 0 Hugoniostat 2.300 3.05 244 5918 CHIK 2.400 5.63 460 6016 2.500 6.71 603 5654 2.203 0 0 0 NEMD 2.249 1.35 100 6228 CHIK 2.272 2.07 150 6272 2.290 2.73 200 6396 2.332 3.94 300 6262 2.380 5.09 400 6176 2.433 6.12 500 6056 2.500 7.07 600 5949 2.675 8.71 800 5742 2.260 0 0 0 NEMD 2.280 1.39 100 6250 BKS 2.329 2.62 200 5996 2.380 3.81 300 5919 2.449 4.89 400 5809 2.533 5.56 500 5420 2.686 6.23 600 5194 3 4 5 6 7 8 9 10 11 12 13 14 15 16 17 18 19 20 21 22 23 24 25 26 27 28 29 30 31 32 33 34 35 36 37 38 39 40 41 42 43 44 45 46 47 48 49 50 51 52 53 54 55 56 57 58
tions. Experimental space and time scales are far beyond the scales of molecular dynamics simulations. Discrepancies between numerical and experimental works is not a surprise especially on complex dynamic processes. In addition, molecular dynamics simulations relies heavily on the potential. Complex reactive potentials may provide more accurate results, however, such work were never carried out to our knowledge.
In order to sum up, considering the experimental error estimated around 10%, the pressures and densities provided by molecular simulations are in a very good agreement with experiments. Despite the discrepancy on the shock front velocities, NEMD simula-tions and the Hugoniostat method are able to reproduce the shocked states of silica in the elastic regime and to some extent the non-linear behavior (ramp and decaying waves) of glassy systems. The CHIK model especially gives a fair description of the amorphous silica behavior with pressure, as already observed by Horbach25 with liquid silica under isotropic compression. In the following, we chose to investigate the structural properties using the CHIK potential only.
Structural Properties
One of the main advantage of molecular dynamics simulation remains in the high level of detail on the microscopic structure. In silica glasses, the molecular structure presents a two-level organization. At short range (closest neighbors), oxygen atoms around silicon atoms tend to form tetrahedra at equilibrium. At medium range (two or three neighbors), the tetrahedra are linked all together to form rings with an average size of 6 tetrahedra per ring. The ring size will be in this work defined by the number of tetrahedra (or number of silicon atoms) in one ring. Additionally, a significant amount of free volume can also be observed inside a glass structure. Those cavities correspond to interstitial voids between rings created by defects (like dangling oxygen atoms for example). The tetrahedra, the ring statistic and the cavities distribution were analyzed to understand the overall behavior of silica glasses. In this section, the structure was extracted from 6 cases:
3 4 5 6 7 8 9 10 11 12 13 14 15 16 17 18 19 20 21 22 23 24 25 26 27 28 29 30 31 32 33 34 35 36 37 38 39 40 41 42 43 44 45 46 47 48 49 50 51 52 53 54 55 56 57 58 59
4 configurations obtained by NEMD (2.7, 5.1, 7.1 and 8.7 GPa), 1 configuration obtained with the Hugoniostat method (6.7 GPa) and the equilibrium configuration at rest (labeled 0 GPa). The properties were computed behind the shock front to analyze the structure of shocked states. We have checked that the structure after the material relaxation was identical to the equilibrium configuration, except of course for the 8.7 GPa shock, which is slightly above the HEL. In this latter case, the final density is 2.336 g.cm−3which is 6% higher than the initial density. The 8.7 GPa shock is shown only to illustrate the difference between the elastic and the densification regime. The mechanisms involved in the glass densification will be studied in a future work. Again, all results here were obtained with the CHIK potential.
The tetrahedral short-range structure was investigated by computing the radial dis-tribution function (RDF) of the Si-O pair and theOSiO angle distribution, respectively in\
Figure 8.a and Figure 8.b. The configurations studied here presents very similar results. The RDF shows a narrow peak around 1.62 Å which is on average the experimental Si-O distance38. The angle distribution has a maximum peak at 109◦ which is typical of a tetrahedral organization. The maximum value seems to slightly decrease with the pressure and the distribution becomes wider. However this effect is rather weak and it can be hardly seen as a real structural change. The Hugoniostat method yields very similar results and the tetrahedral organization is very well reproduced.
Using the Si-O RDF, a geometrical criterion of 2 Å has been defined to investigate the coordination number of silicon atoms. The results are gathered in Table 3. The equilibrium configuration is mainly composed of 4-coordinated silicon atoms (99.6%) with a very low amount of defects (few number of 3 and 5-coordinated silicon atoms). The coordination does not change with pressure until 6.1 GPa. The 7.1 GPa and 8.7 GPa systems exhibit an increasing number of 5-coordinating silicon atoms (hexahedra) with pressure. Several octahedra are also observed in the 8.7 GPa simulation. It is well known that the presence of hexahedra is strongly correlated with a change in silica glass overall behavior39 making
3 4 5 6 7 8 9 10 11 12 13 14 15 16 17 18 19 20 21 22 23 24 25 26 27 28 29 30 31 32 33 34 35 36 37 38 39 40 41 42 43 44 45 46 47 48 49 50 51 52 53 54 55 56 57 58
the material more ductile. It seems that an elastic compression below the HEL has a rather weak impact on the tetrahedral structure compared to a shock just above the HEL where a small amount of hexaedra and octahedra is observed.
Table 3: Evolution of silicon atoms coordination number (number of oxygen atoms around every silicon atoms) observed in the shocked state just behind the shock front.
Coordination Number Pressure (GPa) 3 4 5 6 0.0 GPa 0.14% 99.6% 0.26% 0.00% 2.0 GPa 0.12% 99.5% 0.38% 0.00% 2.7 GPa 0.04% 99.5% 0.46% 0.00% 3.9 GPa 0.17% 99.3% 0.53% 0.00% 5.1 GPa 0.04% 99.0% 0.96% 0.00% 6.1 GPa 0.04% 98.5% 1.46% 0.00% 7.1 GPa 1.78% 95.9% 2.32% 0.00% 8.7 GPa 0.01% 92.5% 7.39% 0.06%
To understand the medium-range structure changes the ring organization was inves-tigated. The algorithm developed by Franzblau was used to find the rings40. A ring is identified when the path linking several silicon atoms is minimal (i.e. no short cut inside the ring) as defined by the short-path criterion40. The rings organization is a characteristic feature of silica glasses. The 3- and 4-membered rings can also be observed by Raman spectroscopy as they are strongly correlated to two peaks, labeled D1 and D2, respectively 495 and 606 cm−1 41. Many works including numerical simulations have stated that the silica glass ring distribution presents a maximum of 30% for 6-membered rings assuming the quenching rate is small enough42. This is partly due to the fact that in crystalline phases (quartz, β-cristoballite), the structure is composed of 6-membered rings only. In amorphous phases, the equilibrium distribution is broader and ring size can range from 3- to 14-membered but the maximum for a size of 6 remains. The evolution of the ring distribution over pressure is shown in Figure 9.a. The size variation with pressure is depicted in Figure 9.b. The sizes above 10 were not plotted for clarity as they were all below 1% with very little fluctuations. The ring distribution presents little changes below
3 4 5 6 7 8 9 10 11 12 13 14 15 16 17 18 19 20 21 22 23 24 25 26 27 28 29 30 31 32 33 34 35 36 37 38 39 40 41 42 43 44 45 46 47 48 49 50 51 52 53 54 55 56 57 58 59
6.1 GPa. In this pressure range, the structures are very close to the initial equilibrium configuration and the size variations oscillate around±15%. The ring organization does not change much with the shock pressure. The largest fluctuations are observed for a ring size of 10. This is due to a higher statistical error as the number of 10-membered rings is very low in the sample (around 1%). The shocked states reached for 6.1, 7.1 and 8.7 GPa show a different trend. The small rings number (3-membered) increases with the shock pressure up to two times the number obtained in the equilibrium configuration. The larger rings number (8- to 10-membered rings) tend to decrease down to -30%. It seems that bigger rings collapse into smaller rings which is particularly clear in the 8.7 GPa case. The behavior is therefore different below and above the HEL. An elastic compression has little impact on the overall ring distribution. On the opposite, above the HEL, the shock loading induces a strong reorganization : the larger rings are collapsing to create smaller rings.
Another way to observe this ring shrinking behavior is to compute the RDF of the Si-Si pair and the inter-tetrahedral SiOSi angle, respectively shown in Figure 10.a and\
Figure 10.b. The RDF shows a progressive shift with increasing shock pressure. The magnitude of the second and third peaks, respectively observed around 4.8 Å and 7.2 Å, are identical, however the first peak magnitude tends to decrease slightly with pressure. The global structure does not change over pressure but the Si-Si distance is becoming smaller as the peaks are shifted toward lower distance values. This diminishing distance over pressure is linked to the ring collapsing mechanism. This phenomenon is also visible in the SiOSi angle distribution. As the shock pressure increases, the position of the\
maximum value is slightly shifted toward lower angles, from 145◦ down to 130◦, while the magnitude remains the same. In the 8.7 GPa system, the second peak around 100◦ is more pronounced than any other case. This particular angle is related to 3-membered rings which are increasing in number with the shock pressure as seen in Figure 9.b. While the tetrahedral organization remains unaffected by the shock pressure, an overall ring closing is observed and this effect increases with the shock pressure as indicated by
3 4 5 6 7 8 9 10 11 12 13 14 15 16 17 18 19 20 21 22 23 24 25 26 27 28 29 30 31 32 33 34 35 36 37 38 39 40 41 42 43 44 45 46 47 48 49 50 51 52 53 54 55 56 57 58
narrower angles and shorter Si-Si distances. Again, the results are very similar between the Hugoniostat method and the NEMD simulations proving that this method is able to reproduce correct shocked states for glass materials.
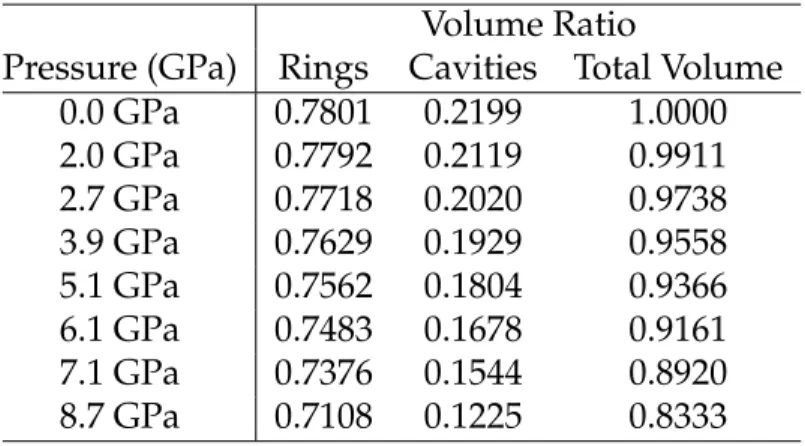
Finally, the free volume was investigated by dividing the system in voxels and checking whether these voxels were empty or not. A voxel is declared empty if no particle is present within a radius of 2.1 Å from the voxel center of mass. This geometric criterion is the Van Der Waals radius of a silicon atom and was already used to probe cavities in silica glass43,44. The cavity volume is therefore defined as the empty space around silicon atoms which are approximated as hard spheres. In order to probe only the space between rings, a virtual particle was added inside each ring to model the ring center of mass and to ensure that no empty voxel could be found inside a ring. We were therefore able to distinguish, for each configurations, the volume occupied by the rings from the free volume. In order to analyze the ring shrinking and the cavity closing effects, the values were normalized here by the total volume of the material at rest, P=0 GPa. Results are gathered in Table 4. The total volume variation over pressure is of course related to the densities variations obtained in the previous section. Interestingly, 22% of the equilibrium configuration is occupied by cavities and 78% by the rings. This important fraction of empty volume inside silica glass is supposed to be the reason why the densification process occurs. Behind the shock front, the volume occupied by both rings and cavities decreases with the shock pressure. The volume variation is more important for the cavities. For example at 8.7 GPa, nearly half of the cavities were closed by the shock compression whereas the ring shrinking represents only 10% of the volume reduction. A shock compression induces two mechanisms : a ring shrinking and a cavity closing, with an effect more pronounced for the free volume closing mechanism.
After the material relaxation, the final volume occupation is identical to the equilibrium configuration in all elastic cases. In the system undergoing a 8.7 GPa shock loading, a residual densification is observed. The final volume after relaxation is 6% smaller and is
3 4 5 6 7 8 9 10 11 12 13 14 15 16 17 18 19 20 21 22 23 24 25 26 27 28 29 30 31 32 33 34 35 36 37 38 39 40 41 42 43 44 45 46 47 48 49 50 51 52 53 54 55 56 57 58 59
entirely due to a cavity closing. The rings occupy the same volume as before the shock. It seems the densification process is strongly correlated with a permanently cavity closing mechanism inside the structure. Higher shock pressures will be studied to analyze in detail the densification in a future work.
Table 4: Rings and cavities volumes inside the glass structure observed in the shocked state just behind the shock front.
Volume Ratio
Pressure (GPa) Rings Cavities Total Volume 0.0 GPa 0.7801 0.2199 1.0000 2.0 GPa 0.7792 0.2119 0.9911 2.7 GPa 0.7718 0.2020 0.9738 3.9 GPa 0.7629 0.1929 0.9558 5.1 GPa 0.7562 0.1804 0.9366 6.1 GPa 0.7483 0.1678 0.9161 7.1 GPa 0.7376 0.1544 0.8920 8.7 GPa 0.7108 0.1225 0.8333
Conclusion
In this work, experimental and numerical studies were combined to improve the under-standing of the silica glass behavior under elastic shock compression. The elastic regime was investigated by laser-driven shocks up to 5 GPa and by molecular dynamics simula-tions up to 8.7 GPa. Direct shocks induced by a mobile wall and a Hugoniostat method were used to reach silica shocked states. In our simulations, two pair potentials, the BKS and the CHIK models, were tested. Fused silica exhibits nonlinear properties and NEMD simulations are able to reproduce the particular behavior (ramp waves and decaying wave propagation) under elastic shocks. The Hugoniot curves obtained with the CHIK potential were in a very good agreement with the experimental curves. In the opposite, the BKS potential fails to reproduce the shocked states of amorphous silica. Surprisingly, the CHIK potential is able to give a very good description of the shocked states in spite of its simplicity. 3 4 5 6 7 8 9 10 11 12 13 14 15 16 17 18 19 20 21 22 23 24 25 26 27 28 29 30 31 32 33 34 35 36 37 38 39 40 41 42 43 44 45 46 47 48 49 50 51 52 53 54 55 56 57 58
Several important conclusions may be drawn from the evolution of the glass structure in the elastic regime. First, the tetrahedral and the ring structure (i.e. bonds, coordination and angles) remains unaffected during the shock. Second, the interstitial voids present in the silica glass structure is strongly impacted by the elastic shock. The free volume is closing down with the increasing shock pressure. It is therefore concluded that the elastic behavior of silica glass is highly correlated with the interstitial voids initially present inside the structure. In addition, no significant differences were observed between the Hugoniostat method and the non-equilibrium approach. The two methods are equivalent and the final structures are identical within the pressure range tested here. The Hugoniostat method is able to reproduce the shocked states of glasses and is therefore an interesting alternative to NEMD simulations with a very low computational cost.
One simulation was also carried out just above the HEL to compare the elastic and densification regime. The tetrahedral structure is impacted and a significant amount of hexahedra and octahedra is observed. Regarding the rings distribution, the largest rings are broken into smaller ones. Above the HEL, the silica sample experiences deep structure modifications and the analysis of the relaxed states has shown a permanent densification after shock release related to a cavity closing mechanism. This phenomenon will be thoroughly studied in a future work.
Acknowledgment
The authors are grateful to the French Agence Nationale de la Recherche for its financial support through the program GLASS.
References
(1) Wackerle, J. ShockWave Compression of Quartz. J. Appl. Phys. 1962, 33, 922–937.
3 4 5 6 7 8 9 10 11 12 13 14 15 16 17 18 19 20 21 22 23 24 25 26 27 28 29 30 31 32 33 34 35 36 37 38 39 40 41 42 43 44 45 46 47 48 49 50 51 52 53 54 55 56 57 58 59
(2) Barker, L. M.; Hollenbach, R. E. Shock Wave Studies of PMMA, Fused Silica, and Sapphire. J. Appl. Phys. 1970, 41, 4208–4226.
(3) Marsh, S. P. LASL Shock Hugoniot Data; Univ of California Press, 1980; Vol. 5.
(4) Chhabildas, L.; Grady, D. In Shock Waves in Condensed Matter 1983; ASAY, J., GRA-HAM, R., STRAUB, G., Eds.; Elsevier: Amsterdam, 1984; pp 175 – 178.
(5) Alexander, C. S.; Chhabildas, L. C.; Reinhart, W. D.; Templeton, D. W. Changes to the Shock Response of Fused Quartz Due to Glass Modification. Int. J. Impact Eng. 2008, 35, 1376–1385.
(6) Kubota, A.; Caturla, M.-J.; Davila, L.; Stolken, J.; Sadigh, B.; Quong, A.; Rubenchik, A. M.; Feit, M. D. Structural Modifications in Fused Silica due to Laser-damage-induced Shock Compression. Proc. SPIE 2002, 4679, 108–116.
(7) Dávila, L. P.; Caturla, M.-J.; Kubota, A.; Sadigh, B.; de la Rubia, T. D.; Shackelford, J. F.; Risbud, S. H.; Garofalini, S. H. Transformations in the Medium-range Order of Fused Silica under High Pressure. Phys. Rev. Lett. 2003, 91, 205501.
(8) Su, R.; Xiang, M.; Chen, J.; Jiang, S.; Wei, H. Molecular Dynamics Simulation of Shock Induced Ejection on Fused Silica Surface. J. Appl. Phys. 2014, 115, 193508.
(9) Wang, J.; Rajendran, A.; Dongare, A. Atomic Scale Modeling of Shock Response of Fused Silica and α-Quartz. J. Mater. Sci. 2015, 50, 8128–8141.
(10) Izvekov, S.; Rice, B. M. Mechanism of Densification in Silica Glass under Pressure as revealed by a Bottom-up Pairwise Effective Interaction Model. J. Chem. Phys. 2012, 136, 134508.
(11) Erpenbeck, J. J. Molecular Dynamics of Detonation. I. Equation of state and Hugoniot Curve for a Simple Reactive Fluid. Phys. Rev. A 1992, 46, 6406–6416.
3 4 5 6 7 8 9 10 11 12 13 14 15 16 17 18 19 20 21 22 23 24 25 26 27 28 29 30 31 32 33 34 35 36 37 38 39 40 41 42 43 44 45 46 47 48 49 50 51 52 53 54 55 56 57 58
(12) Barmes, F.; Soulard, L.; Mareschal, M. Molecular Dynamics of Shock-wave Induced Structural Changes in Silica Glasses. Phys. Rev. B 2006, 73, 224108.
(13) Maillet, J.-B.; Stoltz, G. Sampling Constraints in Average: The Example of Hugoniot Curves. Appl. Math. Res. Express 2008, abn004.
(14) Ecault, R.; Berthe, L.; Boustie, M.; Touchard, F.; Lescoute, E.; Sollier, A.; Mercier, P.; Benier, J. Observation of the Shock Wave Propagation Induced by a High-Power Laser Irradiation into an Epoxy Material. J. Phys. D: Appl. Phys. 2013, 46, 235501.
(15) Loison, D.; Guin, J. P.; Sangleboeuf, J. C.; Nivard, M.; Lescoute, E.; Sollier, A.; Berthe, L.; Boustie, M. Soda-lime Glass Behavior under Laser Shock. APS Shock Compression of Condensed Matter Meeting Abstracts. 2015; p 6005.
(16) Barker, L. M. The Development of the VISAR, and its use in Shock Compression Science. Shock Compression of Condensed Matter-1999. 2000; pp 11–18.
(17) de Rességuier, T.; Cottet, F. Experimental and Numerical Study of Laser Induced Spallation in Glass. J. Appl. Phys. 1995, 77, 3756–3761.
(18) van Beest, B. W. H.; Kramer, G. J.; van Santen, R. A. Force Fields for Silicas and Aluminophosphates based on ab initio Calculations. Phys. Rev. Lett. 1990, 64, 1955– 1958.
(19) Carré, A.; Horbach, J.; Ispas, S.; Kob, W. New Fitting Scheme to Obtain Effective Potential from Car-Parrinello Molecular-Dynamics Simulations: Application to Silica. Europhys. Lett. 2008, 82, 17001.
(20) Car, R.; Parrinello, M. Unified Approach for Molecular Dynamics and Density-Functional Theory. Phys. Rev. Lett. 1985, 55, 2471–2474.
(21) Cowen, B. J.; El-Genk, M. S. On Force Fields for Molecular Dynamics Simulations of Crystalline Silica. Comput. Mater. Sci. 2015, 107, 88–101.
3 4 5 6 7 8 9 10 11 12 13 14 15 16 17 18 19 20 21 22 23 24 25 26 27 28 29 30 31 32 33 34 35 36 37 38 39 40 41 42 43 44 45 46 47 48 49 50 51 52 53 54 55 56 57 58 59
(22) Soules, T. F.; Gilmer, G. H.; Matthews, M. J.; Stolken, J. S.; Feit, M. D. Silica Molecular Dynamic Force Fields—A Practical Assessment. J. Non-Cryst. Solids 2011, 357, 1564 – 1573.
(23) Takada, A.; Richet, P.; Catlow, C.; Price, G. Molecular Dynamics Simulations of Vitreous Silica Structures. J. Non-Cryst. Solids 2004, 345–346, 224 – 229.
(24) Carré, A.; Ispas, S.; Horbach, J.; Kob, W. Developing Empirical Potentials from ab initio Simulations: The case of Amorphous Silica. Comput. Mater. Sci. 2016, 124, 323–334.
(25) Horbach, J. Molecular Dynamics Computer Simulation of Amorphous Silica under High Pressure. J. Phys.: Condens. Matter 2008, 20, 244118.
(26) Ewald, P. P. Die Berechnung Optischer und Elektrostatischer Gitterpotentiale. Ann. Phys. 1921, 369, 253–287.
(27) Wolf, D.; Keblinski, P.; Phillpot, S. R.; Eggebrecht, J. Exact Method for the Simulation of Coulombic systems by Spherically Truncated, Pairwise r−1 Summation. J. Chem. Phys. 1999, 110, 8254–8282.
(28) Carré, A.; Berthier, L.; Horbach, J.; Ispas, S.; Kob, W. Amorphous Silica Modeled with Truncated and Screened Coulomb Interactions: A Molecular Dynamics Simulation Study. J. Chem. Phys. 2007, 127, 114512.
(29) Vollmayr, K.; Kob, W.; Binder, K. Cooling-rate Effects in Amorphous Silica: A Computer-simulation Study. Phys. Rev. B 1996, 54, 15808–15827.
(30) Gedeon, O. Molecular Dynamics of Vitreous Silica — Variations in Potentials and Simulation Regimes. J. Non-Cryst. Solids 2015, 426, 103–109.
(31) Grest, G. S.; Kremer, K. Molecular Dynamics Simulation for Polymers in the presence of a Heat Bath. Phys. Rev. A 1986, 33, 3628–3631.
3 4 5 6 7 8 9 10 11 12 13 14 15 16 17 18 19 20 21 22 23 24 25 26 27 28 29 30 31 32 33 34 35 36 37 38 39 40 41 42 43 44 45 46 47 48 49 50 51 52 53 54 55 56 57 58
(32) Melchionna, S.; Ciccotti, G.; Holian, B. L. Hoover NPT Dynamics for Systems varying in Shape and Size. Mol. Phys. 1993, 78, 533–544.
(33) Bidault, X.; Chaussedent, S.; Blanc, W.; Neuville, D. R. Deformation of Silica Glass stud-ied by Molecular Dynamics: Structural Origin of the Anisotropy and non-Newtonian Behavior. J. Non-Cryst. Solids 2016, 433, 38–44.
(34) Davis, M. J. Laser-Shock-Induced Spall and the Intrinsic Strength of Glass. Int. J. Appl. Glass Sci. 2016, 7, 364–373.
(35) Wang, J.; Weaver, R. L.; Sottos, N. R. Laser-induced Decompression Shock Develop-ment in Fused Silica. J. Appl. Phys. 2003, 93, 9529–9536.
(36) Luo, S.-N.; Han, L.-B.; Xie, Y.; An, Q.; Zheng, L.; Xia, K. The Relation Between Shock-state Particle Velocity and Free Surface Velocity: A Molecular Dynamics Study on Single Crystal Cu and Silica Glass. J. Appl. Phys. 2008, 103, 093530.
(37) Sugiura, H.; Kondo, K.; Sawaoka, A. Dynamic Response of Fused Quartz in the Permanent Densification Region. J. Appl. Phys. 1981, 52, 3375–3382.
(38) Chagarov, E.; Adams, J. B.; Kieffer, J. Application of Design of Experiments Method-ology to Optimization of Classical Molecular Dynamics Generation of Amorphous SiO2Structure. Model. Simul. Mater. Sci. Eng. 2004, 12, 337.
(39) Benmore, C. J.; Soignard, E.; Amin, S. A.; Guthrie, M.; Shastri, S. D.; Lee, P. L.; Yarger, J. L. Structural and Topological Changes in Silica Glass at Pressure. Phys. Rev. B 2010, 81, 054105.
(40) Franzblau, D. S. Computation of Ring Statistics for Network Models of Solids. Phys. Rev. B 1991, 44, 4925–4930.
(41) Umari, P.; Pasquarello, A. First-principles Analysis of the Raman Spectrum of Vitreous
3 4 5 6 7 8 9 10 11 12 13 14 15 16 17 18 19 20 21 22 23 24 25 26 27 28 29 30 31 32 33 34 35 36 37 38 39 40 41 42 43 44 45 46 47 48 49 50 51 52 53 54 55 56 57 58 59
Silica: Comparison with the Vibrational Density of States. J. Phys.: Condens. Matter
2003, 15, S1547.
(42) Rahmani, A.; Benoit, M.; Benoit, C. Signature of Small Rings in the Raman Spectra of Normal and Compressed Amorphous Silica: A Combined Classical and ab initio Study. Phys. Rev. B 2003, 68, 184202.
(43) Chan, S. L.; Elliott, S. R. Theoretical study of the Interstice Statistics of the Oxygen Sublattice in Vitreous SiO2. Phys. Rev. B 1991, 43, 4423–4432.
(44) Malavasi, G.; Menziani, M. C.; Pedone, A.; Segre, U. Void Size Distribution in MD-modelled Silica Glass Structures. J. Non-Cryst. Solids 2006, 352, 285 – 296.
3 4 5 6 7 8 9 10 11 12 13 14 15 16 17 18 19 20 21 22 23 24 25 26 27 28 29 30 31 32 33 34 35 36 37 38 39 40 41 42 43 44 45 46 47 48 49 50 51 52 53 54 55 56 57 58
Figure 1: Experimental setup of the GCLT laser and its instrumentations. 3 4 5 6 7 8 9 10 11 12 13 14 15 16 17 18 19 20 21 22 23 24 25 26 27 28 29 30 31 32 33 34 35 36 37 38 39 40 41 42 43 44 45 46 47 48 49 50 51 52 53 54 55 56 57 58 59
Figure 2: Transverse shadowgraphs images for an irradiation of 123.7 GW.cm−2intensity and 10 ns pulse duration on a 2 mm thick silica glass sample captured at 0 ns (before laser shot), 25 ns and 75 ns after the beginning of the laser-matter interaction respectively. Shock waves propagates from left to right. Shock wave velocities are extracted from the small region depicted by the zoom area.
3 4 5 6 7 8 9 10 11 12 13 14 15 16 17 18 19 20 21 22 23 24 25 26 27 28 29 30 31 32 33 34 35 36 37 38 39 40 41 42 43 44 45 46 47 48 49 50 51 52 53 54 55 56 57 58
Figure 3: Modified CHIK potential for pair interactions. Dotted lines represents the original Buckingham potential19 diverging for low distances. In this work, these interactions were corrected with a two-order polynomial.
3 4 5 6 7 8 9 10 11 12 13 14 15 16 17 18 19 20 21 22 23 24 25 26 27 28 29 30 31 32 33 34 35 36 37 38 39 40 41 42 43 44 45 46 47 48 49 50 51 52 53 54 55 56 57 58 59
Figure 4: Illustration of the glass material under shock loading. A 1D shock is generated by affecting a high initial velocity up0to the system and throwing it toward an immobile
wall. Particle colors depend on their velocities : blue particles have low velocities, red particles have a high velocity. The shock front is propagating with a velocity us.
3 4 5 6 7 8 9 10 11 12 13 14 15 16 17 18 19 20 21 22 23 24 25 26 27 28 29 30 31 32 33 34 35 36 37 38 39 40 41 42 43 44 45 46 47 48 49 50 51 52 53 54 55 56 57 58
Figure 5: Velocity measurement of the Al/SiO2 target interface irradiated by a
123.7 GW.cm−2intensity and 10 ns duration laser shot.
3 4 5 6 7 8 9 10 11 12 13 14 15 16 17 18 19 20 21 22 23 24 25 26 27 28 29 30 31 32 33 34 35 36 37 38 39 40 41 42 43 44 45 46 47 48 49 50 51 52 53 54 55 56 57 58 59
Figure 6: Simulated particle velocity inside the material at different times. Velocities were extracted from NEMD simulations with the CHIK potential. a) Below 3 GPa (here 2.07 GPa), a ramp front is observed. The ramp propagates at a constant velocity (6272 m/s) and does not decay over time. b) Above 3GPa (here 7.01 GPa), a decaying shock front is obtained. The shock front becomes wider over time. At t=35 ps the front is nearly 300 nm wide. 3 4 5 6 7 8 9 10 11 12 13 14 15 16 17 18 19 20 21 22 23 24 25 26 27 28 29 30 31 32 33 34 35 36 37 38 39 40 41 42 43 44 45 46 47 48 49 50 51 52 53 54 55 56 57 58
Figure 7: Comparison between experimental1,5 and MD silica glass Hugoniot curves. a) Shock pressure as function of particle velocity. b) Shock pressure as function of density. Experimental (GCLT) error on shock pressure is around 10%. Error estimated in molecular simulations (not shown for clarity) is below 4%.
3 4 5 6 7 8 9 10 11 12 13 14 15 16 17 18 19 20 21 22 23 24 25 26 27 28 29 30 31 32 33 34 35 36 37 38 39 40 41 42 43 44 45 46 47 48 49 50 51 52 53 54 55 56 57 58 59
Figure 8: Evolution of the tetrahedral properties with the shock pressure. a) Radial distribution function (RDF) of the Si-O pair. b) Intra-tetrahedralOSiO Angle distribution.[
Properties are calculated just behind the shock front.
3 4 5 6 7 8 9 10 11 12 13 14 15 16 17 18 19 20 21 22 23 24 25 26 27 28 29 30 31 32 33 34 35 36 37 38 39 40 41 42 43 44 45 46 47 48 49 50 51 52 53 54 55 56 57 58
Figure 9: Ring statistics properties. a) Ring size as function of the shock pressure. b) Distribution variations with pressure. Properties are calculated just behind the shock front.
3 4 5 6 7 8 9 10 11 12 13 14 15 16 17 18 19 20 21 22 23 24 25 26 27 28 29 30 31 32 33 34 35 36 37 38 39 40 41 42 43 44 45 46 47 48 49 50 51 52 53 54 55 56 57 58 59
Figure 10: Ring properties evolution as function of the shock pressure. a) Radial dis-tribution function (RDF) of the Si-Si pair. b) Inter-tetrahedral SiOSi Angle distribution.[
Properties are calculated just behind the shock front.
3 4 5 6 7 8 9 10 11 12 13 14 15 16 17 18 19 20 21 22 23 24 25 26 27 28 29 30 31 32 33 34 35 36 37 38 39 40 41 42 43 44 45 46 47 48 49 50 51 52 53 54 55 56 57 58
ACS Paragon Plus Environment 3 4 5 6 7 8 9 10 11 12 13 14 15 16 17 18 19 20 21 22 23 24 25 26 27 28 29 30 31 32 33 34 35 36 37 38 39 40 41 42 43 44 45 46 47 48 49 50 51 52 53 54 55 56 57
ACS Paragon Plus Environment 3 4 5 6 7 8 9 10 11 12 13 14 15 16 17 18 19 20 21 22 23 24 25 26 27 28 29 30 31 32 33 34 35 36 37 38 39 40 41 42 43 44 45 46 47 48 49 50 51 52 53 54 55 56
ACS Paragon Plus Environment 3 4 5 6 7 8 9 10 11 12 13 14 15 16 17 18 19 20 21 22 23 24 25 26 27 28 29 30 31 32 33 34 35 36 37 38 39 40 41 42 43 44 45 46 47 48 49 50 51 52 53 54 55 56 57
81x43mm (144 x 144 DPI) 3 4 5 6 7 8 9 10 11 12 13 14 15 16 17 18 19 20 21 22 23 24 25 26 27 28 29 30 31 32 33 34 35 36 37 38 39 40 41 42 43 44 45 46 47 48 49 50 51 52 53 54 55 56 57 58