HAL Id: tel-01499555
https://tel.archives-ouvertes.fr/tel-01499555
Submitted on 31 Mar 2017
HAL is a multi-disciplinary open access
archive for the deposit and dissemination of sci-entific research documents, whether they are
pub-L’archive ouverte pluridisciplinaire HAL, est destinée au dépôt et à la diffusion de documents scientifiques de niveau recherche, publiés ou non,
Claire Panciatici
To cite this version:
Claire Panciatici. DNA replication in budding yeast : link between chromatin conformation and kinetics of replication. Subcellular Processes [q-bio.SC]. Université Paris Saclay (COmUE), 2016. English. �NNT : 2016SACLS473�. �tel-01499555�
NNT : 2016SACLS473
T
HESE DE DOCTORAT
DE
L’U
NIVERSITE
P
ARIS
-S
ACLAY
PREPAREE A
L’U
NIVERSITE
P
ARIS
-S
UD
Service de Biologie Intégrative et Génétique Moléculaire (SBIGeM), CEA
E
COLED
OCTORALE N°577
Structure et dynamique des systèmes vivants Spécialité : Sciences de la Vie et de la Santé (SDSV)
Par
Mlle Claire PANCIATICI
DNA replication in budding yeast: Link between chromatin
conformation and kinetics of replication
Thèse présentée et soutenue à Saclay, le 6 décembre 2016 : Composition du Jury :
M. BLOYER, Sébastien Professeur, Université Paris Sud Président
M. LE TALLEC Benoit CR2, INSERM Rapporteur M. VICTOR Jean-Marc DR1, CNRS Rapporteur M. AUDIT Benjamin DR2, CNRS Examinateur
M. GILBERT Nick Professeur, Université d’Edimburgh Examinateur
M. PEREZ Javier Responsable ligne, Soleil Co-encadrant M. GOLDAR Arach Ingénieur, CEA Directeur de thèse Financée par LLB/Soleil et IDEX
Tout d’abord, je remercie Arach Goldar pour m’avoir donné l’opportunité de tra-vailler sur ce projet et ses relectures du manuscrit. Merci aussi à Didier Lairez pour m’avoir permis de travailler sur PACE, aidé grandement dans mon apprentissage de matlab et donné l’exemple d’un esprit critique scientifique. Merci à Javier Perez pour son temps passé avec moi sur SWING et la relecture attentive de mon ma-nuscrit. Je remercie aussi toute l’équipe de SWING pour leur bonne humeur et leur accueil chaleureux, malgré mes visites en pointillé.
Merci à tous les gens qui ont marqué mon quotidien au labo : Elodie et Gwen, mes ex-collègues de bureau et toute l’équipe de Julie Soutourina. Merci en parti-culier à Thomas qui m’a aidé à créer la souche MNase. Merci aussi à Christelle et Rosa qui, grâce à leur travail, rendent la vie au labo plus facile. Enfin un grand merci à Bénédicte. Tu as été présente tout au long de ma thèse et tes conseils d’experte (de la levure comme des hommes) ont été un précieux soutien.
Merci à Vincent et à mes amis qui ont su ponctuer ces années de convivialité. Enfin, comment faire le bilan de ces trois ans sans penser à toi Diane. J’essaye de m’inspirer de ta force et de me conformer à les haute idée que tu avais de moi.
Genetic information carried in the cell nucleus must be faithfully duplicated to be transmitted to daughter cells during cell division. In order to orchestrate their division, cells go through a reproducible 4 stages cycle called «cell cycle». The preparation and execution of the DNA replication program is restricted to specific phases and implies many proteic and structural regulators. In particular, DNA replication occurs on a complex template of DNA associated with proteins. The latter is both influencing and influenced by DNA replication. This work aims at investigating the link between chromatin conformation and the kinetics of DNA replication. In order to do so, we combine several techniques.
Using flow cytometry, we follow the evolution of a cell population with regards to their DNA content. This drives us to develop a methodology that deciphers the population averaged temporal program of DNA replication from a simple FACS histogram of an exponentially growing cell population. By analysing the cell cycle of 3 Saccharomyces cerevisiae mutants, where the regulation of Ribonucleotide reductase is challenged, we show that the replication origin firing is slowed down if the speed of DNA synthesis (v) is increased. This observation leads us to predict that cell control mechanisms (checkpoints) are not activated if v0
4 < v < v0 where
v0 is the speed of replicative helicases.
Combining small-angle scattering of neutrons (SANS) and X-rays (SAXS), we show that the large-scale chromatin conformation cannot be directly assessed from SANS data but that SAXS data provide information on the local organisation of protein and DNA in vivo. Our data can be interpreted as a liquid crystal with a nematic order and a short correlation length, which suggests that yeast chromatin
in vivo is predominantly devoid of 30 nm fibres organisation. In this prospect,
chromatin inside the nucleus in vivo could be organised as 10nm fibres distant of 25 to 30nm. This distance, which is constant during DNA replication, is mainly imposed by the physico-chemical properties of the yeast nucleus. During interphase however, the correlation length is rising which indicates an increasing organisation of the chromatin before division.
On the other hand, we performed DNA combing to study the replication pro-gram in single cells. We reproduce previously obtained result showing that distance
between replicated tracks is of ~60kb which corresponds to the distance between known origins of replication. However, studying the behaviour of initiation, we propose that the initiation events are more frequent than previously measured and correspond to distances between MCMs proteins loaded on the genome.
de boulanger : lien entre la
conformation de la chromatine et la
cinétique de réplication
L’information génétique contenue dans le noyau de la cellule doit être dupliquée fidèlement afin d’être transmise aux cellules filles pendant la division cellulaire. Pour organiser leur division, les cellules suivent un cycle reproductible composé de quatre étapes appelé cycle cellulaire. La préparation et l’exécution du programme de réplication de l’ADN ont lieu pendant des phases spécifiques du cycle grâce à l’intervention de multiples partenaires protéiques et de régulateurs structuraux. En particulier, la réplication de l’ADN s’effectue sur une matrice complexe constituée d’ADN associé à des protéines appelée chromatine. Cette dernière influence et est influencée par la réplication de l’ADN. Le travail présenté ici a pour objectif de faire le lien entre la conformation de la chromatine et la cinétique de réplication de l’ADN. Pour ce faire, nous combinons plusieurs techniques.
La cytométrie de flux nous permet de suivre la quantité d’ADN présent dans une population de cellules. Ceci nous a conduit à développer une méthode pour extraire le programme de réplication moyen de la population de cellules à partir de l’histogramme de FACS d’une population de cellules en croissance exponentielle. L’analyse du cycle cellulaire de trois mutants de la levure Saccharomyces Cerevisiae dans lesquels la régulation de la ribonucleotide réductase est alterée, montre que le déclenchement des origines de réplication est ralenti si la vitesse de synthèse de l’ADN (v) augmente. Cette observation nous conduit à prédire que les mécanismes de contrôle du cycle cellulaire (checkpoints) ne sont pas activés si v0
4 < v < v0 où
v0 est la vitesse des hélicases.
En combinant les techniques de diffusion aux petits angles des neutrons (SANS) et rayons X (SAXS), nous montrons que la conformation de la chromatine à grande échelle ne peut pas être établie directement par des mesures de SANS. En revanche les données de SAXS fournissent des informations sur l’organisation locale des protéines et de l’ADN in vivo. Nos données peuvent être interprétées comme un cristal liquide avec un ordre nématique et une faible longueur de corrélation, ce qui suggère que la chromatine de la levure est majoritairement dépourvue d’une organisation en fibre de 30nm in vivo. Dans cette perspective, la chromatine dans le noyau serait organisée en fibres de 10nm distantes de 25 à 30nm. Cette distance, constante au cours de la réplication de l’ADN, est principalement imposée par
les propriétés physico-chimiques du noyau de la levure. Au cours de l’interphase cependant, la longueur de corrélation augmente, ce qui indique une organisation de la chromatine de plus en plus structurée avant la division cellulaire.
Par ailleurs, nous avons réalisé une étude du programme de réplication en mo-lécules uniques grâce à la méthode de peignage d’ADN. Nous reproduisons les résultats précédemment obtenus montrant que la distance entre zones répliquées est d’environ ~60kb qui correspond à la distance entre des origines de réplication identifiées. Cependant, d’après l’étude du comportement dynamique de l’initiation, nous proposons que les initiations sont plus fréquentes que ce qui a été mesuré pré-cédemment et correspondent à la distance entre les protéines MCM disposées sur le génome.
Remerciements i
Abstract iii
Résumé vii
Contents ix
List of Figures xv
List of Tables xix
Nomenclature xix
Multiscale Signifiance of the Replication process
1
Introduction 3
1 Molecular mechanism of DNA replication 5
1.1 Replication of double-stranded DNA . . . 5
1.1.1 Double helix structure and DNA duplication . . . 5
1.1.2 Stepwise assembly of the replisome . . . 13
1.1.3 Conservation of DNA replication . . . 17
1.2 Replication of chromatin . . . 21
1.2.1 Nucleosome as the structural unit of chromatin . . . 21
1.2.2 Chromatin higher order organisation in vivo is still under debate . . . 24
2 4th dimension of DNA replication 31
2.1 Spatio-temporal program of DNA replication . . . 31
2.1.1 Replication profile . . . 31
2.1.2 From defined replication profiles to cell to cell variability . . 34
2.1.3 Simulations and mathematical models to interpret the rep-lication profiles . . . 36
2.2 Establishment and execution of the temporal program . . . 40
2.2.1 Potential origins recruitment in a nuclear structured frame . 40 2.2.2 Stochastic execution . . . 42
2.2.3 Influence of transcription and chromatin landscape . . . 44
2.3 Conservation and significance of the timing . . . 47
2.3.1 Conservation of the replication program . . . 47
2.3.2 Protection of genomic integrity . . . 49
2.3.3 Transcription, epigenetic state and replication : causes and consequences . . . 50
3 Replication in the yeast nucleus 55 3.1 Organisation of the yeast interphase nucleus . . . 55
3.1.1 Rabl structure . . . 55
3.1.2 Nuclear domains . . . 60
3.1.3 Nucleosome organisation . . . 63
3.2 Replication in the interphase nucleus . . . 65
3.2.1 Subnuclear organisation of timing . . . 65
3.2.2 Chromatin contacts and replication factories . . . 66
3.3 Several techniques gave insight on the 3D chromatin organisation and dynamic . . . 68
3.3.1 Usual techniques to study genome organisation . . . 68
3.3.2 Small-angle scattering . . . 70
Material and Methods
77
4 Yeast strains and cell cycle 79 4.1 Strains . . . 794.1.1 Yeast strains used . . . 79
4.1.1.1 BY4741 . . . 79 4.1.1.2 MCM869 . . . 79 4.1.1.3 BYMNase . . . 80 4.1.2 Growth . . . 85 4.1.2.1 Growth conditions . . . 85 4.1.2.2 Thymidine analogs . . . 86
4.1.3 Synchronisation . . . 87 4.1.3.1 –-factor . . . 87 4.1.3.2 Nocodazole . . . 87 4.2 FACS . . . 88 4.2.1 Sample preparation . . . 88 4.2.2 Data acquisition . . . 89 4.2.2.1 Device settings . . . 89 4.2.2.2 Acquisition . . . 89 4.2.2.3 Data reading . . . 89 4.2.3 Data analysis . . . 90 4.2.3.1 Normalisation . . . 90 4.2.3.2 Data fitting . . . 91 5 SAS 95 5.1 Sample preparation . . . 95 5.2 Device . . . 97 5.2.1 Neutrons . . . 97 5.2.2 X-Rays . . . 97 5.3 Data analysis . . . 98 6 DNA combing 101 6.1 DNA purification in plugs . . . 101
6.1.1 Cells sample . . . 101
6.1.2 Plugs preparation . . . 101
6.1.3 DNA purification . . . 102
6.2 DNA combing and staining . . . 102
6.2.1 Converslips cleaning and silanisation . . . 102
6.2.2 DNA combing . . . 103
6.2.3 BrdU and total DNA staining . . . 103
6.3 DNA acquisition and quatification . . . 103
6.3.1 Image acquisition and treatment . . . 103
6.3.2 Obtaining and correcting binary values . . . 105
6.3.3 Computation of replication parameters . . . 106
Results and Discussion
111
7 Evolution of cell cycle 113 7.1 Cell synchronisation . . . 1137.1.1 Cell cycle block . . . 113
7.2 Progression in S phase . . . 124
7.2.1 FACS profile contains information on three main populations of cells . . . 124
7.2.2 Average S phase progression of MCM869 cells . . . 126
7.2.3 Effect of growth conditions . . . 127
7.3 Deciphering the replication program from FACS data . . . 133
8 Using Small-Angle Scattering to study yeast nuclear organisation 145 8.1 Experimental conditions . . . 145
8.1.1 Sample preparation . . . 145
8.1.2 Radiation damages . . . 149
8.2 Data analysis . . . 152
8.2.1 Qualitative analysis . . . 152
8.2.2 Evolution with time . . . 155
8.2.3 Data fitting . . . 157
8.3 Origin of the signal . . . 160
8.3.1 SAXS and SANS comparison . . . 160
8.3.2 Link to replication . . . 163
8.3.3 MNase digestion . . . 168
9 Temporal and spatial replication program 171 9.1 Doing the spadework for DNA combing . . . 171
9.2 Kinetics of DNA replication . . . 174
9.2.1 Replication dynamic . . . 174
9.2.2 Origin distribution . . . 176
9.2.3 Timing . . . 180 Conclusions and perspectives 183
Annexes
191
A Evolution of the cell cycle - supplementary informations 193 B Yeast nuclear organisation - supplementary informations 195 C DNA combing - supplementary informations 201 D Replication time of an eye 203
Bibliography 205
1.1.1 From X-Ray Image to structure . . . 6
1.1.2 Unidirectionality of polymerases imposes discontinuous synthesis on the lagging strand . . . 8
1.1.3 helicase activity of the CMG complex . . . 9
1.1.4 Top1 release supercoiling induced by DNA replication . . . 10
1.1.5 Several secondary structures of DNA exist in vivo . . . 11
1.1.6 Replisome architecture . . . 12
1.1.7 Schematic view of the cell cycle . . . 13
1.1.8 Loading and firing of a replication origin . . . 15
1.1.9 Regulation of budding yeast cyclins during the cell cycle . . . 17
1.1.10 Replicon model . . . 18
1.1.11 The universal replication fork . . . 19
1.1.12 Distribution of DNA replication proteins across eukaryotic super-groups . . . 20
1.2.1 Nucleosome composition . . . 22
1.2.2 PTMs on histone tails . . . 23
1.2.3 Lexicon of nucleosome positioning . . . 23
1.2.4 Two models for chromatin fibre . . . 24
1.2.5 Loop extrusion model . . . 26
1.2.6 Histone reassembly after replication fork passage . . . 28
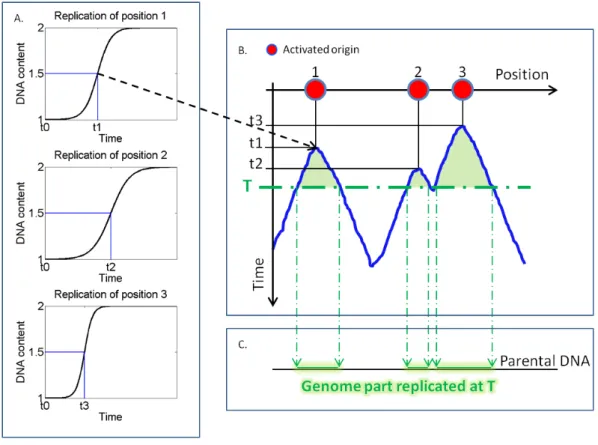
2.1.1 Construction of a replication profile . . . 32
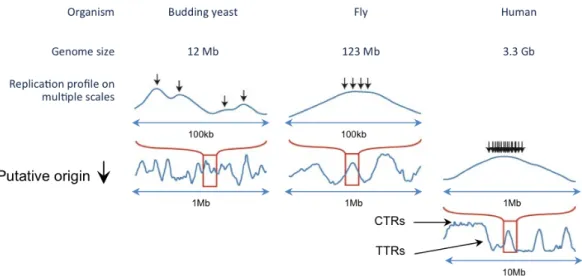
2.1.2 Replication profiles of several eukaryotes . . . 33
2.1.3 Identification of origins of replication by transition density of Okazaki fragments . . . 34
2.1.4 Average behaviour of single cells recapitulates the population be-haviour . . . 35
2.1.5 Identifiability . . . 36
2.1.6 Illustration of the domino-like initiation in human TTRs . . . 38
2.1.7 Abundance of potential origin as an explanation for inhomogenous efficiency . . . 38
2.2.1 Replication domains model . . . 42
2.2.2 Origin tethering organised by multiple proteic factors . . . 43
2.2.3 Collision between replication and transcription . . . 45
2.2.4 Model of replication and transcription co-directionality . . . 45
2.3.1 Similarity of the replication profiles of related species . . . 48
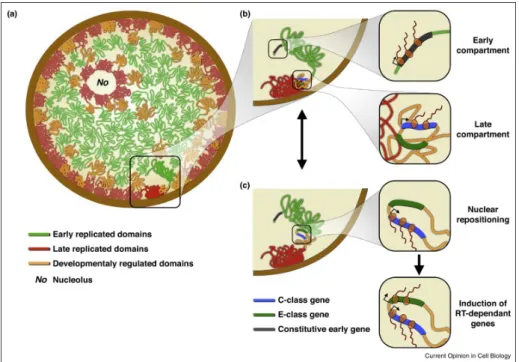
2.3.2 Different regulation of developmentally regulated and constitutive domains . . . 51
2.3.3 Model of multiple influences of genes expression, chromatin con-formation and replication timing . . . 52
3.1.1 Rabl configuration of yeast nucleus . . . 56
3.1.2 Computational models of yeast nucleus organisation . . . 58
3.1.3 Reorganisation of the chromatin structure in quiescence . . . 59
3.1.4 Chromatin contacts in yeast genome . . . 61
3.1.5 Genes clusters . . . 62
3.1.6 Contact between adjacent nucleosomes . . . 64
3.2.1 Organisation in replication factories . . . 67
3.3.1 Schematic methodology of 3C and derivative techniques . . . 69
3.3.2 Measure of scattering intensity . . . 71
3.3.3 Principle of contrast . . . 72
3.3.4 Compared SAXS signal from chicken or rabbit erythrocyte . . . . 73
3.3.5 SAXS signal from HeLa nuclei . . . 74
4.1.1 Plasmid pGZ136(pRS406-pREB1-3FLAG-MNase-NLS) and its in-tegration mode . . . 80
4.1.2 Western Blot of MNase protein . . . 82
4.1.3 1% agarose gel showing DNA digestion after MNase induction . . . 84
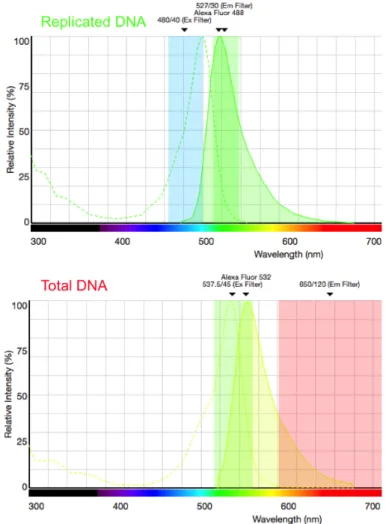
6.3.1 Fluorescence Spectra of fluorescent dyes used for DNA combing . . 104
6.3.2 ⁄-DNA stretching by DNA combing . . . 105
7.1.1 Schematic effect of mating pheromone . . . 114
7.1.2 Effect of –-factor on two yeast strains . . . 114
7.1.3 Nocodazole effect on BY4741 cell . . . 115
7.1.4 Effect of nocodazole treatment on MCM869 cells morphology . . . 116
7.1.5 DNA replication after nocodazole treatment on BY4741 cells . . . 118
7.1.6 Influence of nocodazole on DNA replication . . . 119
7.1.7 Blocking duration by –-factor in MCM869 cells influences the syn-chronisation in G1 . . . 120
7.1.8 Cell cycle after various duration of treatment by –-factor in MCM869 cells . . . 121
7.1.10 Evolution of replicated fraction during two S phases in BY4741
cells . . . 122
7.2.1 Fluorescence level to DNA content . . . 124
7.2.2 Fit of normalised FACS data . . . 125
7.2.3 High quality fit on averaged data allow to extract cycling cells behaviour . . . 126
7.2.4 Evolution of replicated fraction of cells growing in YPD or CASA 128 7.2.5 Thymidine and its analogs . . . 129
7.2.6 Effect of the variation of concentration of thymidine analog in YPD 130 7.2.7 Effect of the concentration of thymidine analog in CASA vs YPD 130 7.2.8 Incorporation of EdU in CASA vs YPD medium . . . 131
7.2.9 EdU incorporation during replication in YPD . . . 132
8.1.1 Schematic view of the stirrer . . . 146
8.1.2 Stability and evolution of yeast cells in SWING incubator . . . . 147
8.1.3 SAXS signal from MCM869 cells, spheroplasts and isolated nuclei 148 8.1.4 SAXS curves from yeast cells after successive expositions . . . 151
8.2.1 SAXS and SANS compared profiles from yeast and chicken eryth-rocytes . . . 154
8.2.2 Evolution of the SAXS peak with time after release from –-factor in pellet or liquid . . . 155
8.2.3 Global evolution of SAXS amplitude with time after release from –-factor in liquid samples . . . 156
8.3.1 Application of SAXS/SANS contrast difference to SANS fit curve 161 8.3.2 Peak amplitude in HU . . . 163
8.3.3 Correlation of peak area with replicated fraction . . . 164
8.3.4 Fit of the peak zone of the liquid sample SAXS curve . . . 166
8.3.5 DNA digestion by MNase after calcium induction . . . 168
8.3.6 Effect of DNA digestion by MNase on SAXS profiles . . . 169
9.1.1 Replicated fraction during combing experiment . . . 173
9.2.1 Replication parameters extracted from DNA combing . . . 175
9.2.2 Creation and merge of forks . . . 176
9.2.3 Eye-to-eye distance . . . 177
9.2.4 Biases impose minimum and maximum measurable ETED (Fig. ) 178 9.2.5 ACS and MCM distances distributions . . . 179
9.2.6 Probability of initiation linked to square MCM density . . . 181
A.1 Logarithmic state of MCM869 and BY4741 cells . . . 193
A.2 Logarithmic growth of BY4741 . . . 194 A.3 Goodness of the fit for FACS histograms and rreplicated fraction . 194
B.1 Cell, spheroplasts and nuclei normalised SAXS data . . . 196
B.2 Krakty plot of SANS data . . . 197
B.3 Maximum position converted into characteristic distances for all SAXS experiments . . . 198
B.4 SAXS and SANS curves of yeasts spheroplasts fit with the descri-bed models . . . 199
B.5 Goodness of the fit of the peak area in SAXS data . . . 200
B.6 F(t) of MCM869 and BY4741 cells . . . 200
C.1 Example of combed fibres . . . 202
1.1 Replication enzyme fidelity assessed by the frequency of single base substitution . . . 8 3.1 Parameters and constraint on the models . . . 58 4.1 Composition of buffers for in vivo DNA digestion by MNase enzyme 84 4.2 Composition of growth media . . . 85 5.1 Composition of buffers for spheroplasting . . . 96 5.2 Composition of buffers for nuclei isolation . . . 96 6.1 Architecture of the structure used to store information about DNA
combing . . . 107 8.1 SANS and SAXS density and contrast . . . 160
Å Ångströms
3C Chromatin conformation cpature
A Adenine
ACS ARS consensus sequence APC Anaphase promoting complex ARS Autonomously replicating sequence ASF1 Antisilencing function 1
bp Base pair
CAF-1 Chromatin assembly factor C Cytosine
cdc6 Cell division cycle 6 CDK Cyclin-dependent kinase
Cdt1 Chromatin licensing and DNA replication factor 1 CID Chromatin interaction domains
CMG Cdc45-MCM-GINS CTCF CCCTC-binding factor CTRs Constant timing regions DDK Dfb4-dependent kinase DNA Deoxyribonucleic Acid
dNTP Deoxyribonucleotids FEN1 Flap endonuclease 1
Fkh Forkhead transcription factor FPC Fork protection complex G4 G quadruplex
G Guanine
H1 Histone protein 1 HU Hydroxyurea
MCM Mini chromosome maintenance protein NAP1 Nucleosome assembly protein 1
NDR/NFR Nucleosome depleted/free regions NE Nuclear envelope
ODP Origin decision point ORC Origin-recognition complex PP1 Protein phosphatase 1 pre-RC Pre-replicative complex rDNA Ribosomal DNA
Rif1 Rap-interacting factor 1 RPA Replication protein A S.c Saccharomyces Cerevisiae S.p Schizosaccharomyces pombe SANS Small-angle neutron scattering SAXS Small-angle X-ray scattering
SPB Spindle pole body
TADs Topologically associated domains TDP Timing decision point
TSSs Transcription starting sites
T Thymine
information after cellular division. DNA is the molecular template of the genetic information and the process of its duplication is called replication.
The story of the DNA replication study started more than fifty years ago. The discovery of the DNA structure allowed to imagine the way it was duplicated, unlocked the comprehension of enzymes and rise many new questions. At many scales, DNA replication process is linked to the structure of the template and linear replication is undoubtedly organised by the double helix structure. DNA needs to undergoes several level of packing in order to fit of the nucleus. However, the hyper-structure of the chromatin is an obstacle for the propagation of replication forks and requires many proteic partners to be dealt with. Nucleosome positioning is of great importance for DNA replication and particularly for choosing the positions of initiation. Last, 3D organisation of the nucleus and subnuclear position of a DNA part is one of the main influent of its timing of replication. Replication is therefore a multi-scale process and the organisation of the template at several scale is significant to understand its proceeding. Moreover, as in eukaryotes DNA replication starts at different time in different points of the genome, time must be considered as the fourth dimension of the replication process.
We will see in a first part how experimental and conceptual discoveries gives us a clear picture on the molecular mechanism of double strand DNA and chromatin duplication. Next we will describe more in depth the spatio-temporal program of DNA replication. At last we will focus on the three-dimensional organisation of the genome of the budding yeast which will be our model organism to study the DNA replication process.
Molecular mechanism of DNA
replication
The replication of the genome is a delicate process, that needs to be tightly reg-ulated in order to guarantee its correct and total duplication before cell division. In addition, duplication occurs on a condensed template that is not directly ac-cessible. Indeed, the Deoxyribonucleic Acid (DNA) molecule is negatively charged and cannot be completely folded into itself spontaneously. Thus in order to fit inside the nucleus, it associates with proteins in a complex called chromatin.
This first chapter takes an historical point of view to describe how molecular actors that enable the DNA replication process where discovered. In the first part, all the components necessary for the polymerisation of DNA are introduced and the evolutionary conservation of these components in all eukaryotes is emphasised. Then the packing of DNA into chromatin is described in the second part as well as the preservation of this organisation during DNA replication.
1.1 Replication of double-stranded DNA
1.1.1 Double helix structure and DNA duplication
The resolution of the DNA structure triggered many discoveries. In particular, it raised questions that lead to the uncovering of major molecular actors of its duplication machinery.
Canonical form of DNA and semi-conservative replication
DNA is a polymer of nucleotides composed of a backbone of alternating sugar (deoxyribose) and phosphate groups. One of four possible nucleic bases : Adenine
(A), Thymine (T), Guanine (G) or Cytosine (C) is associated to each sugar. In 1951, Chargaff discovered the rules of base pairing based on their chemical struc-ture : two hydrogen bonds link A and T and three link G and C (Fig. 1.1.1 A.) (Chargaff 1989).Two strands of DNA are paired between complementary bases in an antiparallel manner and coil around a common axis. The structure of this double-stranded DNA was first published by James D. Watson and Francis Crick in 1953 (Watson and Crick 1953b) based on a X-Ray diffraction image of DNA (Fig. 1.1.1 B.) from Rosalind Franklin in 1952 (Gosling and Franklin 1953). The most common structure, called B-DNA, is 20 ångstroms (Å) wide and extends 34Å per 10bp (base pair) (Menderlkern et al. 1981) (Fig. 1.1.1 C.).
Figure 1.1.1: From X-Ray Image to structure
A. Nucleic bases are paired thanks to their chemical affinities. Adenine forms two hydrogens bonds with thymine while guanine forms three bonds with cytosine.
B. Photograph 51 is a famous image of diffraction from DNA published by R. Franklin team. (Gosling and Franklin 1953)
C. The most common structure adopted by DNA in vivo called B-DNA consists of two strands of DNA coiling around a common axis in an antiparallel manner.
Following their discovery, Watson and Crick commented on its genetic implic-ations (Watson and Crick 1953a). Indeed the presence of two complementary strands paired only by weak chemical bounds, suggests that they could be separ-ated to serve as template for duplication. In this hypothesis, each strand could be individually duplicated therefore half of the parent DNA molecule would be conserved in the daughter cell. Semi-conservative replication was later proven by Meselson and Stahl in 1958 (Meselson and Stahl 1958). In their experiment,
E.Coli bacteria were grown in medium containing heavy nitrogen and then
re-leased in medium containing normal nitrogen. DNA was isolated after one, two and three generations. Due to the difference of weight of nitrogen, double helix of heavy DNA, double helix of light DNA and composite double helix of light and heavy DNA can be separated by their density in a cesium chloride gradient. The experiment showed that after one generation most DNA is present as a double helix containing one parental strand and one newly synthesised strand confirming the semi-replicative hallmark of DNA replication.
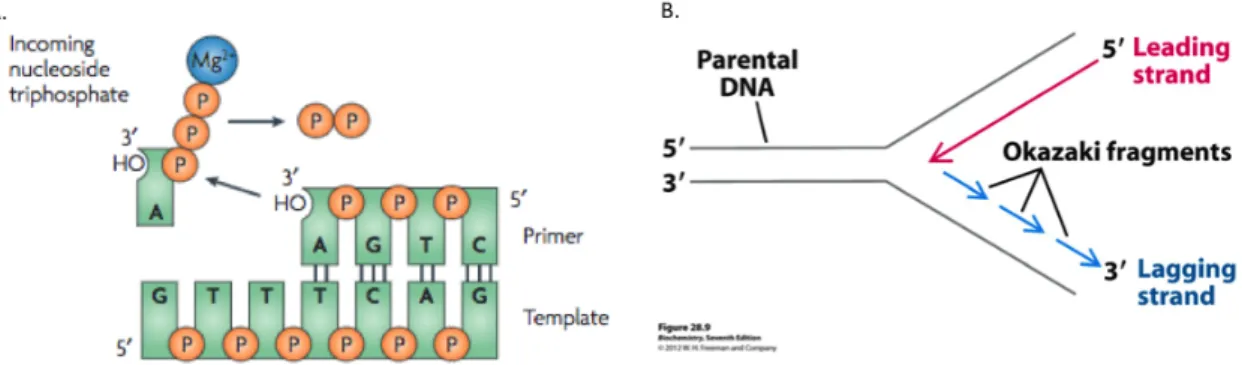
Unidirectionnality of DNA polymerases and asymmetric DNA replication DNA replication as suggested by Watson and Crick, could have been a spontan-eous mechanism with the alignment of bases of high affinity. However, Kornberg, a biochemist who studied the synthesis of nucleotides, postulated that an enzyme was necessary to assemble the DNA. In 1956, his team found such an enzyme in bacteria but only capable of catalysing the polymerisation of deoxyribonucleotids (dNTP are the association of base with the sugar and a triphosphate group) in 5’ to 3’ direction (Mitra and Kornberg 1966). Indeed, the chemical reaction proceeds between dNTP activated on their 5’ position and the 3’OH group of the previously incorporated nucleotide (Fig. 1.1.2 A. ). Since the two strands are antiparallel they cannot be both synthesised continuously. Okazaki discovered in 1966 (Sakabe and Okazaki 1966) that small fragments of DNA were actually synthesised in 3’ to 5’ direction (Fig. 1.1.2 B.) to be combined afterwards (Sugino et al. 1972). The synthesis of DNA on 3’ to 5’ strand is slightly delayed compared to the 5’ to 3’ and they are therefore termed respectively as lagging and leading strands (Lee et al. 1998).
Many DNA polymerases are needed in vivo for replication and as well for the repair of damaged DNA (Loeb and Monnat 2008). Three of them, Pol –, Pol ” and Pol Á are essential for the eukaryotic DNA replication (Johnson and O’Donnell 2005). None of them however can perform polymerisation de novo as they need a 3’OH group to start the chemical reaction. Therefore replication is started by the polymerisation of a small RNA fragment of about 10 ribonucleotides called primer. Pol –-primase is a complex of two polymerases and two primases and is able to start the DNA synthesis on both leading and lagging strands. Pol Á
Figure 1.1.2: Unidirectionality of polymerases imposes discontinuous synthesis on the lagging strand
A. The activation of dNTP on the 5’ position imposes the direction of DNA polymerisation. Figure 2b from Loeb and Monnat 2008 reused with permission.
B. While the synthesis of the leading strand is continuous, the lagging strand is synthesised in multiple fragments. catalyses the leading strand synthesis while Pol ” synthesises DNA on the lagging strand (Burgers 2009). Pol – only synthesises few ribonucleotides compared to Pol ” and Á (Chilkova et al. 2007). Highest processivity of polymerases ” and Á is explained by their physical interaction to the Proliferating Cell Nuclear Antigen protein (PCNA) which has a ring shape and encircles DNA (Moldovan et al. 2007). Polymerases must have a high fidelity (Table 1.1, McCulloch and Kunkel 2008). Contrary to Pol –, Pol ” and Pol Á possess a proofreading mechanism as their exonuclease activity in the 3’-5’ direction allows to remove mismatched bases. Despite the presence of a post DNA replication complementary mechanism to prevent errors called mismatch repair (MMR) (Li et al. 2016), the low fidelity of Pol – is an issue as it seems to synthesise a substantial proportion of lagging strand (10 bases every 100-200 bases).
Polymerase Fidelity Pol – 9.6 ◊ 10≠5
Pol ” Æ 1.3 ◊ 10≠5 Pol Á Æ 0.2 ◊ 10≠5
Table 1.1: Replication enzyme fidelity assessed by the frequency of single base substitution
This problem is most probably sorted during the step of Okazaki fragments maturation which consists on the removal of RNA fragments and ligation of DNA parts. Pol ” provokes a displacement of the next Okazaki fragment (Burgers 2009). This segment is therefore synthesised again with high fidelity. The displaced part
contains the RNA primer that can be also removed by Ribonuclease H (RNase H) as well as the DNA portion produced by polymerase – (Pavlov et al. 2006) and is processed by the flap endonuclease 1 (FEN1) (Goulian et al. 1990). DNA ligase I then completes the remaining nick (Olivera et al. 1968). The length of this dis-placed portion is proposed to be controlled by the presence of nucleosomes (Smith and Whitehouse 2012, Yadav and Whitehouse 2016) that are rapidly reassembled on the newly synthesised DNA (see subsection 1.2.3).
Helicase opening the double helix
Polymerases need to gain access to the bases therefore the double helix must be untwisted and the two strands separated. First helicase was discovered in bac-teria by Hoffman-Berling in 1976 (Abdel-Monem et al. 1976). Many helicases exists in vivo with several applications (Tuteja and Tuteja 2004). In eukaryotes, the hexamer composed of MCM 2 to 7 proteins (named for their essential role in minichromosome maintenance) performs the helicase activity required for ini-tiation and elongation step (Lohman, 1993). MCM complexes are installed as head-to-head double hexamer during the G1 phase of the cell cycle among with other factor and, as it will be discussed in subsection 1.1.2, their activation is the key step to the initiation of the replication (Riera et al. 2014). To be activated, MCM complex conformation changes (Bochman and Schwacha 2009) from encirc-ling double-stranded DNA to single-stranded DNA thanks to a tight interaction with protein cdc45 and the GINS complex to form the CMG complex (Costa et al. 2011) (Fig. 1.1.3).
Figure 1.1.3: helicase activity of the CMG complex
A. MCM2-7 complex can adopt an open and a close configuration. The notched configuration is stabilised by the interaction with Cdc45 and GINS. ATP reinforce the interaction of subunits 2 and 5 and grant the helicase activity of the complex.
B. Two MCM complexes are installed in tandem on ds-DNA. GINS and Cdc45 changes the configuration of MCM to encircle only one strand of DNA.
Figure 8 from Costa et al. 2011 reused with permission.
mechanisms have been proposed (Patel and Donmez 2006). According to new structures deduced from single molecule electron microscopy, the model for MCM progression and DNA unwinding is a inchworm translocation where the two strands are separated by steric exclusion (O’Donnell and Li 2016).
The unwinding of DNA leads to the apparition of single-stranded DNA where replication protein A (RPA) are recruited in order to prevent re-pairing of sep-arated strands, formation of hairpin via self-pairing and endogenous aggressions (Fanning 2006).
Supercoils and secondary structures
As early as 1954 Max Delbrück thought that DNA replication of a double helix would imply some topological issues (Delbrück, 1954). Indeed, the opening of the twisted molecule would lead to a even greater level of coiling named supercoiling. (Fig. 1.1.4 A.).
Figure 1.1.4: Top1 release supercoiling induced by DNA replication A. Biological processes acting on ss-DNA such as DNA replication create supercoiling.
B. Topoisomerases enzymes I and II relax these topological tensions. Figure 1 from Pommier 2006 reused with permission
DNA (KirkeGaard and Wang 1985). This enzyme are able to relax the topo-logical tension by creating a single (topoisomerase I) (Pommier 2006) (Fig. 1.1.4 B.) or double strand break (topoisomerase II) (Champoux 2001). In yeast, the elimination, but not the disruption of topoisomerase 2, does not prevent replic-ation (Baxter and Diffley 2008) probably replaced in its role by topoisomerase 1 (Bar-Ziv et al. 2016). However, topoisomerase 2 is crucial to decatenate sister chromatids in order to process to cell division (Baxter and Diffley 2008).
In addition to the replication induced supercoiling, DNA can adopt several non canonical secondary structures that can be a threat to a correct progression of the replication machinery. Genomic approach allowed to decipher the specific sequences causing such structures in vivo and to investigate their biological roles (Fig. 1.1.5). In addition to the classical B-DNA other forms of double helix also exist as well as more complex structures. G-quadruplex or tetraplex (G4) are extensively studied for their implications in main biological process such as DNA replication, transcription or telomeres maintenance (Bochman et al. 2012).
Figure 1.1.5: Several secondary structures of DNA exist in vivo Particular DNA sequences produce secondary structures. Table 1 from Wells 2007 reused with permission.
dismantle these structures to allow the correct progression of the replication ma-chinery (León-Ortiz et al. 2014). However the resolution of such structures as well as proteins bound to DNA requires the pause of the replication machinery (Labib and Hodgson 2007).
Dynamics of the replisome
The gathering of all the necessary proteins for replication is called replisome or replication fork. Its assembly and progression are tightly regulated (Kurth and O’Donnell 2013). Indeed, it is important that the helicase and the polymerase stay coordinated to avoid important formation of single-stranded DNA. Most enzymes of the replisome are therefore in direct interaction to prevent such an effect. The exact organisation of the replisome in eukaryotes is not totally defined but fast progresses are made in this direction (O’Donnell and Li 2016) and the CMG is known to interact with the polymerases – and Á (Sun et al. 2015). However no interaction with the polymerase ” which would grant coordination of leading and lagging strand was detected yet. The smooth progression of the replication fork suggests some mechanism for coordination of the two strands synthesis. The clamp loader RFC, responsible of PCNA loading could act as a coordinator of both polymerases Á and ” (Indiani and O’Donnell 2006) explaining their comparable speed when bound to PCNA (Stodola and Burgers 2016) without a direct contact with the helicase.
Figure 1.1.6: Replisome architecture
Red and black lines illustrate possible leading and lagging strand DNA path into the replisome. The blue arrow indicates the direction of replisome movement on DNA. The diagram indicates a long path of leading-strand DNA through the entire Mcm ring and then bending back up to PolÁ, requiring about 40 nucleotides of ss-DNA. Leading ss-DNA is illustrated as going completely through the Mcm2–7 complex and then bending up through the second ‘accessory’ channel of CMG, but this path is speculative. Figure 6 from Sun et al. 2015 reused with permission.
termed as replication stress (Zeman and Cimprich 2013). Despite the replisome interactions, replication stress can induce the uncoupling of double helix unwinding and DNA synthesis as well as the pause or stalling of fork. During such pauses, replication forks are protected by the interaction of several proteins forming the fork protection complex (FPC) (Leman and Noguchi 2012) to be able to resume the replication once the barrier is removed. This requires factors that are known to be physically associated with forks, even though the precise mode of interaction is not yet described (Calzada et al. 2005). Moreover, in case of the encountering of damaged DNA (alteration such as break in DNA strand, missing or chemically changed base), replisome contributes to the recruitment of DNA repair factors (Drissi et al. 2015, Haye and Gammie 2015).
All the coordination needed for normal or challenged progression of the repli-some outlines a complex and dynamic process for molecular mechanism of DNA polymerisation. From the basis of the DNA structure and experiment after exper-iment, scientists revealed how molecular actors tackle each issues. Although some of the actors are probably still unknown, the focus is now made on deciphering the sequential interactions between this great number of proteic partners whose coordination is as crucial as their action to preserve genome integrity.
1.1.2 Stepwise assembly of the replisome
Figure 1.1.7: Schematic view of the cell cycle
At the scale of the cell, one addi-tional challenge of DNA replication is to complete once and only once the replication of the totality of its genome before division. The life of the cell is a cycle of four alternat-ing phases : G1 phase duralternat-ing which the replication is prepared, S phase when DNA is synthesised, G2 phase when quality control are made and division prepared, followed by the M phase when the division occurs and produces two daughter cells ready to perform the same cycle. G1, S and G2 phases, called interphase, consti-tute the crucial step for DNA replic-ation.
G1 preparation and MCM paradox
The preparation of DNA replication in G1 phase consists of the recruitment of the pre-replication complex (pre-RC) in several positions of hte genome (defined in next subsection and next chapter). This process, called licensing, is precisely described in recent reviews (Riera and Speck (2016), Deegan and Diffley 2016) and illustrated in Fig. 1.1.8 A.
Briefly, the origin-recognition complex (ORC) composed of six subunits (1-6) binds the DNA. ORC then recruits cell division cycle 6 (cdc6) and chromatin licensing and DNA replication factor 1 attached to MCM (Cdt1-MCM). Interaction of MCM with Cdt1 is crucial to allow its import to the nucleus (Tanaka and Diffley 2002) and its interaction with ORC (Cook et al. 2004). Both ORC and Cdc6 possess ATPase activity that is necessary for the loading and subsequent activation of two MCM 2-7 complexes (Randell et al. 2006, Coster et al. 2014). The pre-RC complex was often considered to include ORC, cdc6, Cdt1 and MCM. However, such a complex is not the form that is subsequently activate in G1 phase and the preRC complex in recent publications mostly refer to the couple of MCM helicases (Siddiqui et al. 2013, Rivera-Mulia and Gilbert 2016b). Indeed, it has been shown that Cdc6 and Cdt1 are disengaged from the preRC before its activation (Chang et al. 2015). Also ORC has been shown to be non necessary during S phase after the loading of MCM (Gibson et al. 2006) and many MCM not bound to ORC are present and have been shown to be functional (Woodward et al. 2006).
The great abundance of MCM compared to ORC was referred as the MCM paradox as their distribution seemed inconsistent with their presumed helicase activity (Hyrien et al. 2003, Forsburg 2004). The excess of MCM is now known to be required to complete DNA replication in case of replication stress (Ge et al. 2007, Ibarra et al. 2008) and MCM has been shown to be involved in other processes as well (Das et al. 2014). Moreover, recent models suggest that the local excess of MCM could increasing the probability of firing in a given region (Das et al. 2015) (see next chapter).
While efforts were made on understanding the role of excess MCM, very few in-formation is known about how these MCM are loaded (Das and Rhind 2016). The possibility that MCM binds chromatin without being loaded by ORC is extremely unlikely as it is an active process. Moreover ORC is essential for cell viability and DNA replication (Randell et al. 2006, Yeeles et al. 2015). One bound-ORC could be able to load several MCM double hexamers (Wu and Nurse 2009) or it could load MCM double hexamer, unbind and move to a different location before loading another one (Bowers et al. 2004, Das and Rhind 2016). The double hexamer could then slide along double-stranded DNA as it has been shown in vitro (Edwards 2002, Remus et al. 2009, Evrin et al. 2009, Gros et al. 2015) particularly by being displaced by transcription machinery (Gros et al. 2015).
Figure 1.1.8: Loading and firing of a replication origin
A. Licensing is the sequence of events that lead to the loading of MCM double hexamer during G1. After binding to DNA, ORC recruits Cdc6. This complex then recruits the Mcm2-7 helicase bound to CDT by binding the C-terminal regions. Sequential release of Cdc6 and Cdt1 results in loading of the first Mcm2-7 helicase. ORC then binds a second Cdc6, the interactions between the N-terminal domains of the two Mcm2-7s recruit the second helicase. Arrival of the second Mcm2-7 drives release of Cdc6, followed by Cdt1 and ORC. Figure 3 from S. Bell lab website (http://web.mit.edu/bell-lab/) modified from Ticau et al. 2015.
B. The second step occurs in S phase and consists on the activation of the Mcm2-7 complex to trigger its helicase activity. It requires several firing factors (Sld2, Sld7, Sld3, Dpb11, Cdc45, GINS and the DNA polymerase Á), and it is dependent on the activity of two kinases, DDK and CDK. Figure 6 from Yeeles et al. 2015 reused with permission.
A recent papers in Drosophila strongly supports the model of several MCM loaded by one ORC and displaced by transcription (Powell et al. 2015) and is consistent with observations in human cells (Petryk et al. 2016).
Process in S phase is mainly regulated by initiation
The helicase loaded in G1 are inactive and several steps are needed to form the pre-initiation complex that will unwind the DNA double helix and allow the recruitment of the replisome (Fig. 1.1.8 B.) (Wu et al. 2014).
The Dbf4-dependant kinase Cdc7 (DDK) phosphorylates multiple MCM sub-units (2, 4 and 6) leading to the recruitment of Cdc45 and of Sld3 and Sld7 (Yabuuchi et al. 2006). Once phosphorylated by cyclin dependent kinases Clb5-Cdc28/Cdk2 (CDK) (Takeda and Dutta, 2005), Sld3 and 7 proteins are stabilised as a complex with Sld2 and the tetrameric GINS complex (Takayama et al. 2003) by the adaptor protein Dpb11 (Yeeles et al. 2015). The tight association between MCM, Cdc45 and GINS forms the CMG complex and allows the helicase activity (described in 1.1.1). The opening of the double helix induces the recruitment of the replisome and the processive replication by polymerases (described in 1.1.1). Other factor such as MCM10 are known to be necessary for initiation without an identified attributed role (Perez-Arnaiz et al. 2016).
Once formed, the replisome, also called replication fork, progresses at constant speed (Sekedat et al. 2010, Duzdevich et al. 2015) and stops when encountering another replication fork. Helicases are principally attached to the leading strand and therefore they are approaching each other on opposite strands in case of fork convergence. CMG is dismantled only after fork converged and the nascent double strands is fully ligated (Dewar et al. 2015). The CMG is therefore unloaded from double-stranded DNA by a poorly understood process that involves polyubiquit-inylation (Moreno and Gambus 2015).
Keeping the two steps apart
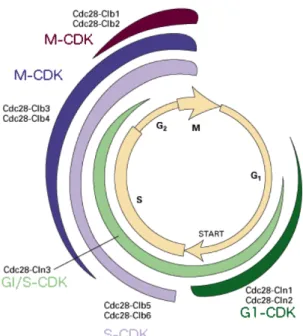
The strict separation of licensing and firing is crucial to avoid re-replication as no new pre-RC should be loaded on already replicated DNA. This insulation is allowed by a temporal regulation of anaphase-promoting complex (APC) and cyclins. Cyclins levels do not only regulate the DNA replication initiation but all cell cycle processes (Bloom and Cross 2007) by activating and often giving substrate specificity to partners cyclin-dependant kinases. In short, G1-phase cyc-lin–CDKs (G1-CDKs) phosphorylate proteins to promote S-phase entry, S-phase cyclin–CDKs (S-CDKs) are required to activate DNA replication, and mitotic cyc-lin–CDKs (M-CDKs) accurately regulate chromosome segregation through mitosis (Fig. 1.1.9). Regulation of DNA replication is reviewed in DePamphilis et al. 2012
and Siddiqui et al. 2013.
Figure 1.1.9: Regulation of budding yeast cyclins during the cell cycle Briefly, G1 phase is
character-ised by a high level of APC activ-ity which is promoting the degrad-ation of Dbf4 and a low level of CDKs activity thanks to a cyclin inhibitor (CKI). The phosphatase Cdc14 has multiple roles such as protecting CKI from degradation, inducing S/M cyclins degradation and promoting the transcription of CKI and cdc6.
While the preRC formation is promoted, initiation is inhibited by the phosphorylation of Sld3 and Dbf4 (Zegerman and Diffley 2010). The G1/S transition, is marked by the removal of the inhibition on im-portant transcription factors and the subsequent increase of G1/S-cyclins as well as replication pro-teins. The firstly produced
G1-CDKs will counteract the effect of Cdc14 and promote the degradation of CKI. Therefore Sld2 and Sld3 can be phosphorylated to promote initiation (Zegerman and Diffley 2007). The diminution of APC/C activity then induces a burst of Dbf4. Concomitantly, Cdc6 and Cdt1 are degraded to prevent formation of new pre-RC.
Despite the prevention mechanisms, re-replication can occur and triggers activ-ation of a checkpoint (Arias and Walter 2007). Re-replicactiv-ation is probably sensed by colliding forks that induce the formation of double strand breaks (Davidson et al. 2006). Depending on the cellular background, this leads to the activation of checkpoint pathways inducing G2/ M arrest, senescence or apoptosis (Truong and Wu 2011).
1.1.3 Conservation of DNA replication
Origin of replication from procaryotes to eukaryotes
The first replication model, called replicon, was set in 1963 by Jacob and Bren-ner. In the replicon model, replication was regulated by a positive interaction between an initiator protein, which is encoded by a structural gene, and a specific
genetic element of recognition, which is known as the replicator. The model was proposed for bacteria that duplicate their circular chromosomes from a single po-sition. Although in eukaryotes, DNA replication starts from several positions, the replicon model was adapted by considering the interaction of an initiator produced in more important quantity to several possible replicators.
Figure 1.1.10: Replicon model
A. In circular genome of procaryotes, a initiator is produce form a gene to active the single replicator. B. This model can be adapted to eukaryotes that would possess multiple replicators all along there genomes. Figure 1 from Gilbert 2004 reused with permission.
Indeed, sequences that can give the ability to initiate the replication to a plasmid called autonomously replicating sequence (ARS) could be considered as replicator. Such sequences have been isolated from the Saccharomyces cerevisiae (S.c) (Struhl et al. 1979) and Schizosaccharomyces pombe (S.p) (Maundrell et al. 1988) genomes. In S.c, ARS elements are ~100 bp in length and are characterised by a required con-sensus sequence (5’-[A/T]TTTAT[A/G]TTT[A/T]-3’) (Theis and Newlon 1997) as well as two redundant, non-conserved, auxiliary elements (Weinreich et al. 2004) called ARS-consensus sequence (ACS). The initiator have then be identified as ORC, that binds to this consensus sequence. However in other eukaryotes and despite years of investigation, no consensus sequences have been found for ORC binding. Latest studies also reveal that even in S.c ORC is able to bind unspecific sequences (Hoggard et al. 2013) but has a strong affinity for identified consensus sequence (Duzdevich et al. 2015) and the residues required for binding are con-served in all eukaryotes (Kawakami et al. 2015). Moreover, cdc6 binding could also be important in the recognition of the sequence (Speck and Stillman 2007) and could therefore help the loading of helicase at particular locations only, consistent with a poor efficiency of ORC non-specifically bound compared to ARS-bound ORC (Duzdevich et al. 2015).
The positions of initiation are called origins of replication. However, as the term was chosen based on the first replicon model it is now vitiated by some ambiguity. In order to remove this confusion, I distinguish three concepts often
equally referred as replication origins in the literature :
• ORC-binding sites : genomic sequences/loci where ORC binds the DNA and starts the sequential recruitment of the replication machinery (other site of ORC binding that do not lead to the recruitment of replication factors are not considered in this report)
• Potential origins : positions that are competent for the initiation of DNA replication (which, according to previous discussion, corresponds to double hexamers of MCM)
• Origins : positions where replication actually started in a particular cell during a particular cell cycle
Indeed, we saw in previous section that MCM are much more abundant than ORC therefore all potential origins as I termed them are not strictly ORC-binding sites. Moreover, as it will be detailed in the next chapter, not all potential origins fire in each cell at each cell cycle.
Conservation of the molecular machinery and models
Figure 1.1.11: The universal replication fork
A= Archaea (Ae=euryarchaea, Ac=crenarchaea), B=Bacteria, E=Eukarya, and bacteriophage T4. Homologous proteins performing the same function are framed together. Letters in brackets indicate DNA polymerase families. Figure 5 from Forterre et al. 2013.
The replisome is particularly well conserved with strong a homology between its constituents in bacteria, archea and all eukaryotes (Fig 1.1.11) (Leipe et al. 1999).
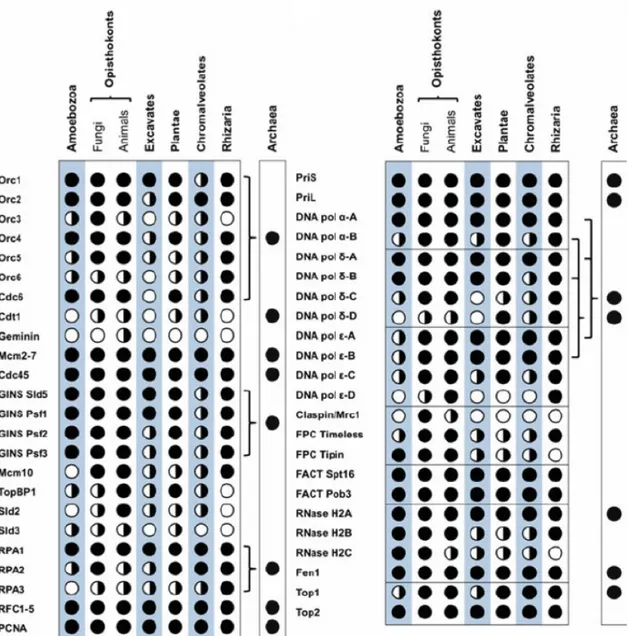
Figure 1.1.12: Distribution of DNA replication proteins across eukaryotic super-groups
Black dot indicates proteins present in all species; black/white dot indicates proteins present in some species; white dot indicates undetected proteins. Replication proteins with established archaeal homologues are indicated (final column: black dots). Lines connecting the eukaryote rows to the Archaea rows indicate paralogue relationships. First column is dedicated for proteins involved in licensing while second describes proteins of initiation of DNA replication. Figure 2.2 reused from Aves et al. 2012 with permission.
The main particularity of the bacteria replisome is the clear coupling of leading and lagging strand synthesis that is granted by the physical interaction of the clamp loader with the helicase. Such an interaction has not been found yet in eukaryotes where MCM proteins are already surrounded by direct partners for activation, regulation and chromatin maintenance. However, as described in subsection 1.1.1, other coupling interactions are very likely to occur in eukaryotes as well.
Due to the major difference on the number of origins, some regulators of the licensing and initiation are not present in bacteria but exist both in archea and eukaryotes (Aves et al. 2012) (Fig. 1.1.12). The cell cycle regulation by CDKs is also conserved (Zegerman 2015).
In addition to unicellular organisms (e.g. S.c, S.p), several in vitro models have been developed from purified proteins providing precise and accurate information (Mehanna and Diffley 2012, Riera et al. 2014 , Ticau et al. 2015). Another long used in vitro system to study DNA replication is the Xenopus leavis eggs extract. Isolated nuclei from frog sperm in presence of cytosol extract from eggs perform a naturally synchronous, fast and total replication of their DNA (Gillespie et al. 2012). Moreover, other DNA can be replicated in the same cytosolic extract (Le-bofsky et al. 2009).
The relevance of unicellular organisms such as the budding yeast to get general conclusions for all eukaryotes is debatable and has to be reserved to delimited areas. DNA replication is a field where simple model organisms have provided and will still provide precious insight. Indeed, in spite of some variations (Errico and Costanzo 2010) DNA replication is highly conserved in eukaryotes and beyond. Moreover unicellular organism and in vitro systems cost less in time and money and allow to set the hypothesis to be confirmed in higher organisms.
1.2 Replication of chromatin
1.2.1 Nucleosome as the structural unit of chromatin
DNA wrapping around histones proteins core
Several experimental observations such as the x-ray diffraction pattern of DNA (Wilkins et al. 1959), the ratio of histones proteins, the visualisation of a charac-teristic size on digested DNA (Hewish and Burgoyne 1973), as well as beads on a string aspect of first electron microscopy images of DNA, suggested the presence of a structural unit (Kornberg 1974). This “coiled DNA molecules jointed by his-tones bridge” (Wilkins et al. 1959) was named nucleosome (Oudet et al. 1975) and
its structure was later resolve with high resolution (Luger and Richmond 1998).
Figure 1.2.1: Nucleosome composition
Nucleosome is composed of an octamer of histones (two repeats of histones H2a, H2b, H3, H4) encircled by 1.7 fold of DNA which corresponds to 146bp forming a left-handed helix and a free DNA part called linker whose size varies between 20 and 100 bp (McGinty and Tan 2015). The eight-histones core forms a flat cylinder of 10nm diameter and 6nm thickness. Histone proteins have a particular structure with a domain called histone fold which is highly conserved and less structured tails. These tails are not involved in the DNA stabilisation in the nucleosome but mostly intervene in interaction with neighbouring nucleosomes and other proteic partners. Histones tails can carry post-translational modifications (PTM) which thus have an influence on the level of compaction of chromatin.
Post-translational modification of histones
At least 8 classes of chemical modifications have been identified, each of which could exist on several possible positions (Kouzarides 2007). The best described and characterised are the acetylation and methylation that can be deposited and re-moved by respective enzymes : histone acetyltransferase (HAT), histone deacetyl-transferase (HDAC), histone methyldeacetyl-transferase (HMT) and histone demethyltrans-ferase (HDM) (Cortini et al. 2015).
Acetylation of a lysine which is possible on all core histones but more frequent on lysine 16 of H4 (H4K16ac), neutralises partially the positive charges of his-tones and contribute to a diminution of their affinity for DNA leading to more open region associated with genes transcription (Rice and Allis 2001). On the contrary, mono-, di- or tri- methylation of lysines and arginines give more complex result with some modification being linked to open chromatin (H3K4me(1/2/3), H3K36me(1/2/3), H4K20me1, H3R17me(1/2)) and other to repressive or closed
Figure 1.2.2: PTMs on histone tails
state (H3K9me(1/2/3), H3K27me(2/3), H4K20me3, H3R2me2). Notably, H3K9me3 leads to the recruitment of HP1 and H3K27me3 of polycomb architectural complex which both have further role in the chromatin silencing.
Although a tremendous diversity of marks is possible, only few combinations actually exist in vivo with some histone modifications being always associated together giving only few chromatin types (Filion et al. 2010, Roudier et al. 2011, Ernst et al. 2011).
Nucleosomes positioning on DNA chain
Figure 1.2.3: Lexicon of nucleosome positioning Schematic of nucleosome locations on DNA depicting the nucleosome repeat length (A), nucleosome fuzziness (B). Figure 1 from Arya et al. 2010.
Besides being a packaging unit, nucleosomes play a cru-cial role in cellular process by regulating DNA accessib-ility. The position of nuc-leosome is therefore essential and must be regulated, but the global factors regulating nucle-osome positioning are still un-clear. Nucleosome mapping re-vealed that DNA sequences is important to determine nucle-osome position due to differen-tial histone-DNA affinity and physical properties of the se-quence such as flexibility (Vail-lant et al. 2007).
preferentially lack nucleosome and are referred as nucleosome free or depleted re-gions (NFR, NDR) while other are preferentially covered. In vitro and in vivo nuc-leosome positioning is significantly more similar than random expectation showing the contribution of DNA sequence (Struhl and Segal 2013). However at particu-lar positions, such as gene promoters, in vitro and in vivo data diverge showing a strong implication of other factors. The action of proteins called nucleosome remodellers allows to reproduce these patterns but no mechanism is known so far. Indeed, these factors are able to displace nucleosomes and favour a thermodynam-ical equilibrium but are not able to specifthermodynam-ically position nucleosome or address them to particular region (Arya et al. 2010).
In addition to positioning, the two remodellers Isw1 and Chd1 in yeast contribute to establish the nucleosome spacing. It has been observed that the linker has preferential length possibly due to the folding of nucleosomes into higher order structures that could impose nucleosomes spacing (Jansen and Verstrepen 2011, Grigoryev 2012).
1.2.2 Chromatin higher order organisation in vivo is still under
debate
Nucleosome packing into 30nm fibre
Figure 1.2.4: Two models for chromatin fibre The solenoid model is characterised by interactions between consecutive nucleosomes (n, n + 1; a,b), whereas the zigzag model implies interactions between alternate nucleosomes (n, n + 2; c,d). Figure 4 reused from Luger et al. 2012 reproduced from Li and Reinberg 2011 with permission. The interaction of
his-tone protein H1 at the en-trance and exit of DNA in histones core allows the nucleosomes to get more compact configurations (Thoma and Koller 1977). Notably, a 30nm fibre is observed by electron microscopy and its internal structure has been debated since its first obser-vation.
Two principal family of chromatin compaction els exist : the solenoid mod-els (Finch and Klug 1976) where consecutive nucle-osomes form a single helix while the linker DNAs are bent in the interior of the
fibre and the zigzag (Williams et al. 1986) or cross-linker models which features two separate nucleosomal stacks with linker DNAs crossing the fibre core thus consecutive nucleosome in the helix are not directly stacked. Several experimental data support one model or the other (Szerlong and Hansen 2011) suggesting that DNA could adopt both configuration alternatively. Recent model on the zigzag family allows to reproduce the experimental features observed at various salt con-ditions and in particular the link between compaction and linker length (Song et al. 2014, Wu et al. 2016). The model shows interdigitating nucleosome in such fibre consistent with overlapping of nucleosomal territories (Chereji and Morozov 2014)
Existence of the structure in vivo
As it was extensively studied in vitro, the debate has been strong on the ex-istence of such a structure in vivo (Van Holde and Zlatanova 1995,Fussner et al. 2011, Hansen 2012, Maeshima et al. 2010). The structure was believed to be an artefact due to non physiological salt conditions in vitro and to cell fixation and heavy staining protocol in vivo. Direct measurement by small-angle scattering (de-scribed in chapter 3) in isolated nuclei showed difference between cell types and were interpreted as the presence of a 30nm structure in some interphase nuclei such as chicken erythrocytes (Langmore and others 1983) and not in other such as HeLa cells (Maeshima et al. 2014). However, data on HeLa cells are consistent with the absence of 30nm fibre detected by cryo-electron microscopy (Eltsov et al. 2008) but not with recently observed fibre in several sample preparation protocols with electron tomography (Li et al. 2015).
Although the debate on the existence of 30nm fibre in vivo is not yet closed, the dogmatic view of all genome being folded into a rigid very well defined fibre is now reserved to textbooks. Conformation capture experiment (described in chapter 3) indeed described a more extended fibre with local increase in compaction in yeast (Dekker 2008). A recent experiment called EM-assisted nucleosome interaction capture (EMANIC) studies chromatin architecture in HeLa interphase nuclei and metaphase chromosome, showing the persistence of a zigzag motif but organised as open and irregular arrays. A less distinct diameter compared to canonical zigzag model would explain the lack of 30nm signal with other techniques. Moreover, the organisation of chromatin changes in metaphase with an increase of long range interactions, consistent with intra-fibre looping (Grigoryev et al. 2016).
Higher order compaction
Many chromatin functions require the gathering of distant genomic position by so called chromatin loops (Kadauke and Blobel 2009). Loops have variable stability
and it is not clear if they constitute a distinct hierarchical level (Woodcock and Ghosh 2010). Indeed, a model of regularly folded loops does not explain the high variability in distances between genomic loci (Trask et al. 1993, Berger et al. 2008) and the multiple possible contact between one locus to several other loci revealed by conformation capture techniques (Simonis et al. 2006, Lieberman-Aiden et al. 2009). Polymer forming random loops (Yokota et al. 1995) however provide a good model for global chromatin behaviour, showing the importance of polymer physics to describe chromatin (Fudenberg and Mirny 2012, Imakaev et al. 2015) as it will be discussed in last chapter of the introduction.
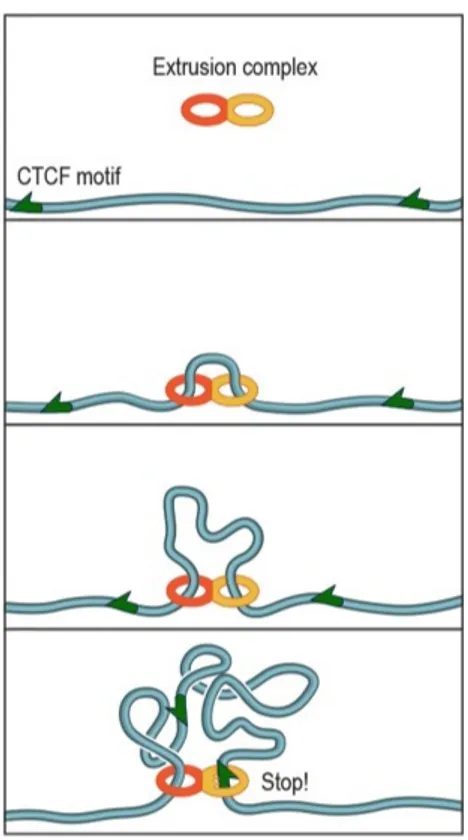
Figure 1.2.5: Loop extrusion model Extrusion complex loads onto the fibre at a random locus, form-ing an extremely short-range loop. As the two subunits move in opposite directions along the fibre, the loop grows and the extruded fibre forms a domain. When a subunit detects a motif on the appropriate strand, it can stop sliding. The territory thereby formed include only one chromosome. Figure 5. A. from Sanborn et al. 2015.
The fractal or crumpled glob-ule model (Grosberg et al. 1993, Lieberman-Aiden et al. 2009) is an unknotted and out-of-equilibrium fractal structure. In budding yeast where the ratio between the nuc-leus size and the genome length is greater than in metazoans, this structure can reach an equilibrium to form an equilibrium globule (Mirny 2011, Wang et al. 2015). However, increasing resolution of the chromatin conformation cap-ture technique (Rao et al. 2014) reveals that the fractal globule does not reproduce every feature of the human genome folding on every scale. Indeed, human chro-mosome fold into chrochro-mosome ter-ritories (Cremer et al. 2006) which are not accurately represented by the fractal globule.
This lead to the construction of a new model called extrusion loop (Sanborn et al. 2015). In addition to a good consistency with chromosome contacts and do-mains formation (Fudenberg et al.
2016), it also provides a biological context by explaining the mechanism of loop formation with the involvement of CCCTC-binding factor (CTCF) and cohesin (Sanborn et al. 2015). This unknotted model also describes the compaction into
chromosomes (Goloborodko et al. 2016b) and the chromatide segregation during cell division (Goloborodko et al. 2016a). Overall this new model is an exciting view of active genome organisation (Yardımcı and Noble 2015) already referred as loopy globule (Grosberg 2016).
1.2.3 Chromatin is reconstructed as DNA is replicated
Nucleosomes have to be removed to allow passage of the replication fork and have to be replaced on the two newly formed DNA strands . The cell seems to have find an efficient way to organise this reassembly as chromatin is almost immediately reconstructed after the passage of the fork (Sogo et al. 1986) which means that two new nucleosomes are assembled every 5 to 10 s. Moreover, contrary to DNA replication, no template is available to reproduce the nucleosome distribution and post-translational modifications, which raise a lot of questions tackled in several reviews (Margueron and Reinberg 2010, Alabert and Groth 2012, MacAlpine and Almouzni 2013).
New nucleosome assembly after replication
DNA replication disrupts nucleosomes in a close vicinity of the fork possibly as a result of a collision with the replicative helicase or due to supercoiling ahead of the fork (Alabert and Groth 2012). H2A and H2B have a dynamic behaviour during the entire cell cycle with a important turn-over in nucleosome composition (Kimura and Cook 2001). H3-H4, however, are much more stable and a segregation occurs with parental H3-H4 tetramers being repositioned behind replication fork and other synthesised de novo (Riley and Weintraub 1979). Chromatin assembly factor 1 (CAF-1) acts as histone chaperone and promotes deposition of histones H3–H4 onto replicating DNA (Smith and Stillman 1989). Antisilencing function 1 (ASF1) also acts as a chaperone to facilitates chromatin assembly via interaction with CAF-1 (Tyler et al. 1999, Mello et al. 2002). The subsequent addition of histones H2A – H2B involves the nucleosome assembly protein 1 (NAP1) chaperone (Zlatanova et al. 2007) and the FACT (facilitates chromatin transcription) complex that acts as an H2A – H2B chaperone in many cellular processes.
To couple histone deposition with DNA synthesis, CAF-1 interacts with the replication fork through PCNA (Moggs et al. 2000, Zhang et al. 2016) while MCM-2 binds parental or new H3-H4 and seems to act as a platform to keep H3-H4 in close proximity of the fork where they are taken care of by ASF1. H3-H4 are both recycled from parental nucleosome and synthesised de novo (Alabert et al. 2015). Experimental data do not allow to solve wether parental tetramers are split to be completed by de novo H3-H4 dimers or not (reviewed in Annunziato 2015). The resolution of the structure of the complex MCM-H3-H4-ASF1 reveals that H3-H4
can bind MCM as a tetramer or a dimer in presence of ASF1 (Richet et al. 2015, Huang et al. 2015) suggesting a mechanism for both mixed or direct re-association (Clément and Almouzni 2015).
Figure 1.2.6: Histone reassembly after replication fork passage
For each parental nucleosome disrupted by replication-fork passage (indicated by the grey arrow), an H3–H4 tetramer or two H3–H4 dimers are made available. The histones are in turn recycled on newly synthesised DNA either directly as a tetramer or as two dimers. New histones are deposited on nascent DNA to ensure a full complement of nucleosomes on the nascent DNA. Recycling of parental histones and de novo deposition are thought to occur randomly on both the leading and the lagging strands. Here, for clarity, de novo deposition is depicted on the bottom strand. Figure 1. from Clément and Almouzni 2015 reused with permission.
Redeposition of post-translational marks
Replication also disturbs the post-translational modifications (PTM) pattern. Indeed, the deposition of preRC promotes the acetylation of neighbouring nuc-leosomes in order to grant access to the replication machinery (Liu et al. 2012). Moreover, DNA replication progression also creates a wave of acetylation upstream of the fork (Bar-Ziv et al. 2016).
PTM on recycled histones are conserved when they are incorporated to new nucleosomes (Alabert et al. 2015). New histones however, present PTM specific of pre-chromatin assembly such as diacetylation for H4 (Allis et al. 1985) and acetylation and monomethylation (H3K14ac, H3K18/K23ac, H3K9me1) for H3 (Loyola et al. 2006) and need to be modified. In both human and budding yeast,