HAL Id: cea-01272821
https://hal-cea.archives-ouvertes.fr/cea-01272821
Submitted on 11 Feb 2016HAL is a multi-disciplinary open access
archive for the deposit and dissemination of sci-entific research documents, whether they are pub-lished or not. The documents may come from teaching and research institutions in France or abroad, or from public or private research centers.
L’archive ouverte pluridisciplinaire HAL, est destinée au dépôt et à la diffusion de documents scientifiques de niveau recherche, publiés ou non, émanant des établissements d’enseignement et de recherche français ou étrangers, des laboratoires publics ou privés.
Experimental investigation of the effect of temperature
on the first desorption isotherm of concrete
Stéphane Poyet
To cite this version:
Stéphane Poyet. Experimental investigation of the effect of temperature on the first desorp-tion isotherm of concrete. Cement and Concrete Research, Elsevier, 2009, 39 (11), pp.1052-1059. �10.1016/j.cemconres.2009.06.019�. �cea-01272821�
Experimental investigation of the effect of temperature
1
on the first desorption isotherm of concrete
2
Stéphane POYET 3
CEA Saclay, DEN/DANS/DPC/SCCME/LECBA, B158, 91191 Gif sur Yvette Cedex, France 4
1.
Abstract
5
In the framework of the radioactive waste management in France, interim storage concrete 6
structures should be submitted to temperature up to 80°C and subsequent desiccation. The 7
impact of temperature on the sorption properties of concretes has been poorly studied and 8
results are scarce. An experimental campaign was thus carried out to characterize the first 9
desorption isotherms of a modern concrete at 30°C a nd 80°C. The results show a significant 10
influence of the temperature increase that will have to be accounted for the durability 11
assessment of the long-term interim storage concrete structures. Investigating the causes of 12
these modifications, it appeared that desorption induced by temperature might be the 13
principal mechanism rather than microstructure alteration and water properties evolution. 14
2.
Introduction
15
In the framework of radioactive waste management, the concrete structures for radioactive 16
waste management are expected to undergo significant heating due to the waste thermal 17
power. In the French concept of subsurface structures, the cooling is likely to be achieved 18
using natural convection with air taken from outside. Doing so, the concrete temperature is 19
expected to reach (but not to exceed) 80°C in norma l conditions and the concrete structure is 20
expected to undergo severe drying (due to the temperature increase of the ambient air) [1; 21
2]. The durability assessment of these structures over 300 years thus requires the accurate 22
knowledge of the sorption properties of concretes at such unusual temperature levels with 23
The influence of temperature on the sorption isotherms has been poorly studied and 25
experimental results are scarce in the scientific literature. Among these studies Daïan has 26
experimentally determined the adsorption isotherms of a water-cured mortar at four different 27
temperatures: 20, 35, 45 and 55°C [3; 4]. The sampl es have been initially dried at 80°C and 28
then exposed to different increasing RH for the four temperatures. The curves thus obtained 29
are reproduced on Fig. 1 (according to the results published in [4]). The temperature 30
influence can be summarised as follows: the higher the temperature, the less the amount of 31
water adsorbed. Nevertheless, the offset between the curves obtained at 20°C and 55°C was 32 found to be low. 33 0 1.5 3 4.5 6 7.5 0% 20% 40% 60% 80% 100% Relative Humidity W a te r c o n te n t b y m a s s [ % ] 20°C 35°C 45°C 55°C 34
Fig. 1. Adsorption curves for a mortar between 20°C and 55°C after Daïan [4]. 35
This observation is in good agreement with the experiments of Radjy et al. [5] who 36
characterised the first adsorption branch of two mature (about two years old) steam-cured at 37
early-age (at nearly 100°C) hardened cement pastes with water-to-cement ratio (W/C ratio) 38
equal to 0.35 and 0.45 respectively for temperatures between 0°C and 60°C. The results 39
have shown a very limited dependence of the isotherms to temperature in this range. In the 40
same way, the first desorption isotherm of a mature (kept one year under water) hardened 41
cement paste cured at ambient temperature with a W/C ratio equal to 0.50 was characterised 42
for temperatures between 0°C and 40°C. As mentioned before, the resulting desorption 43
isotherms showed hardly any dependence on the temperature used. 44
In a recent attempt to develop a model capable of predicting the behaviour of concrete in any 45
arbitrary environment Ishida et al. [6] have characterised the sorption isotherms (the first 46
adsorption and the first desorption branches) of an 80-day water-cured hardened cement 47
paste (W/C ratio equal to 0.50) for 20°C, 40°C and 60°C. The results obtained for the first 48
adsorption have shown little differences between the curves for the three temperatures. 49
However, the results of the first desorption appeared to be much different: the first desorption 50
isotherm was greatly modified by the temperature increase. The decrease of the amount of 51
water adsorbed at higher temperatures was more pronounced than that obtained for 52
adsorption. Moreover the shape of the isotherms was also modified by the temperature 53
increase. 54
These facts have already been pointed at by Hundt & Kantelberg [7] who characterised the 55
first desorption isotherm of different cementitious materials for temperatures ranging from 56
20°C to 70°C. The results obtained with a 3.6 year old mortar (W/C ratio equal to 0.50) are 57
reproduced on Fig. 2 (according to the data published in [7]). As mentioned before the higher 58
the temperature, the less the amount of water adsorbed at equilibrium. One can see on Fig. 59
2 that the 20°C desorption isotherm was nearly a st raight line. This pattern was greatly 60
modified when working at higher temperatures: see for instance the linear part between 20% 61
and 50% with a decreasing slope related to the temperature increase and the pronounced 62
upwards deviation for high RH. In addition, one can note the significant decrease of the 63
amount of water adsorbed at saturation as a function of temperature: the higher the 64
temperature, the lesser the amount of water at saturation. Hardened cement pastes with 65
varying W/C (between 0.40 and 0.55) and concretes with various preliminary treatments 66
were also tested by Hundt & Kantelberg [7], all the results obtained in this study (various 67
cementitious materials with various curing methods) confirm all these observations. 68
0 1 2 3 4 5 0% 20% 40% 60% 80% 100% Relative humidity W a te r c o n te n t w [ % ] 20°C 45°C 57.5°C 70°C 69
Fig. 2. First desorption isotherms for a mature mortar for four temperatures ranging from 70
20°C to 70°C according to Hundt & Kantelberg [7]. 71
An experimental campaign was then undertaken to highlight the influence of temperature and 72
gather experimental data for further numerical approaches and durability assessment of 73
interim storage concrete structures. The first desorption isotherm of a modern high-74
performance concrete was characterised at 30°C and 80°C. The temperature dependence of 75
cementitious materials sorption properties is generally related to the coarsening of the pore 76
structure (ettringite dissolution and C-S-H alteration) together with the evolution of water 77
properties [8-11]. In this study, the examination of the results obtained indicates that another 78
phenomenon may be at work and suggests that the microstructure alteration and the water 79
properties evolution may have negligible effects. 80
3.
Experimental programme
81
3.1.
Material tested
82
The material used for the experiments was a modern high-performance concrete, the 83
formulation is reported on Tab. 1. It is based on CEM I cement. The water-to-cement ratio 84
(by weight) is equal to 0.43. This formulation was used because it is one of those which are 85
studied in the framework of radioactive waste management by the French agency for 86
radioactive waste management (Andra). 87
Tab. 1. Concrete formulation 88
Component Nature Origin Qty Unit
Cement CEM I 52.5 Lafarge Val d’Azergues, France 400 kg/m3 Sand Calcareous [0-5] Boulonnais quarry, France 858 kg/m3 Gravel Calcareous [5-12.5] Boulonnais quarry, France 945 kg/m3
Water - - 172 L/m3
Superplasticizer Glenium 27 BASF 10 kg/m3
The main properties of the concrete have been determined experimentally on samples taken 89
out of the same batch and cured more than one year under water at 20°C. The values 90
obtained are reported on Tab. 2. All the characterization tests were performed on saturated 91
samples at 20°C (except for the gas permeability me asurements and water porosity which 92
implied complete drying at 60°C) and after thermal treatment at 80°C (until constant mass 93
was achieved, residual properties after cooling). The intrinsic permeability to gas (nitrogen) 94
was estimated using the Klinkenberg approach [12]. 95
Tab. 2. Main concrete properties, all given data are at least the mean of three values 96
Concrete properties 20°C 80°C Unit
Tensile splitting strength (Brazilian test) 5.80 4.95 MPa
Compressive strength 89.7 79.5 MPa
Elastic modulus 49.2 41.7 GPa
Poisson’s ratio 0.18 0.17 -
Water porosity 11.3 12.0 %
Intrinsic permeability (nitrogen) 2.0·10-17 4.2·10-17 m²
Klinkenberg coefficient 0.13 0.06 MPa
Heat conductivity 2.49 2.09 W/mK
The porosity to water at 30°C and 80°C was estimate d using the mass loss obtained using 97
silica gel (RH~3%). It was also estimated using two other usual experimental protocols: 98
drying at 60°C with silica gel and drying at 105°C. All the results are presented in Tab. 3. The 99
concrete saturated density was calculated using hydrostatic weighing, the mean value was 100
found to be equal to 2.48. 101
Tab. 3. Porosity to water according to the experimental protocol. 102
Protocol 30°C (silica gel) 60°C (silica gel) 80°C ( silica gel) 105°C (no silica gel) Porosity to water 10.7% 11.3% 12.0% 12.3%
3.2.
Technique used
103
The concrete first desorption isotherm was determined at 30°C and 80°C. The desiccator 104
method using saturated salt solutions was chosen for its simplicity and its reliability. This is a 105
standalone system which minimises human interventions and is recommended by the 106
European Committee for Standardization [13]. The different RHs which were used are given 107
in Tab. 4. For RH=100% deionised water was used (without any salt) and for RH=3% silica 108
gel was used (without water). The saturated salt solutions were prepared according to 109
international recommendations [13; 14] and the resulting RHs were verified before use. 110
Tab. 4. RH investigated and corresponding saturated salt solutions. 111
RH obtained at
Salt used Formula
30°C 80°C
Deionised water H2O 100% 100%
Potassium sulphate K2SO4 96% 95%
Sodium sulphate Na2SO4 10 H2O - 90%
Potassium nitrate KNO3 90% -
Potassium chloride KCl 85% -
Sodium chloride NaCl 75% 74%
Sodium nitrate NaNO3 - 65%
Ammonium nitrate NH4NO3 63% -
Sodium bromide NaBr 55% 51%
Potassium carbonate K2CO3 - 42%
Magnesium chloride MgCl2 6 H2O 33% 26%
Lithium chloride LiCl 12% 10%
Silica gel SiO2 3% 3%
3.3.
Sample preparation
112
Characterization of the sorption isotherm using the gravimetric method requires long-term 113
experiments due to the samples dimensions and water transfer properties of the materials 114
tested. In order to reduce the experiment duration the samples used usually have small 115
dimensions: thin slices [15-17], powders [18-20], crushed or sawn small specimens (up to 116
one centimetre max) [4; 6; 20-22]. One can note that such sample shape and dimensions 117
greatly differ from a concrete Representative Volume Element (RVE). In addition, if the 118
sample preparation has an effect on the experiments (for instance superficial microcracking 119
or carbonation) then this effect may concern a great part of the sample volume because of its 120
thinness. 121
In this study an attempt was made to use massive samples as close as possible to a RVE. 122
Hence “massive” cylindrical specimens with diameter and height equal to 40 mm were used. 123
One could note that this dimension is far from the minimum 100 mm recommended in the 124
European standard EN 123901 [23], nevertheless this value appeared as the best 125
compromise between the duration of the experiments and the representativeness of the 126
samples (the weight of the resulting samples was about 120 grams.) 127
The samples were cored from 11 cm x 22 cm specimens cured under water (with added 128
lime) at 20°C at least one year after casting. All the samples were taken from the same batch 129
(the one used for the characterisation whose results are presented in Tab. 2). No 130
preventative measure was taken to prevent carbonation since it is expected to affect only a 131
small zone at the surface of the samples that is to say a negligible volume when compared to 132
the total volume of the samples. 133
3.4.
Dry and saturated states
134
The reference dry state is essential for the correct evaluation of the sorption curves. It is 135
generally estimated using oven-drying. This treatment is known to be too aggressive for 136
cement-based materials (microcracking and modification of pore network) and alternate 137
techniques do exist (isothermal drying using hydrophilic compounds, solvent exchange, D- or 138
P-drying…) [24-29]. Yet as far as only desorption is concerned (no preliminary drying and no 139
further resaturation) oven-drying at 105°C was chos en as the reference dry state. 140
The initial saturated state was achieved using the one-year cure under water (with lime to 141
prevent carbonation). No other specific procedure was used (for instance resaturation using 142
vacuum). 143
3.5.
Experimental protocol
144
The best method for the characterisation of the first desorption isotherm consists in 145
submitting a unique set of initially saturated samples to decreasing RH steps and waiting for 146
equilibrium for each step [5; 7; 20; 30; 31]. This method was inappropriate for this study 147
given that the time needed to reach equilibrium was expected to be too long due to the 148
massive samples used. It was then decided to use different set of samples to be submitted to 149
a unique RH. The number of sample set for each temperature (30°C and 80°C) was equal to 150
the number of salt solutions (10 sets for each temperature including deionised water and 151
silica gel, see Tab. 4). This method allowed the simultaneous determination of each point of 152
the curve and a corresponding estimated reduction of the experiments time by a factor 10. It 153
was however expected to induce some variability since different specimens were to be used. 154
Fig. 3. View of the 40 mm x 40 mm samples and the climatic boxes containing the saturated 155
salt solutions. Note the opening at the top of the containers which allows inserting a probe for 156
verification of both temperature and RH. 157
The 40 mm x 40 mm cylinder samples were weighed in air and under water before the 158
beginning of the experiments and their volume and saturated density were computed 159
(weighing was carried out using a 1 mg accurate device). They were then put in hermetic 160
containers by groups of three above the saturated salt solutions and the containers were 161
kept in two different ovens regulating the temperature to 30°C and 80°C. A view of the 162
40 mm x 40 mm samples and of the hermetic containers is presented in Fig. 3. The 163
containers were opened periodically to measure the mass of the samples. The latter were left 164
as long as possible in the containers in order to get as close as possible to equilibrium. 165
4.
Experimental results
166
4.1.
Mass variation and water transfer properties
167
On the basis of the periodic mass measurements, the mean relative mass variation (∆m/m)
168
of the samples for each temperature and RH could be computed following the classical 169 relation: 170
( )
( )
0 0 m m t m t m m − = ∆ , (1) 171where m0 and m(t) are the initial sample mass (saturated) and the mass for the time t. The
172
results are presented in Fig. 4 and Fig. 5 for 30°C and 80°C respectively. 173
RH=12% RH=33% RH=55% RH=63% RH=75% RH=85% RH=90% RH=95% RH=100% RH=3% -5% -4% -3% -2% -1% 0% 0 300 600 900 1200 1500 Time (days) R e la ti v e m a s s v a ri a ti o n 174
Fig. 4. Mass variation of the samples kept at 30°C (each value is the average value obtained 175
using three samples, the error bar stands for the standard deviation). 176 RH=10% RH=42% RH=51% RH=65% RH=74% RH=90% RH=95% RH=100% -6% -5% -4% -3% -2% -1% 0% 0 100 200 300 400 500 600 Time (days) R e la ti v e m a s s v a ri a ti o n 177
Fig. 5. Mass variation of the samples kept at 80°C (each value is the average value obtained 178
using three samples, the error bar stands for the standard deviation). 179
The desorption experiments spanned over 1200 days and 500 days for 30°C and 80°C 180
respectively. Such experiment durations (qualitatively) appear to be sufficient to reach 181
equilibrium at 80°C but not at 30°C for which the s amples kept between 55% and 85% still 182
present mass variation after 1200 days. Nevertheless, the amount of water in excess (with 183
respect to the equilibrium to be reached) is expected to be low and the corresponding error 184
negligible. One can note that for each temperature the patterns are similar: the mass loss 185
kinetics is maximal in the early days, it is then continuously reduced as far as the drying 186
proceeds and the equilibrium is approached. In addition, the lower the RH the higher the 187
mass loss. The main differences between the results for both temperatures lie in the mass 188
loss kinetics and in the value reached at equilibrium (the last point will be discussed in the 189
next chapter). 190
When examining Fig. 4 and Fig. 5 it is obvious that the time needed to reach the equilibrium 191
at 80°C is much lower than the one needed at 30°C. For instance, the time needed to reach 192
90% of the mass loss is about one month at 80°C; it is extended to more than one year at 193
30°C. This point has already been studied by severa l authors who showed the drying 194
acceleration and the increase of the water transfer properties with temperature [32-36]. 195
4.2.
First desorption isotherms
196
In order to determine the first desorption isotherms at 30°C and 80°C, the amount of water 197
retained according to the RH was expressed using the mass water content w: 198
(
)
(
)
s w m RH T m RH T w , = , , (2) 199where mw and ms are the mass of adsorbed water and the mass of the dry material
200
respectively. It was computed using the experimental mass variations (∆m/m):
201
(
)
(
)
+ ∆ − = sat sat sat d RH T m m d d RH T w φ φ , , , (3) 202where dsat and φ are the saturated initial density and the porosity respectively. The results are
203
presented in Fig. 6, the reference dry state was fixed using oven drying at 105°C; that is to 204
say the value of the porosity φ needed in eq. (3) is equal to 12.3%. 205 0% 1% 2% 3% 4% 5% 6% 0% 20% 40% 60% 80% 100% Relative humidity W a te r c o n te n t w Exp. 30°C GAB (30°C) GAB (80°C) Exp. 80°C 206
Fig. 6. First desorption isotherms at 30°C and 80°C. 207
The symbols stand for the experimental results derived from the experiments whereas the 208
solid lines stand for a curve-fitting using the GAB model [37-39]. The GAB model is a three-209
parameter which is an evolved version of the BET model (with a supplementary parameter 210
k), it can be written as follows:
211
( ) ( ) ( )
kh[
C kh]
h Ckw h w m 1 1 1− + − = , (4) 212where C, k and wm are the three parameters of the GAB model and h is the relative humidity.
213
The GAB model is used here because it is based on physical phenomena (which yield a 214
correct isotherm shape), it was shown that it can be used almost over the whole RH range 215
and offers the best fit among various adsorption models [37; 40-43]. Moreover this model is 216
widely used in various fields and it has already proven its suitability for cementitious 217
materials [44-46]. The values of the three parameters of the GAB model are reported in Tab. 218
5. 219
Tab. 5. Data for the fitting of the GAB model at 30°C and 80°C. 220 Temperature C [-] k [-] wm [kg/kg] 30°C 4.690 0.592 2.534% 80°C 6.010 0.897 0.480% 221
Looking at Fig. 6, one can easily notice that temperature has a tremendous impact on the 222
first desorption isotherm: at 30°C the curve can al most be described by a straight line from 223
the origin up to the saturation point (w ≈ 5.4%) whereas at 80°C high non-linearity appears. 224
In addition to the alteration of the curve morphology, one can note that for a given RH the 225
water content at equilibrium is always reduced at 80°C (when compared to the values 226
obtained at 30°C). This effect even appears for RH= 100%: an initially saturated sample 227
whose temperature is suddenly increased up to 80°C undergoes a significant mass loss: 228
from 5.4% to 4.6%. The reduction of the water content at equilibrium is not constant over the 229
whole RH range; for instance for RH=100% the difference in the water content is about 0.8% 230
(absolute value) whereas it is about 2.3% for RH=80%. This effect can be, for instance, 231
quantified using the water content ratio (by mass) rw:
232
(
)
(
(
)
)
RH C w RH T w T RH rw , 30 , , ° = . (5) 233Fig. 7 presents the evolution of the water content (by mass) rw as a function of RH for the
234
experiments presented in this study. Data derived from the work of Hundt & Kantelberg [7] 235
are also presented; in this case the two temperatures were 20°C and 70°C, and different 236
cementitious materials were used (hardened cement pastes with different W/C, mortar and 237
concrete with different cures or preconditioning methods). Despite these differences, one can 238
note that the results obtained in this study are in good agreement with the results of Hundt & 239
Kantelberg. The water content ratio appears not to be constant over the full RH range: the 240
general shape of the curve is parabolic and thus presents a minimum value of about 0.3 241
which is roughly located at RH=35%. The maximal value of the ratio rw=0.85 is reached at
242
saturation (for RH=100%). This fact is very important, because it means that the saturation 243
oversaturated when the temperature increases. As a consequence the concrete is out of 245
equilibrium and water is released and evacuated into the environment: this phenomenon can 246
clearly be seen on Fig. 5 on which the mass loss of saturated samples kept at RH=100% and 247
80°C can be seen whereas saturated samples kept at 30°C and RH=100% do not exhibit 248
such behaviour (Fig. 4). 249 0.0 0.2 0.4 0.6 0.8 1.0 0% 20% 40% 60% 80% 100% Relative humidity W a te r c o n te n t ra ti o r w
Hundt & Kantelberg - 70°C/20°C This study - 80°C/30°C
250
Fig. 7. Evolution of the water content ratio rw as a function of RH.
251
4.3.
Pore structure investigation
252
In order to quantify the influence of temperature on the first desorption isotherm, the specific 253
surface area SBET was estimated using the BET model [47]:
254
(
h) (
[
C)
h]
h Cw w m 1 1 1− + − = , (6) 255where C and wm are two positive parameters of the BET model. wm is the mass of water (for
256
one gram of dried material) needed to complete a monomolecular adsorbed layer, its value is 257
used to compute the specific surface area SBET. According to the recommendations of the
258
IUPAC [48] the BET parameters were not estimated using the experimental data from the full 259
RH range. However, due to the lack of experimental data in the low RH (typically between 260
5% and 30%) the fitting interval was extended up to RH=50%. In so doing, it was accepted 261
that this would not yield an accurate value of the specific surface, rather only a rough 262
estimate. The fitted parameters are reported in Tab. 6. 263
Tab. 6. Data for the fitting of the BET model. 264
Temperature 30°C 80°C
C [-] 20.8 22.0
wm [m3/kg] 1.16% 0.35%
SBET [m²/g] 41 13
The specific surface area SBET was estimated using [49]:
265
( )
( )
( )
A w w w m BET T N V A T w T S ρ = , (7) 266where Vw and NA are the molar volume of water (0.1808·10-4 m3/mol and 0.1853·10-4 m3/mol
267
at 30°C and 80°C respectively) and Avogadro’s numbe r (NA = 6.02·1023) and Aw is the area
268
occupied by a single water molecule on the surface of the sample. The latter was estimated 269
using the equation [50; 51]: 270
( )
( )
3 2 091 . 1 = T N M T A w A w w ρ , (8) 271where Mw is the molar mass of water (18·10-3 kg/mol). The resulting coverage areas for one
272
molecule of water Aw are 10.538 Ǻ² and 10.712 Ǻ² at 30°C and 80°C respectively. These
273
values are very close to 10.508 Ǻ² used by Baroghel-Bouny (for 23°C). Many different values 274
were used to calculate SBET in the literature (ranging from 10.5 Ǻ² to 12.5 Ǻ²) leading to
275
discrepancies in the specific surface area estimations and major difficulties of comparison 276
between all the published results [46; 52]. All the data used for the estimation (Vm and Aw in
277
particular) are however reported here which allows to estimate SBET using different data.
278
The specific surface area obtained at 30°C: the res ult is SBET(30°C) = 41 m²/g. This value is
279
consistent with the data published (using water vapour): roughly ranging from 20 to 200 m²/g 280
according to the cementitious material tested and the technique used [15; 22; 29; 52-57]. The 281
value of the specific surface area SBET is divided by 3 when measured at 80°C and falls do wn
282
to SBET(80°C) = 13 m²/g (Tab. 6). These data are comparabl e to the results obtained by Bray
283
& Sellevold [58] and Radjy & Richards [19] who showed that a temperature increase 284
between ambient temperature and 90°C or 100°C resul ted in a decrease of the BET 285
monolayer parameter Vm estimated using water desorption experiments (and thus the
286
specific surface area SBET).
287
In the same time, Mercury intrusion porosimetry (MIP) experiments were performed to 288
highlight the influence of the desorption temperature on pore size distribution. The samples 289
used for the desorption experiments at 30°C and 80° C and kept at RH=3% were used. They 290
were crushed into small parts (several millimetres), frozen by immersion into liquid nitrogen, 291
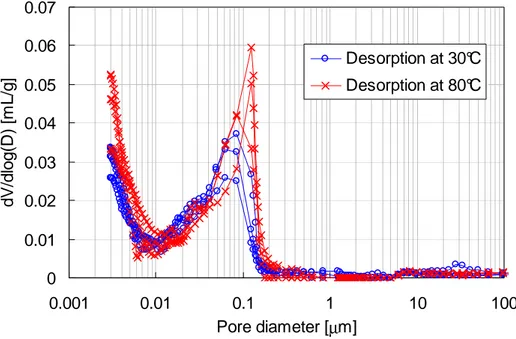
let to dry under vacuum for seven days and then tested at ambient temperature. The results 292
are presented on Fig. 8. One can see that for the two desorption temperatures a bi-modal 293
pore size distribution is obtained corresponding to C-S-H nanoporosity (around 3 nm) and 294
capillary porosity (around 100 nm). For desorption at 30°C, the access diameter for capillary 295
porosity is about 70 nm. Desorption at 80°C appears to slightly shift it towards larger 296
diameters (110 nm) as it was already shown [25; 59]. The variability observed in the intruded 297
volume was not thought to be significant and assumed to be related to the presence of sand 298
and aggregates in the samples together with hardened cement paste. 299 0 0.01 0.02 0.03 0.04 0.05 0.06 0.07 0.001 0.01 0.1 1 10 100 Pore diameter [µm] d V /d lo g (D ) [m L /g ] Desorption at 30°C Desorption at 80°C 300
Fig. 8. Pore size distributions obtained by MIP after desorption at 30°C and 80°C. 301
The specific surface areas estimated using MIP were quite different from the ones derived 302
from desorption. A value of about 10 m²/g after desorption at 30°C was obtained; the same 303
value (12 m²/g) was obtained for desorption at 80°C in contradiction with desorption results. 304
5.
Discussion
305
The (slight) increase of the capillary porosity average access diameter between 30°C and 306
80°C observed using MIP as well as the decrease of the specific surface area are consistent 307
with the desorption isotherm modification: the coarser the pore size, the greater the upward 308
deviation (see for instance [22] for compacted cement pastes; [56; 60] for hardened cement 309
pastes with variable water-to-cement ratio and [61-65] for compacted powders.) Yet one 310
must note that the porosity increase (between 30°C and 80°C, Tab. 3) is not compatible with 311
the fall of the water content at saturation (it is expected to induce a water uptake at saturation 312
leading to mass gain.) The latter may be explained by the decrease of water density when 313
temperature is increased. 314
However these two phenomena are believed by the author to have a small impact on the 315
isotherms: the decrease of water density (at least between 20°C and 80°C) as well as the 316
coarsening of the pore structure as observed using MIP remain very limited. In the author’s 317
mind, these two phenomena cannot explain the important modifications of the desorption 318
isotherm observed between 30°C and 80°C. Moreover t he difference of specific surface 319
areas obtained using the 80°C isotherm and MIP led the author think that another 320
phenomenon directly linked to temperature might be at work. 321
Such a phenomenon can be described as follows: adsorption is an exothermic process [66; 322
67] and according to the principle of Le Chatelier and the rule of Van’t Hoff: the effect of a 323
change in temperature on a system at equilibrium is to shift the equilibrium in the direction 324
that acts to counteract and nullify the temperature change. This means increasing 325
temperature hinders adsorption and promotes desorption; as a consequence a lesser 326
number of molecules can be adsorbed. This phenomenon is very well-known in adsorption 327
on sorption isotherms for different adsorbents and adsorbates [50; 68-73], the results always 329
show the same modifications of the sorption isotherms as described in this paper. 330
Furthermore in adsorption technology, the temperature increase and the heat transfers 331
induced by the heat of adsorption are accounted for the design of the adsorbent beds (to 332
avoid the performance reduction due to temperature increase) and thermal treatments at 333
elevated temperature are usually used as a method to regenerate adsorbents (this method is 334
also know as “temperature swing adsorption”) [73; 74]. 335
This effect can be described using the Clausius-Clapeyron equation which permits the 336
evaluation of the heat involved in a change of phase for a system in equilibrium, in the case 337
of adsorption it can written under the form [66]: 338
( )
( )
( )
w v st T p R w Q ∂ ∂ − = 1 ln , (9) 339where Qst is the isosteric heat of adsorption [J/mol], T and R are the absolute temperature [K]
340
and the universal gas constant (R = 8.3145 J/mol/K) and pv is the water vapour pressure [Pa]
341
at equilibrium with the adsorbed quantity w respectively. In our case the heat of adsorption 342
could be estimated using the two isotherms obtained at 30°C and 80°C using the integrated 343 form of eq. (9): 344
( )
(
(
)
)
− − = w T p w T p T T T T R w Q v v st , , ln 2 1 2 1 2 1 , (10) 345where pv1(w) and pv2(w) are the vapour pressures at equilibrium with the water content w for
346
the temperatures T1 and T2 respectively. In so doing, it was implicitly assumed that the pore
347
size distribution and the water properties remain constant over the whole temperature range. 348
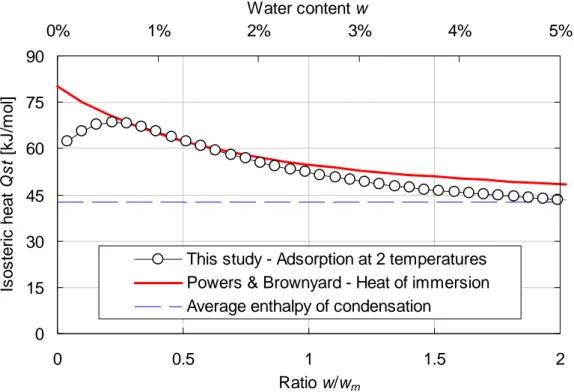
Fig. 9 presents the resulting evolution of the isosteric heat of desorption as a function of 349
water content. One can see that the isosteric heat of desorption is a decreasing function of 350
water content: the high value observed for low water contents is representative of strong 351
bonding between the adsorbed water molecules and the cementitious substrate whereas the 352
decrease can be related to the drop of the influence of the substrate with the increase of the 353
distance between adsorbed water molecules and substrate. The value reached at high water 354
contents is equal to the average enthalpy of condensation (42.7 kJ/mol between 30 and 355
80°C): it can be considered that there is no more i nfluence of the substrate and water 356
molecules are bound the ones to the others (condensation). 357
For verification purpose, the isosteric heat of desorption obtained in this study was compared 358
to the one proposed by Powers & Brownyard [60]. They used the heat-of-solution method on 359
two hardened cement pastes. The method consists in dissolving paste samples in a 360
calorimeter and measuring the heat evolved. Repeated measurements on samples 361
contained different amounts of adsorbed water allowed them to evaluate the isosteric heat of 362
adsorption which can be written under the following form (in kJ/mol): 363
( )
(
)
2 31 . 1 6 . 64 m st w w L w Q + + = , (11) 364where L = 42.7 kJ/mol is the average condensation enthalpy of water within the range 30-365
80°C. The comparison is presented on Fig. 9. One ca n see that except for low values of 366
w/wm (below 0.2), there is a good agreement between the two curves. This fact is important
367
since Powers & Brownyard performed their experiments at constant (ambient) temperature. 368
This seems to indicate that the two phenomena initially identified to explain the influence of 369
temperature (coarsening of the pore structure and water properties evolution) might be 370
negligible in front of the desorption induced by temperature. 371
0 15 30 45 60 75 90 0 0.5 1 1.5 2 Ratio w/wm Is o s te ri c h e a t Q s t [k J /m o l] 0% 1% 2% 3% 4% 5% Water content w
This study - Adsorption at 2 temperatures Powers & Brownyard - Heat of immersion Average enthalpy of condensation
372
Fig. 9. Comparison between the isosteric heat of desorption obtained in this study (two 373
isotherms at two different temperatures and Clausius-Clapeyron) and the one proposed by 374
Powers & Brownyard using heat-of-solution tests (at ambient temperature). 375
Using Clausius-Clapeyron and the corresponding isosteric heat of desorption, it is possible to 376
estimate the water content ratio rw(RH,T) (as defined in eq. (5)) for any arbitrary temperature.
377
Fig. 10 presents the results obtained for temperatures ranging from 35°C to 80°C. One can 378
see that the fall of water content increases with temperature and whatever the temperature, 379
the first desorption isotherm is expected to be modified: there is no threshold temperature. 380
Moreover, the change depends on the temperature level: for a small temperature increase 381
only the low-RH part of the isotherm is expected to be influenced whereas the isotherm is 382
expected to be modified over the whole RH range for higher temperatures. 383
0.0 0.2 0.4 0.6 0.8 1.0 0% 20% 40% 60% 80% 100% Relative humidity W a te r c o n te n t ra ti o r w 45°C 35°C 60°C 70°C 80°C 384
Fig. 10. Evolution of the ratio rw(RH,T) as a function of temperature and relative humidity.
385
6.
Conclusion
386
In the framework of radioactive waste management and especially in the case of interim 387
storage, concrete structures should be submitted to temperature up to 80°C and subsequent 388
drying. The durability assessment of such structures in such unusual conditions thus requires 389
the knowledge of the first desorption isotherm at 80°C. An experimental campaign was thus 390
undertaken to characterize the first desorption isotherms (at 30°C and 80°C) of a French 391
reference concrete for radioactive waste management. This was done using the desiccator 392
method with massive samples. The results showed an important impact of temperature on 393
the first desorption isotherm: 394
1. the general shape of the isotherm is modified and leads to more pronounced 395
non-linearities; 396
2. the water content at equilibrium is drastically reduced at 80°C over the whole RH 397
range; 398
3. the water content at saturation at 80°C is signi ficantly lower than at 30°C. 399
The examination of the results led the author to think that the coarsening of the pore 400
structure and the evolution of water properties could not explain these important 401
modifications and that another phenomenon was at work. The latter consists in desorption 402
induced by temperature and can be described using Clausius-Clapeyron formula. Using the 403
two isotherms acquired, it was possible to evaluate the isosteric heat of desorption and to 404
compare it to the data obtained by Powers & Brownyard using a different method at constant 405
temperature. The two of them are in good agreement. This seems to indicate that the 406
temperature induced desorption is the predominant phenomenon in our experiments (for 407
temperatures less than 80°C.) 408
7.
Acknowledgements
409
This work was part of a project funded by Electricité de France (EdF) and the French agency 410
for radioactive waste management (Andra). The author would like to thank Xavier Bourbon 411
(Andra/DS) and Yann Le-Pape (EdF/DER) for their scientific support and also Guillaume 412
Ranc who has initiated this study, Philippe Pétrini for his help in preparing and performing the 413
experiments. Profitable discussions with Sébastien Charles and Christophe Gallé are 414
gratefully acknowledged. 415
8.
References
416
[1] H. Lagrave, Dossier de définition pour l'entreposage de longue durée des déchets 417
HAVL et des combustibles usés (in french), CEA Internal Report DTEC/2005/10 418
(2005) 55p. 419
[2] H. Lagrave, Dossier de définition de l'entreposage de longue durée des déchets 420
MAVL ou de catégorie B (in french), CEA Internal Report DTEC/2005/11 (2005) 63p. 421
[3] J.-F. Daïan, Processus de condensation et de transfert d'eau dans un matériau méso 422
et macroporeux - Etude expérimentale du mortier de ciment (in french), Ph-D Thesis, 423
Institut National Polytechnique de Grenoble (INPG), 1986, 319p.p. 424
[4] J.-F. Daïan, Condensation and isothermal water transfer in cement mortar, part I - 425
pore size distribution, equilibrium, water condensation and imbibition, Transport in 426
Porous Media 3(6) (1988) 563-589. 427
[5] F. Radjy, E.J. Sellevold, K.K. Hansen, Isosteric vapor pressure-temperature data for 428
water sorption in hardened cement paste: enthalpy, entropy and sorption isotherms at 429
different temperatures, Report BYG-DTU R057, Technical University of Denmark 430
(DTU), Lyngby, Denmark, 2003, 58p. 431
[6] T. Ishida, K. Maekawa, T. Kishi, Enhanced modeling of moisture equilibrium and 432
transport in cementitious materials under arbitrary temperature and relative humidity 433
history, Cement and Concrete Research 37(4) (2007) 565-578. 434
[7] J. Hundt, H. Kantelberg, Sorptionsuntersuchungen an zemestein, zementmörtel und 435
beton (in german), Deutscher Ausschuss für Stahlbeton Heft 297 (1978) 25-39. 436
[8] Z.P. Bažant, W. Thonguthai, Pore pressure and drying of concrete at high 437
temperature, Journal of the Engineering Mechanics Division (ASCE) 104(5) (1978) 438
1059-1079. 439
[9] Z.P. Bažant, J.C. Chern, W. Thonguthai, Finite element program for moisture and 440
heat transfer in heated concrete, Nuclear Engineering & Design 68(1) (1980) 61-70. 441
[10] Z.P. Bažant, W. Thonguthai, Pore pressure in heated concrete walls - theoretical 442
prediction, Magazine of Concrete Research 31(107) (1979) 67-76. 443
[11] B. Bary, A polydispersed particle system representation of the porosity for non-444
saturated cementitious materials, Cement and Concrete Research 36(11) (2006) 445
2061. 446
[12] L.J. Klinkenberg, The permeability of porous media to liquid and gases, American 447
Petroleum Institute, Drilling and Production Practice (1941) 200-214. 448
[13] CEN, Hygrothermal performance of building materials and products - Determination 449
of hygroscopic sorption properties, European Committe for Standardization (CEN), 450
European Standard EN ISO 12571 (2000) 17p. 451
[14] OIML, The scale of relative humidity of air certified against saturated salt solutions, 452
International Organization of Legal Metrology (OIML), Recommendation R 121 (1996) 453
12p. 454
[15] V. Baroghel-Bouny, Water vapour sorption experiments on hardened cementitious 455
materials: Part I. Essential tool for analysis of hygral behaviour and its relation to pore 456
structure, Cement and Concrete Research 37(3) (2007) 414-437. 457
[16] Xu Aimin, Water desorption isotherms of cement mortar with fly ash, Nordic Concrete 458
Research 8 (1989) 9-23. 459
[17] R.M. Espinosa, L. Franke, Influence of the age and drying process on pore structure 460
and sorption isotherms of hardened cement paste, Cement and Concrete Research 461
36(10) (2006) 1969-1984. 462
[18] V. Baroghel-Bouny, B. Perrin, L. Chemloul, Détermination expérimentale des 463
propriétés hydriques des pâtes de ciment durcies - Mise en évidence des 464
phénomènes d'hystérésis (in french), Materials and Structures 30(6) (1997) 304-348. 465
[19] F. Radjy, C.W. Richards, Effect of curing and heat treatment history on the dynamic 466
mechanical response and the pore structure of hardened cement paste, Cement and 467
Concrete Research 3(1) (1973) 7-21. 468
[20] V. Baroghel-Bouny, M. Mainguy, T. Lassabatere, O. Coussy, Characterization and 469
identification of equilibrium and transfer moisture properties for ordinary and high-470
performance cementitious materials, Cement and Concrete Research 29(8) (1999) 471
1225-1238. 472
[21] S. Tada, K. Watanabe, Dynamic determination of sorption isotherm of cement based 473
materials, Cement and Concrete Research 35(12) (2005) 2271-2277. 474
[22] R.S. Mikhail, G.A. Oweimreen, Surface area and pore structure of compressed low-475
porosity cement pastes, Cement and Concrete Research 3(5) (1973) 561-573. 476
[23] CEN, Testing hardened concrete, part I: shape, dimensions and other requirements 477
for test specimens and moulds, European Committee for Standardization, European 478
Standard EN 12390-1 (2001) 10p. 479
[24] J.J. Beaudouin, B.T. Tamtsia, Effect of drying methods on microstructural changes in 480
hardened cement paste: an A.C. impedance spectroscopy evaluation, Journal of 481
Advanced Concrete Technology 2(1) (2004) 113-120. 482
[25] C. Gallé, Effect of drying on cement-based materials pore structure as identified by 483
mercury intrusion porosimetry. A comparative study between oven-, vacuum-, and 484
[26] G.G. Litvan, Variability of the nitrogen surface area of hydrated cement paste,
486
Cement and Concrete Research 6(1) (1976) 139-144. 487
[27] J.J. Beaudouin, J. Marchand, Pore structure, in: V.S. Ramachandran and J.J. 488
Beaudouin (Eds), Handbook of analytic techniques in concrete science and 489
technology, Noyes Publications, Park Ridge, USA, 2001, 528-628. 490
[28] M.C. Garci Juenger, H.M. Jennings, The use of nitrogen adsorption to assess the 491
microstructure of cement paste, Cement and Concrete Research 31(6) (2001) 883-492
892. 493
[29] A. Korpa, R. Trettin, The influence of different drying methods on cement paste 494
microstructures as reflected by gas adsorption: comparison between freeze-drying, 495
D-drying, P-drying and oven-drying, Cement and Concrete Research 36(4) (2006) 496
634-649. 497
[30] J. Adolphs, A. Schreiber, Microstructural characterization of Ultra-High Performance 498
Concrete, in: M. Schmidt, E. Fehling and C. Geisenhanslüke (Eds), Proceedings of 499
the International Symposium on Ultra-High Performance Concrete, Kassel 500
(Germany), Kassel University, 2004, 265-271. 501
[31] I. Pane, W. Hansen, Surface characteriation of blended cements by H2O and N2 502
sorption isotherms, in: J. Weiss, K. Kovler, J. Marchand and S. Mindess (Eds), 503
Proceedings of the the 1st International Symposium on Advances in Concrete through 504
Science and Engineering, Chicago, USA, RILEM PRO048, 2004. 505
[32] B.P. Hughes, I.R.G. Lowe, J. Walker, The diffusion of water in concrete at 506
temperatures between 50 and 95°C, British Journal of Applied Physics 17(12) (1966) 507
1545-1452. 508
[33] N.L. Hancox, The role of moisture diffusion in the drying of cement paste under the 509
influence of temperature gradients, Journal of Physics D: Applied Physics 1(12) 510
(1968) 1769-1777. 511
[34] R. Černy, J. Drchalová, P. Rovnaníková, The effects of thermal load and frost cycles 512
on the water transport in two high-performance concretes, Cement and Concrete 513
Research 31(8) (2001) 1129-1140. 514
[35] S.F. Wong, T.H. Wee, S. Swaddiwudhipong, S.L. Lee, Study of water movement in 515
concrete, Magazine of Concrete Research 53(3) (2001) 205-220. 516
[36] T.C. Powers, H.M. Mann, L.E. Copeland, The flow of water in hardened Portland 517
cement paste, Portland Cement Association Bulletin 106 (1959) 18p. 518
[37] R.B. Anderson, Modifications of the Brunauer, Emmett and Teller equation, Journal of 519
the American Chemical Society 68(4) (1946) 686-691. 520
[38] C. van der Berg, Vapour sorption equilibria and other water-starch interactions: a 521
physico-chemical approach, Ph-D thesis, Agricultural University of Wageningen, The 522
Netherlands, 1981, 186p. 523
[39] S. Brunauer, J. Skalny, E.E. Bodor, Adsorption on non porous solids, Journal of 524
Colloid and Interface Science 30(4) (1969) 546-552. 525
[40] P.-N.T. Johnson, J.G. Brennan, Moisture sorption isotherm characteristics of plantain 526
(Musa, AAB), Journal of Food Engineering 44(2) (2000) 79-84. 527
[41] C.P. McLaughlin, T.R.A. Magee, The determination of sorption isotherm and the 528
isosteric heats of sorption for potatoes, Journal of Food Engineering 35(3) (1998) 529
267-280. 530
[42] A. Jonquières, A. Fane, Modified BET models for modeling water vapor sorption in 531
hydrophilic glassy polymers and systems deviating strongly from ideality, Journal of 532
Applied Polymer Science 67(8) (1998) 1415-1430. 533
[43] L.-T. Lim, I.J. Britt, M.A. Tung, Sorption and transport properties of water in Nylon 6,6 534
Film, Journal of Applied Polymer Science 71(2) (1999) 197-206. 535
[44] Y. Xi, Z.P. Bažant, H.M. Jennings, Moisture diffusion in cementitious materials - 536
Adsorption isotherms, Advanced Cement Based Materials 1(6) (1994) 248-257. 537
[45] S. Bonnet, B. Perrin, Influence de la présence des ions chlorures sur les propriétés à 538
l'équilibre de différents mortiers (chloride influence on equilibrium properties of 539
mortars), Materials and Structures 32(7) (1999) 492-499. 540
[46] A. Xu, Water desorption isotherms of cement mortar with fly ash, Nordic Concrete 541
Research 8 (1989) 9-23. 542
[47] S. Brunauer, P.H. Emmett, E. Teller, Adsorption of gases in multimolecular layers,
543
Journal of the American Chemical Society 60(2) (1938) 309-319. 544
[48] IUPAC, Commission on Colloid and Surface Chemistry: Reporting physisorption data 545
for gas/solid systems with special reference to the determination of surface area and 546
porosity (Recommendations 1984), Pure and Applied Chemistry 57(4) (1985) 603-547
619. 548
[49] J.B. Condon, Surface area and porosity determinations by physisorption - 549
Measurements & theory, Elsevier, 2006, 274p. 550
[50] S.J. Gregg, K.S.W. Sing, Adsorption, surface area and porosity, Academic Press, 551
London, United Kingdom, 1982, 303p. 552
[51] V. Baroghel-Bouny, Caractérisation des pâtes de ciment et des bétons: Méthodes, 553
analyse, interprétations (in french), Presses du Laboratoire Central des Ponts et 554
Chaussées, Paris, France, 1994, 468p. 555
[52] I. Odler, The BET-specific surface area of hydrated Portland cement and related 556
materials, Cement and Concrete Research 33(12) (2003) 2049-2056. 557
[53] J.J. Thomas, H.M. Jennings, A.J. Allen, The surface area of hardened cement paste 558
as measured by various techniques, Concrete Science and Engineering 1(1) (1999) 559
45-64. 560
[54] I. Odler, J. Hagymassy, M. Yudenfreund, K.M. Hanna, S. Brunauer, Pore structure 561
analysis by water vapor adsorption. IV. Analysis of hydrated portland cement pastes 562
of low porosity, Journal of Colloid and Interface Science 38(1) (1972) 265-276. 563
[55] J. Skalny, I. Odler, Pore structure of calcium silicate hydrates, Cement and Concrete 564
Research 2(4) (1972) 387-400. 565
[56] J. Hagymassy, I. Odler, M. Yudenfreund, J. Skalny, S. Brunauer, Pore structure 566
analysis by water vapor adsorption. III. Analysis of hydrated calcium silicates and 567
portland cements, Journal of Colloid and Interface Science 38(1) (1972) 20-34. 568
[57] R.S. Mikhail, S.A. Abo-El-Enein, Studies on water and nitrogen adsorption on 569
hardened cement pastes I - Development of surface in low porosity pastes, Cement 570
and Concrete Research 2(4) (1972) 401-414. 571
[58] W.H. Bray, E.J. Sellevold, Water sorption properties of hardened cement paste cured 572
or stored at elevated temperatures, Cement and Concrete Research 3(6) (1973) 723-573
728. 574
[59] E.J. Sellevold, Mercury porosimetry of hardened cement paste cured or stored at 575
97°C, Cement and Concrete Research 4(3) (1974) 399-404. 576
[60] T.C. Powers, T.L. Brownyard, Studies of the physical properties of the hardened 577
cement paste, Portland Cement Association Bulletin 22 (1948) 356p. 578
[61] P.C. Carman, F.A. Raal, Role of capillary condensation in physical adsorption, Nature 579
167 (1951) 112-113. 580
[62] P.C. Carman, F.A. Raal, Physical adsorption of gases on porous solids I - 581
Comparison between loose powders and porous plugs, Proceedings of the Royal 582
Society of London - Series A, Mathematical and Physical Sciences 209(1096) (1951) 583
59-69. 584
[63] P.C. Carman, Physical adsorption of gases on porous solids II - Calculation of pore-585
size distribution, Proceedings of the Royal Society of London - Series A, 586
Mathematical and Physical Sciences 209(1096) (1951) 69-81. 587
[64] R.G. Avery, J.D.F. Ramsay, The sorption of nitrogen in porous compacts of silica and 588
zirconia powders, Journal of Colloids and Interface Science 42(3) (1973) 597-606. 589
[65] S.J. Gregg, J.F. Langford, Study of the effect of compaction on the surface area and 590
porosity of six powders by measurements of nitrogen sorption isotherms, Journal of 591
the Chemical Society - Faraday Transactions I 73 (1977) 747-759. 592
[66] S. Brunauer, The adsorption of gases and vapors - Volume I - Physical adsorption,
[67] D. Myers, Surfaces, interfaces and colloids - Principles and applications, John Wiley, 595
New York, USA, 1999, 519p. 596
[68] J. Keller, R. Staudt, Gas adsorption equilibria - Experimental methods and adsorption 597
isotherms, Springer Science, Boston, Massachussets, USA, 2005, 422p. 598
[69] A.A. Fomkin, Adsorption of gases, vapors and liquids by microporous adsorbents,
599
Adsorption 11(3) (2005) 425-436. 600
[70] I.I. Salame, T.J. Bandosz, Experimental study of water adsorption on activated 601
carbons, Langmuir 15(2) (1999) 587-593. 602
[71] I.I. Salame, T.J. Bandosz, Adsorption of water and methanol on micro- and 603
mesoporous wood-based activated carbons, Langmuir 16(12) (2000) 5435-5440. 604
[72] D.D. Do, Adsorption analysis: equilibria and kinetics, Series on Chemical Engineering 605
Vol. 2, Imperial College Press, London, United Kingdom, 1998, 913p. 606
[73] R.T. Yang, Adsorbents: fundamentals and applications, John Wiley and Sons, 607
Hoboken, New Jersey, USA, 2003, 425p. 608
[74] M. Suzuki, Adsorption engineering, Elsevier Science, Amsterdam, The Netherlands, 609
1990, 270p. 610
611 612
![Fig. 1. Adsorption curves for a mortar between 20°C and 55°C after Daïan [4].](https://thumb-eu.123doks.com/thumbv2/123doknet/12982834.378457/3.892.109.623.461.810/fig-adsorption-curves-mortar-c-c-daïan.webp)


![Tab. 5. Data for the fitting of the GAB model at 30°C and 80°C. 220 Temperature C [-] k [-] w m [kg/kg] 30°C 4.690 0.592 2.534% 80°C 6.010 0.897 0.480% 221](https://thumb-eu.123doks.com/thumbv2/123doknet/12982834.378457/14.892.101.784.143.210/tab-data-fitting-gab-model-c-c-temperature.webp)