L. Di Giorgio, M. Filippini, G. Masiero
Implications of global budget payment
system on nursing home costs
Implications of global budget payment system on
nursing home costs
L. Di Giorgio M. Filippini y G. Masiero z November 2012
Abstract
Pressure on health care systems due to the increasing expenditures of the elderly population is pushing policy makers to adopt new regulation and payment schemes for nursing home services. We sketch a simple theoreti-cal model to predict the behavior of nursing homes under di¤erent payment schemes. We then investigate the implications of prospective payments on nursing home costs using a panel of 41 homes in Southern Switzerland ob-served over a 12-years period (1999-2010). To evaluate the impact of the recent policy change - from retrospective to prospective payment - we em-ploy a …xed e¤ects model with a time trend that is allowed to change after the policy reform. We …nd evidence that the new payment system reduces costs for nursing home care, ceteris paribus. This result is in line with the theoretical expectations.
Keywords: nursing homes, prospective payment, quality of care, policy change
JEL classi…cation: I18, C23, J33.
Department of Economics, University of Lugano, Switzerland. Corresponding author. Tel.: +41 058 666 4665; fax: +41 058 666 4733. E-mail address: [email protected]. We gratefully thank the Swiss National Science Foundation (SNSF) for the …nancial support for this project.
yDepartment of Economics, University of Lugano; ETH, Zurich, Switzerland.
zDepartment of Economics and Technology Management, University of Bergamo, Italy;
1
Introduction
Increasing health care expenditures for the elderly population is a major concern for society and policymakers. In Europe, the percentage of people over 64 rose rapidly in the past decades and is expected to increase between two and six times by 2060, ranging from 22-25% in Belgium, Denmark, Ireland, and the United Kingdom, to 33-36% in Bulgaria, Germany, Latvia, Poland, Romania, and Slo-vakia. The share of very elderly people (80 and over) in the EU15 experienced the highest increase among all age classes, from 1.2% in 1950 to 4.2% in 2010, and is projected to almost triple (12%) by 2060 in the EU27 (Eurostat, 2012; Eu-ropean Union, 2012). Accordingly, the demand of nursing home care is expected to increase rapidly raising the burden on public resources generally used to cover nursing home costs or to subsidize prices of nursing home services (Karlsson et al., 2006).
In the past 30 years hopes have been pinned on the possibility to control healthcare expenditures by replacing Retrospective (RPS) with Prospective Pay-ment Systems (PPS), mainly in the hospital sector. Under PPS, a predetermined, …xed amount of resources is paid for the service. The rationale is that reimburse-ment based on ex-ante costs prevents health care providers from giving unneces-sary care (Jegers et al., 2002). In the U.S., the use of PPS has been extended from hospitals to the nursing home sector in 1997 through the Balanced Budget Act. Similarly, many European countries have recently incorporated more incentivizing payment systems into their existing funding systems.
Although the health economics literature is rich of studies on the impact of PPS in the U.S. nursing home sector (e.g. Chen and Shea, 2002; Norton, 1992; Zhang et al., 2008), there is little empirical evidence in Europe. A number of studies have been published on the impact of PPS in the hospital sector in di¤erent European countries, for instance Finland (Linna, 2000), Norway (Biorn et al., 2006), and Portugal (Dismuke and Sena, 1999). To our knowledge, the only study on the impact of PPS to …nance nursing home services is the recent analysis by Dormont and Martin (2012) based on a hypothetical scenario. The authors investigate the costs-e¢ ciency trade-o¤ in French nursing homes (NHs) to predict possible implications of a switch in the payment system.
In this paper, we provide evidence on the impact of PPS on the costs of a sample of NHs operating in one Swiss canton (Ticino) by exploiting data before and after the introduction of PPS. Switzerland is a federal state in which the provision and regulation of nursing home care for elderly people is organized at the regional level (cantons). As consequence, 26 very di¤erent nursing home sectors exist. In 2006, the cantonal authority substituted the previously-in-force payment system based on acknowledged …nancial needs (RPS) with an ex-ante determined budget (PPS). To evaluate the impact of this policy change we use an econometric model with …xed-e¤ects (FE) with a time trend that is allowed to change after the policy reform. We will provide evidence that the new payment system reduced costs growth for NH care, after controlling for the quality of services.
The remainder of the paper is organized as follows. Section 2 provides an overview of recent studies analyzing the impact of PPS on costs, quality and access to health care services. Section 3 describes the regulatory reform and proposes a simple theoretical model to infer the behavior of NHs under the old RPS and the new PPS. Data and the identi…cation strategy for the policy change are discussed in section 4. The econometric estimations are presented in section 5, and section 6 concludes the paper.
2
Previous research on the impact of PPS in nursing
home care
The empirical evidence regarding the impact of PPS on costs, quality and access in NHs care is not conclusive. The literature mostly relies on studies conducted during the 90s in the U.S. where PPS were …rstly introduced. Some of these studies focus on the …nancial consequences of PPS by looking at changes in costs (e.g. Ohsfeldt et al., 1991; Sexton et al., 1989). More recently, attention has been devoted to the understanding of cost reduction achievements. Improved methods to control for changes in quality and to cope with the potential endogeneity of output and/or quality in cost functions have been proposed (Gertler and Wald-man, 1992; Chen and Shea, 2002). Also, direct assessment of the impact of PPS on quality (Konetzka et al., 2004; Konetzka et al., 2006) and access to nursing care (Coburn et al., 1993) have been carried out.
Regarding the e¤ects on costs, Sexton et al. (1989) use a two steps strategy to regress e¢ ciency scores calculated using Data Envelopment Analysis on changes in the payment system occurred in the State of Maine in 1982. They …nd a decrease in technical e¢ ciency. Quality variations are assumed to be negligible. Ohsfeldt et al. (1991) exploit variations in the payment systems of 47 U.S. states over a 12-years period using a random e¤ects model. After correcting for endogeneity in the reimbursement system by means of instrumental variables, the authors …nd a reduction of 20 per cent in per diem costs due to PPS.
Coburn et al. (1993) extend the traditional cost analysis by looking at the consequences of PPS on quality and access for Medicaid patients in the State of Maine. The analysis shows that PPS reduces growth in per-patient variable costs. During the …rst three years after the introduction of PPS, the average savings and losses per patient day decreased substantially. Afterward, the authors observed a remarkable increase in the number of NHs experiencing losses. Only the percentage of room and board costs relative to the total variable costs decreased over time, suggesting that cost savings were not achieved through reductions in quality. Finally, the percentage of Medicaid patients decreased, which can be interpreted as a negative impact on access for most severe patients.
Concerns about the evidence obtained during the 90s are raised by Chen and Shea (2002), who question the methodology used. In particular, they point at the inadequate measures of quality and output/quality endogeneity in cost functions. To cope with the endogeneity issue, the authors construct instrumental variables for both output and quality, and investigate the impact of PPS on short-term operating costs. The analysis is performed on a one-year data set of di¤erent U.S. states grouped into three di¤erent payment systems. The authors show that NHs with PPS are no longer signi…cantly cheaper than facilities subject to cost-based retrospective payments, after controlling for quality di¤erences.
More recently Zhang et al. (2008) assessed the impact of PPS on the cost e¢ ciency of 8361 NHs in the U.S. over the period 1997-2003. During this period, three major policy changes occurred. In 1997, the Balance Budget Act (BBA) rati…ed the introduction of PPS. Afterward, the Balanced Budget Re…nement Act (BBRA, 2000) and the Bene…t Improvement and Protection Act (BIPA, 2001)
in-creased the baseline payments in consequence of the …nancial di¢ culties reported by NHs. DEA calculated e¢ ciency scores are regressed on policy change variables identi…ed with time markers and a truncated random e¤ect model is applied. The results show a negative relationship of all policy change variables with e¢ ciency scores. The authors capture quality di¤erences by weighting the output with a score calculated using the number of de…ciency citations.
A growing strand of literature investigates the impact of PPS on quality aspects of nursing home care. Using data on U.S. NHs over the period 1996-2000, Konetzka et al. (2004) study the impact of PPS on quality by applying a di¤erence-in-di¤erence approach and a negative binomial model. The authors use changes in the professional sta¢ ng and the number of regulatory de…ciencies as proxies for quality. As expected, PPS is found to signi…cantly reduce the profes-sional sta¤. The negative impact of PPS is partially corrected by the introduction of the Balanced Budget Re…nement Act. As with respect to regulatory de…cien-cies, only weak evidence is reported. Also, no di¤erences between for-pro…t and nonpro…t NHs are found.
Finally, Konetzka et al. (2006) investigate the spillover e¤ects of introduc-ing PPS in Medicare residents on quality for Medicaid patients. Since facilities cross-subsidize part of the costs of Medicaid residents with the higher margins of Medicare and high private-pay residents, the cuts in revenue due to the in-troduction of PPS may also have a¤ected quality of long-stay residents. Using a quasi-experimental approach in four U.S. states over the period 1995-2000, the au-thors show that PPS has an adverse e¤ect on urinary tract infections and pressure scores.
To conclude, the literature remains inconclusive as with respect to the impact of PPS in nursing home care. Also, it is worth pointing out that most of the studies mentioned are conducted in the U.S. where private for-pro…t facilities represent a large share of total NHs and the environment is increasingly competitive. It is not clear whether this leads to di¤erent behavioral responses as compared to nonpro…t institutions which are largely present in Europe. In competitive environments, the expected negative impact of cost reductions on quality may be mitigated by the need to maintain a high reputation. As suggested by Grabowski and Town
(2011), NHs facing greater competition are more responsive to quality improving projects. However, competition can also have a negative e¤ect on quality if it pushes prices down (Forder and Allan, 2012). Conversely, in a non-competitive, nonpro…t environment with highly regulated prices and quality, such as the Swiss NH sector, the possible negative impact of cost reductions on quality is expected to be limited.
3
The regulatory reform
3.1 Background
In Ticino, nursing home care is provided primarily by regulated public and private nonpro…t organizations. The provision of nursing care is further decentralized at local level (municipalities) and elderly people are commonly assigned to the NH in the community of residence. Therefore, NHs operate as local monopolies with virtually no competition. Price and quality are regulated by the cantonal authority, i.e. the Regional Department of Public Health (RDPH). Prices are subsidized and de…ned by the RDPH as a function of residents’income (pension’s rent) and wealth, and do not vary across NHs. Quality is regulated in many aspects, in particular structural and procedural. Because of tight regulation the production process is highly homogeneous.
In 2006, the cantonal authority in Ticino introduced global budgets for nursing home care. Prior to the introduction of global budgets, subsidies to providers of long term care were allocated by the cantonal authority based on acknowledged …nancial needs; a form of soft budget constraint. The payment system consisted of two parts: a prospectively de…ned component and a retrospective, upward adjustment based on actual costs at the end of the year. The prospective part was an estimation of the costs for the following operative year based on a combination of historical costs and benchmarking parameters at the sector level. At the end of the year, more …nancial resources were paid if the NH was able to justify additional expenses. Conversely, service providers with year-end costs below the initially estimated …nancial need were not allowed to retain the “savings”. The cantonal authority viewed this system as in‡ationary and poorly incentivizing. The low ‡exibility of the system due to the detailed control over all cost items
made it almost impossible for the management to make decisions on the cost structure, and led to low responsibility as with respect to budget decisions and …nancial performance. The funding system had the adverse incentive to spend the whole amount of resources provided.
In the early 2000s, to respond to the need of improving transparency and e¢ ciency in long term care, the RDPH modi…ed the payment system. To develop a new funding system based on prospectively de…ned payment rates, a pilot phase was lunched in January 2003. Five NHs were selected to partecipate to the pilot phase over a three-years period. Information collected during these years were used to de…ne the list of services provided, an analytical accounting system, and a package of modern managerial tools. Since January 2006, the system has been applied to all NHs.
The current payment system (global budget) is composed of two elements: an individual component and a standardized part. The individual component mainly covers …xed costs such as rents and expenses for education trainings. The standard component includes four main categories of costs: residential, animation, care and therapies. Global budgets are calculated by the multiplying standard prices (also called prospective rates in the literature) with quantities. Standard prices stem from the analytical accounting register and re‡ect median costs in the nursing home industry classi…ed into nine categories according to size. Also, standard prices are calculated to implicitly de…ne the level of e¢ ciency and quality desired by the cantonal authority. Quantities are given by the number of beds times the level of occupancy and yearly-days. For nursing care services, the number of resident-days is weighted by the NH-speci…c case-mix index calculated by the RDPH.
The starting prospective rate was determined for the year 2005, while the prospective payment rates for the following years were adjusted for in‡ationary changes of some cost items only (e.g. wages). An adjustment based on savings achieved in the previous years is planned to occur on a medium-term perspective depending on the …nancial stability of the NHs and has not been applied yet.
The …nal budget does not depend on the actual costs generated by the res-idents. NHs with end-year costs lower than the global budget are entitled to
retain a share (25%) of the savings. The main part (75%) are saved as mandatory reserves to cover previous or future de…cits. This system is expected to ensure …nancial stability of nursing care providers in the medium-term.
A discussed possible consequence of the new payment system is the negative impact on quality levels of nursing home services. This risk may be higher with excess of demand since incentives to compete are lower. However, the existing regulation of structural and procedural aspects of the production and provision of nursing home care is expected to strongly limit this possibility. For example, the RDPH de…nes the number of care givers in each NH as well as their education level. To further reduce this potential negative e¤ect, new systems of quality promotion and control in terms of outcome have been integrated.
3.2 A simple model
Before assessing the impact of the new payment system empirically, we sketch a simple theoretical model to illustrate di¤erences in the behaviour of NHs under the old and the new payment schemes, respectively the soft budget constraint (RPS) and the prospective payment (PPS) introduced recently. The demand of nursing home care is independent of prices because fees are established by the RDPH and are homogenous across the canton. Moreover, similarly to Chalkley and Malcomson (1998), the demand of nursing home care does not re‡ect quality.1 Building on Di Giorgio et al. (2012) we de…ne NH total costs as:
C = e e (1)
where e ; is an exogenous cost component with > and probability dis-tribution Pr( = ) = q and Pr( = ) = 1 q, and only partially observable by the regulator.2 The last term (e) in the equation (1) is cost-reducing e¤ort. We
1
The typical arguments supporting this assumption are two. First, patients may not be able to assess the multidimensional nature of quality. Second, quality is partially an experience good and is observable only after receiving care. These aspects are particularly relevant in the case of nursing care due to the type of patients and the nature of the service. Also, in the Swiss context, individuals do not have free choice of the NHs and the allocation occurs according to the place of residence. Finally, the regulator sets quality standards which are equal for all NHs included in the sample, resulting in a very homogenous sector of nursing care.
2
This re‡ects, for instance, the number of days spent by NH residents. While the number of residents per year is known in advance due to an excess of demand, uncertainty remains about
normalize the population of patients to one, so that eq. (1) is also the average cost function. The prospective budget is a function P ( ; q) of costs the NH is expected to incur during the operating year:
P ( ; q) = q + (1 q) . (2)
The NH maximizes the following objective function:
U = W i(B C)2 (e) (3)
where W represents exogenous bene…ts from the production of nursing home ser-vices, and i ( i; ) captures the marginal impact of an unbalanced budget from the ith payment scheme (i [RP S; P P S]) where:
P P S = ( 1) 0 < 1, > 0 (4)
and
RP S = P P S. (5)
Note that two scenarios are possible: over …nancing ( = ) and under …nanc-ing = . Remember that the budget is de…ned by the RDPH as a weighted average of the structural cost parameter (eq. 2). Using (1) and (2), we then observe that for = we have B C > 0 for any level of e¤ort e. Conversely, for = , we have B C 0 for any e 2 [0; ebal].3 Consequently, eq. (3) assumes
that under…nancing reduces NH utility under both payment regimes, RP S and P P S, since > 0. Conversely, incentives for the two regimes di¤er in the case of over…nancing since RP S 6= P P S. Under the old payment regime (RPS), NHs were not allowed to retain resources in excess at the end of the year. Substituting (4) in to (5) and then (5) into the utility function de…ned by (3), we see that pro…ts decrease. Moreover, the marginal impact of pro…ts is generally lower than the marginal impact of losses ( 1 1). Under the new P P S system, NHs are the type and intensity of care needed by residents. Also, uncertainty is related to structural costs for standard daily activities, such as eating and other physical activities, or costs related to the geographical location of the NH.
3Note that the equilibrium level of e¤ort for = is always lower that e
bal. See Table 1 for
entitled to retain resources in excess. Since RP S = P P S, we allow surpluses to increase utility under the P P S regime only. Finally, (e) is the disutility of e¤ort to reduce costs, which is increasing in the level of e¤ort, with d =de > 0 and d2 =de2 > 0. We specify the disutility of e¤ort as (e) = 2e2, with > 2 . The marginal impact of e¤ort on NH’s utility is then captured by the parameter
.
To calculate the optimal level of e¤ort, we …rst substitute (1), (2) and (e) into (3) and derive the following …rst-order condition:
dU
de = 2 i h
( e) q( ) + e i e = 0. (6)
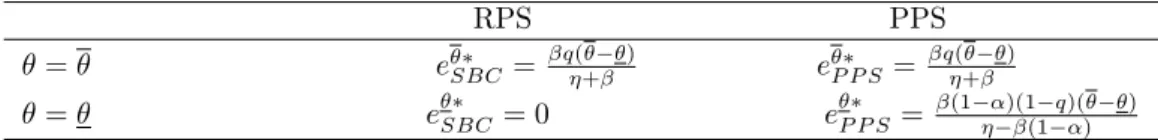
We then solve (6) for the equilibrium level of e¤ort under the two …nancing regimes (RP S and P P S) and scenarios (under…nancing and over…nancing). The results are summarized in Table (1) where = 2 for simplicity.
RPS PPS
= eSBC= q(+ ) eP P S = q(+ )
= eSBC = 0 eP P S = (1 )(1 q)((1 ) )
.
Table 1: Equilibrium level of cost reducing e¤orts under di¤erent payment systems and structural costs.
As expected, no di¤erences in incentives arise between the two regimes in the case of under…nancing ( = ). However, the new regime (P P S) provides more incentives to cost containment in the case of over…nancing if < 1 and > 0.Therefore, the ability of the new payment system to control costs is related to the importance that NHs attach to additional resources, which is captured by ( 1) =2 or ( 1) as de…ned by (4). This weight may be relatively weak since NHs operating in our context are generally nonpro…t …rms. One last consid-eration arises from the impact of the parameter . Since NHs are nonpro…t …rms, may represent not only the marginal cost of e¤ort to reorganize the production process and save costs but also the disutility caused by reducing working time per employee or the number of employees. If those costs are very high (e.g. ! 1), then cost reducing e¤ort tends to zero under both regimes, and incentives are invariant.
4
Empirical speci…cation
4.1 The cost function
To empirically investigate the impact of global budget payments in nursing home care, we exploit data from a natural experiment in Switzerland where the payment system recently changed from RP S to P P S. Similarly to Di Giorgio et al (2012), we assume that NHs transform two inputs, capital and labor, into a single output, measured by the number of patient-days of nursing home care.4 Since the produc-tion process is highly homogenous among NHs, the number of resident-days can represent a good indicator of the level of production. Consequently, we specify a total costs function5 which depends on output (Y ), price of capital and labor (Pk
and Pl), two output characteristics (Q1 and Q2),6 and a general time trend ( ).
C = f (Y; Pk; Pl; Q1; Q2; ). (7)
The price of labor is calculated as the weighted average wage of di¤erent professional categories employed in the NH (doctors, nurses, administrative and technical sta¤), while the price of capital is derived from the residual approach, i.e. labor costs are subtracted from total costs and the residual is divided by the capital stock approximated by the number of beds. Q1is an index which measures
the average patients assistance by means of normal daily activities such as eating, personal care or physiological activities. This is calculated on a yearly basis by the cantonal authority. Patients are classi…ed in one out of …ve categories according to their severity level. A value between 0 and 4 is assigned where higher values indicate more severe cases. Q2 is the nursing sta¤ ratio, that is the ratio between
the number of nurses employed in a NH and the number of nurses that should be employed according to the guidelines of the cantonal authority.
4
In this study we employ a similar model speci…cation to explore a di¤erent research question based on an updated dataset.
5In a non-competitive environment such as the Swiss one, there is no reason to assume that
NHs minimize costs. In this case, the cost function is a behavioral cost function (Evans, 1971) and can still be used to make a comparison among …rms. Moreover, by estimating a total cost function instead of a variable cost function we avoid the risk related to a high correlation between capital stock and output, which leads to a positive relationship between variable costs and capital stock. A similar approach is used, for instance, by Farsi and Filippini (2004).
6
In order to estimate a cost function, either the output is assumed to be homogenous or we need to control for service intensity and patients’characteristics (Birnbaum et al., 1981).
Because nursing home care is a labor-intensive service, the nursing sta¤ ratio can be considered as a good indicator of quality (see for example Johnson-Pawlson and Infeld, 1996; Schnelle et al., 2004). Labor costs represent the main costs of a NH and make about 85 per cent of total costs. Consequently, a small change in the nursing sta¤ ratio may a¤ect total costs considerably. The nursing sta¤ ratio is, therefore, a key variable in our analysis since NHs with relatively high costs may decide to decrease the proportion or the "quality" of workers to save money. If this is the case, then the estimates could su¤er from endogeneity bias. To test the endogeneity of this regressor, we perform the robust Durbin-Wu-Hausman test.7
In order to impose as few restrictions as possible to (7), we adopt a ‡exible translog functional form approximated at the median value. Input prices and total costs are divided by the price of capital in order to satisfy the homogeneity condition in input prices.8 The translog approximation to (7) can be written as:
ln C Pk = Y ln Y + Q1ln Q1+ Q2ln Q2+ Plln Pl Pk (8) +1 2 Y Y(ln Y ) 2+1 2 Q1Q1(ln Q1) 2+1 2 Q2Q2(ln Q2) 2 +1 2 PlPl ln Pl Pk 2 + Y Q1ln Y ln Q1+ Y Q2ln Y ln Q2 + Y Plln Y ln Pl Pk + Q1Plln Q1ln Pl Pk + Q1Q2ln Q1ln Q2 + PlQ2ln Pl Pk ln Q2+ t + "
where " is the error term. We check for the concavity condition in input prices after the estimation.
7
The test is robust to arbitraily violations of conditional homoskedasticity and clustering, and consists in estimating the model by a Generalized Method of Moments (GMM) estimator and applying the Sargan statistic. We perform this test using the lagged value of Q2 as an
instrumental variable. The test statistic is 2 distributed with a robust score 2(1) = 0:49 or F (1; 234) = 0:395. The null hypothesis of exogenous Q2cannot be rejected at any standard level
of signi…cance.
8
The cost function is linear homogenous of degree 1 in input prices when a 10% increase in all input prices leads to a 10% increase in total costs.
4.2 Data and descriptive statistics
Our study builds on data extracted from annual reports delivered to the cantonal authority by all regulated NHs scattered in canton Ticino, Switzerland. The initial data set contains 50 NHs observed over a 12-years period (1999 2010). This period includes the 7-year period before and the 5-year period after imple-mentation of global budgets. From this initial sample, we exclude 5 NHs either because a considerable share of the output (patient-days) is produced in foyers9 or because they show unreasonable values for some variables of interest and are therefore dropped.10 Finally, we exclude the NHs selected for the pilot phase of global budget adoption, for three main reasons: …rst, the pilot phase was mainly intended to set down the rules of the new payment system and to understand its functioning. The new payment system was introduced stepwise and adjusted over time. Second, pilot NHs are few and are observed for a too short period (3 years) to be used as control group. Third, these NHs were not randomly selected.11
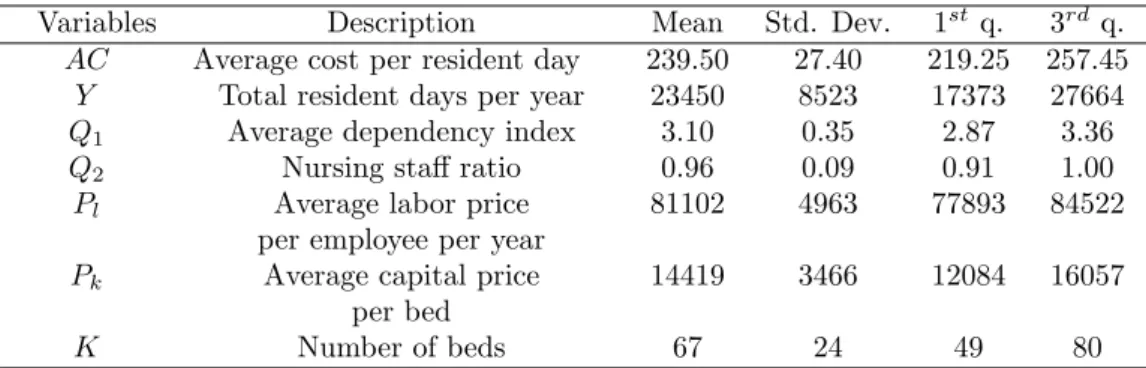
The …nal sample consists of an unbalanced panel of 41 NHs observed for 12 years (471 observations). The minimum number of observations per cluster is 7, while on average information are available over almost the whole period (11:5 years). In Table 2 we report some descriptive statistics of the characteristics of NHs, which include the mean, the standard deviation, and the …rst and third quartiles.
On average, NHs have 67 beds and provides services for 23450 resident days yearly, each of which costs about CHF 240. The nursing sta¤ ratio is 0:96 indi-cating that, on average, the personnel employed by NHs is close to the amount suggested by the cantonal authority. The average price of labor is about CHF 80000 per year, while the price of capital is CHF 14419 per bed.
9Foyers are external residential apartments where the healthiest patients get nursing care.
Therefore, the production process of these NHs might di¤er a lot as compared to the others.
1 0
These are private for-pro…t institutions that have been placed under the cantonal authority and largely subsidized. This implied a change in the production process and hardly comparable data.
1 1
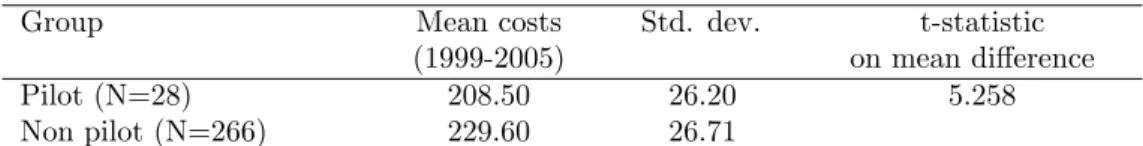
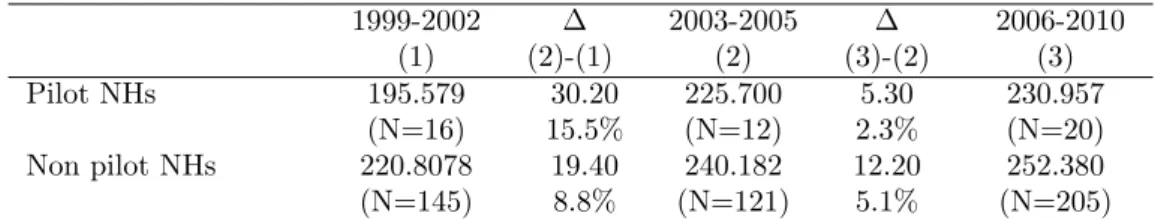
In Table 7 (attached) we show that pilot NHs are relatively cheaper than non pilot NHs. Also, in Tabel 8 (attached) we show that also the cost evolution over time di¤ers between the two groups: pilot NHs experience a more important cost increase before the pilot phase, while from the extended introduction of the new payment system their costs increase relatively less than non pilot NHs.
Variables Description Mean Std. Dev. 1st q. 3rd q. AC Average cost per resident day 239.50 27.40 219.25 257.45
Y Total resident days per year 23450 8523 17373 27664 Q1 Average dependency index 3.10 0.35 2.87 3.36 Q2 Nursing sta¤ ratio 0.96 0.09 0.91 1.00 Pl Average labor price 81102 4963 77893 84522
per employee per year
Pk Average capital price 14419 3466 12084 16057 per bed
K Number of beds 67 24 49 80
Notes: All monetary values are in 2005 Swiss francs (CHF) adjusted by the national Consumer Price Index.
Table 2: Descriptive statistics of costs, inputs and output characteristics over the whole period.
A considerable variation is observed across NHs in almost all variables. The average cost per resident day of the …rst quartile is around CHF 220, and increases to almost CHF 260 in the third quartile. The size of NHs also varies remarkably: three quarter of NHs provide less than 80 beds, and the biggest NH has 145 beds (value not shown). This sizable variation can be read also in the number of resident days.
As with respect to input prices, we recognize that variation in average costs per employee is relatively small (around CHF 6500 per year), whereas average price of capital in the third quartile is 25% higher than in the …rst quartile. This heterogeneity in the price of capital is mainly due to di¤erences in depreciation policies, donations and/or capital structure. In addition, NHs vary in output char-acteristics, i.e. the dependency index and the nursing sta¤ ratio. Note, however, that 50% of NHs have a nursing sta¤ ratio between 0:91 and 1. This is because the cantonal authority allows NHs to deviate from the value of reference by 10% only. Beyond this threshold, the RDPH intervenes to ask for an adjustment in the number of employees.
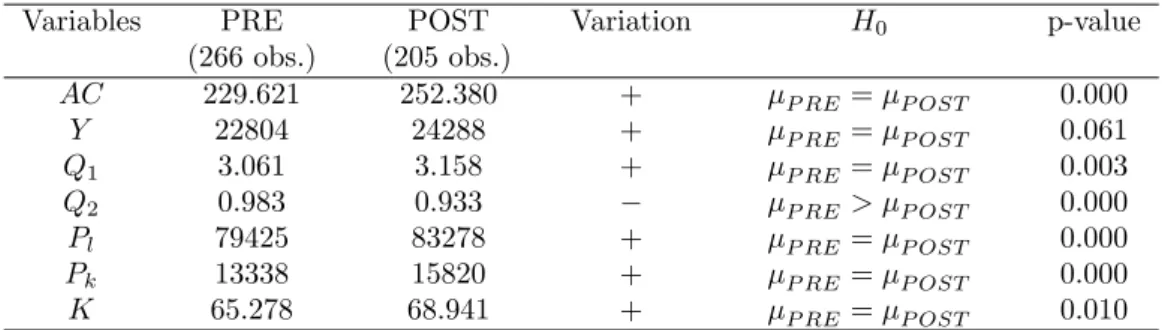
In Table 3 we provide some descriptive statistics for the variables of interest, calculated separately for the period before the change in the payment system (PRE) and the following period (POST). The fourth column speci…es whether the variable mean has increased (+) or decreased ( ). Finally, we report the results of a t-test on the probability of equal means across the two periods. Since cost savings can be achieved through a reduction in the number of sta¤, for the
nursing sta¤ ratio (Q2) we test whether the mean value has decreased (one-sided
t-test).
Variables PRE POST Variation H0 p-value (266 obs.) (205 obs.) AC 229.621 252.380 + P RE = P OST 0.000 Y 22804 24288 + P RE = P OST 0.061 Q1 3.061 3.158 + P RE = P OST 0.003 Q2 0.983 0.933 P RE > P OST 0.000 Pl 79425 83278 + P RE = P OST 0.000 Pk 13338 15820 + P RE = P OST 0.000 K 65.278 68.941 + P RE = P OST 0.010
Notes: all monetary values are in 2005 Swiss francs (CHF) adjusted by the national Consumer Price Index.
Table 3: Comparison of means (pre and post reform) for the main variables of interest.
The pre-post analysis shows a statistically signi…cant increase in average costs (AC), from about CHF 230 per resident day to more than CHF 250. However, since costs have generally increased, these …gures do not allow any inference about the impact of the new payment system. The number of beds and the number of resident days remained pretty constant. As for output characteristics, the analysis shows that the dependency index has slightly increased while the nursing sta¤ ratio decreased by 5% points. The increase in the dependency index may be due to the increasing demand of nursing home care over time and the shift of less severe residents to home care services. Also, it shows that, as expected, NHs did not respond to the change in the payment system by selecting healthier patients. Conversely, NHs may have responded to the change in the payment system by reducing the number of nurses per resident. The issue is discussed in more detail in section 5.3.
4.3 Identi…cation strategy
At the bottom of any policy evaluation lays a missing data problem. In fact, an in-dividual or a …rm can always be observed only in one state: either in the program or not. The challenge of any evaluation analysis consists, therefore, in construct-ing an appropriate counterfactual. When the policy change occurs for only a few subjects under investigation or it is implemented gradually at di¤erent points in time, a battery of evaluation methods can be considered (Blundell and Dias, 2000;
2009; Nichols, 2007). Among the methods available for panel data, we …nd the di¤erence-in-di¤erence approach (DID), the matching estimator, the regression discontinuity designs (RD), selection models (also called control functions), struc-tural models, the regression approach, and the counterfactual analysis. All these methods are motivated by the omitted-variable bias since correlation of policy identifying variables with other unobservable variables might lead to an incorrect assessment of the policy.
As pointed out by Blundell and Dias (2009), the choice of the most appropriate evaluation method relies on the nature of the policy change, as well as the research question and data availability. In our study, the policy change concerns all NHs in the sample at the same time. For this reason we can just observe the treated group before and after the policy change. Therefore, to measure the impact of global budget payment we exploit the panel properties of the dataset. The under-lying idea is to use information on di¤erent points in time for the same individual as own group of control (individual e¤ects). We use a panel data model that controls for unobserved heterogenity and includes a temporal dummy variable to capture the impact of the policy change. This strategy assumes that no other ma-jor event occured over the period considered which a¤ected the production costs of NHs. We are con…dent that, in our case, this assumption is not too restrictive. First, because the NH sector is highly regulated and no other policy reforms have occurred during the same period. Second, the resulting homogenous production process makes it relatively easy to compare NHs and reduce the unobserved het-erogeneity to negligible levels.12 Consequently, time varying unobserved factors
are not expected to have remarkable e¤ects on the results. Finally, input prices and costs have been de‡ated with the CPI. Hence, reduction in costs due to the recent economic recession should not be counfounded with cost savings generated by the new payment system.
We capture the impact of PPS on costs with a dummy variable equal to 1 for the years 2006 2010, the period where the PPS was in force, in addition to a general time trend capturing the impact of technical change on costs throughout the whole period. This is the approach adopted in many policy evaluation studies
1 2That unobserved heterogeneity is negligible is proved also by the similarity of the …xed e¤ects
when the policy change a¤ects all …rms/individuals at the same time (e.g. Hat-ton, 2005; Nakahara et al., 2010; Narayana and Pengb, 2006; Rotte and Vogler, 1999).13
When adopting this identi…cation strategy, particular attention needs to be devoted to the speci…cation of the time trend. In fact, a mispeci…ed time trend may partially capture the impact of the policy change. Hence, to explore the pattern of nursing care costs over time, we estimate a cost model where we replace the time trend with time dummies and drop the policy change dummy. The base year is 1999. The estimated coe¢ cients for time dummies show that from 2001 to 2005 total costs increase linearly. Afterward, i.e. during the the introduction of PPS, total costs remain pretty constant. This pattern suggests modeling the time trend with a linear function.14
Assume the following general speci…cation of the dummy variable in the total costs function in (8):
ln Cit Pkit
= i+ XitT T + dD + tt + tdtD + vit, (9)
where XitT is the vector of explanatory variables, D is the dummy that assumes value equal to 1 in the period of policy implementation (2006 2010), and 0 otherwise, and the error component " has been splitted into an individual e¤ect
i and a stochastic error term vit.
The impact of the policy reform can now be measured in two ways, depending on how the dummy variable is allowed to enter the cost function. By imposing
td = 0, we restrict the attention to policy changes that a¤ect only the constant
term of the total cost function. In this case, dummy variable shifts are interpreted as the average impact of PPS on costs during the whole period 2006 2010. Alternatively, if we allow td 6= 0, the impact of PPS can change over time, and
additional information can be provided on the rate of costs increase. We refer to these two time trend speci…cations as the restricted …xed-e¤ ects model and
1 3
Remind that the pilot group cannot be used to apply a DID approach for three main reasons. First, treatment was not randomly assigned. Second, the treated group (pilot NHs) includes only few observations. Finally, the pilot phase was used to set up the new payment system and some rules changed afterwards.
1 4A di¤erent speci…cation of the time trend shows that the inclusion of a squared term leads
the unrestricted model.15 These will be estimated and compared in the following section. Since the cost model is in log-log form, the estimated coe¢ cient of the policy dummy variable is interpreted as percentage change in total costs for small values of the coe¢ cients, and semi-elasticity for higher values.
By identifying the policy change with a time dummy, we implicitly assume that in the absence of reform, total costs in the period 2006-2010 would have increased at the same rate as in the period 1999 2005. Since economic growth may have an impact on the evolution of prices, for example wages, and therefore costs. Indeed, the Consumers Price Index (CPI) decreased in the last years considered in the analysis. To control for changes in costs related to variations in the economic cycle, we then adjust cost and input prices for the CPI.16
5
Econometric estimation and results
5.1 Estimation approach
In order to choose the most adequate panel data model, we perform a series of tests on our NHs dataset. Since the likelihood ratio test rejects the null hypothesis of homoskedasticity ( 2(40) = 175:68, p-value = 0:000), heteroskedasticity-robust tests and estimation methods are considered. We examine the …xed-e¤ect model (FE), the random e¤ect model (RE), and the …rst di¤erence model (FD) discussed in Nichols (2007) to create the counterfactual using observations on the same unit over time. These methods remove the bias due to unobserved characteristics that
1 5
A battery of speci…cation tests was also performed. First, we checked whether the reform a¤ected other coe¢ cients by building interaction terms of each explanatory variable with the policy dummy (D) and did not …nd signi…cant evidence. An alternative approach would consist of estimating two di¤erent models, one before the reform and one after the reform, and compare the estimated coe¢ cients. However, this strategy allows individual e¤ects to di¤er between the two periods, which is not desirable. Finally, we used a stochastic frontier approach to estimate several models, such as the pooled frontier with Mundlak correction (Farsi at al., 2005) and the true random e¤ect model. The impact of the reform was analyzed in two ways: …rst, we introduced the policy dummy into the deterministic part of the frontier, and second, we compared the calculated mean ine¢ ciencies using the non parameteric Kruskal-Wallis test. All the model speci…cations and approaches used con…rm the evidence that the new payment system reduced total costs.
1 6
According to the cantonal law (RL 2.5.4.5 ), salaries and indemnities for public employees are adjusted using the national Consumer Price Index. Since labor costs represent the largest proportion of total costs (up to 85%), to de‡ate total costs and input prices seems an appropriate choice.
remain constant over time by adding individual-speci…c e¤ects. Nevertheless, it is still necessary to control for the panel structure of the dataset, namely for errors correlated within groups (Cameron and Miller, 2010). If part of the bias is due to unobservable time-varying factors, our results may still be biased.
The di¤erence between the FE estimator and the FD estimator consists mainly in the underlying assumption about the speed at which the policy reform a¤ects the outcome. The FE estimates compare the mean outcome before the policy reform with the mean outcome in the period after the reform. Instead, the FD model assumes that the reform has a one-shot e¤ect at the moment of its intro-duction. Therefore, the impact is fully captured by a jump in outcome in the year 2006. We rule out the FD model for two reasons. First, from a policy point of view the relevant question is what are the implications of the new payment system in the medium term. Second, the introduction of PPS involves a series of changes that need time to be understood, implemented and optimized.
Both the FE and the RE models include individual-speci…c e¤ects that allow to control for any constant unobserved heterogeneity, but they di¤er in the way they consider these e¤ects. The FE model treats the individual-e¤ects as …xed parameters and allows them to be partially correlated with regressors, accommo-dating a limited form of endogeneity (Cameron and Trivedi, 2010). In a policy evaluation study this property is of particular relevance. The su¢ cient condition for consistency of the FE model is E[XitT("it "i)] = 0, i.e. the policy
vari-able is allowed to be correlated with the persistent component of the error term, the unobserved heterogeity , but not with deviations from the mean, ("it "i)
(Wooldridge, 2002). Three main requirements need to be satis…ed when a FE model is applied. First, to avoid the so called incidental parameters problem, the panel has to be long enough relative to the number of …rms. Second, the main variable of interest has to vary over time since the FE precludes the estimation of time-invariant regressors. Third, the percentage within variation of the variables of interest as with respect to the overall variation should be large enough to avoid unprecise estimates (Cameron and Trivedi, 2005). Instead, the RE model instead assumes that the unobservable individual e¤ects are random variables distributed independently of the regressors, that is: i ( ; 2) and vit (0; v2), and
the coe¢ cients are estimated with the Generalized Least Square (GLS) method. Therefore, no correlation between the individual e¤ects and the error term is per-mitted. The main disadvantage of the RE model is that the estimates are a¤ected by the heterogeneity bias when the exogeneity assumption is not satis…ed, and are, therefore, inconsistent.
To choose between the FE and the RE models we perform the robust version of the Hausman test using the arti…cial regression approach originally described in Arellano (1993).17 The null hypothesis of regressors uncorrelated with the group speci…c e¤ects is rejected at the 99% level (F (14; 484) = 8:27, p-value = 0:000). Also, the analysis of the within variation of each variable of the cost function shows that the percentage within variation over total variation is satisfactory for all variables of interest.
Standard errors are corrected using the cluster robust estimator based on Stock and Watson (2006).18 The authors show that the cluster-robust estimator is preferred in FE models if serial correlation is expected, and it is reasonable to rely on asymptotic theory. In our sample, the number of clusters is satisfactory to rely on asymptotic theory for accurate inference (Kezdi, 2004). Also, each cluster contains a su¢ cient number of observations.19
5.2 Results
Through our regression analysis we are able to control for factors explaining vari-ation in costs over time not related to changes in the payment system. As a consequence, we disentagle the general increase in costs from the impact of policy change. In Table 4 we present the estimated coe¢ cients of the restricted and unrestricted FE models speci…ed in the previous equation (9). The number of
1 7
The standard Hausman test assumes that the RE model is e¢ cient. A comparison of the clustered and non clustered standard errors show that this assumption in violated in our case. When this is the case, the robust Hausman test should be used. This approach consists in re-estimating the RE model augmented with the original regressors transformed into deviations from the mean.
1 8
When dealing with panel data, the assumption of independently and identically distributed errors (iid) is mostly violated due to three main reasons: heteroskedasticity, within-cluster cor-relation and serial corcor-relation.
1 9
Kezdi (2004) states that a sample of 50 clusters is close enough to in…nity for accurate inference if the number of observations for cluster is not too small. A cluster is considered small if it contains less than …ve observations per cluster (Rogers, 1994).
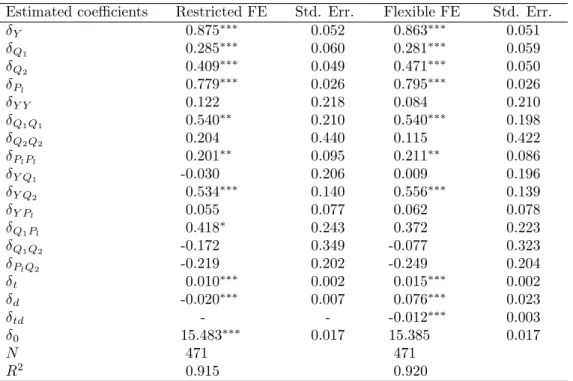
observations (N ) and the model …t statistic R2 within are also provided. The models explain about 92% of the variation in the data.
Estimated coe¢ cients Restricted FE Std. Err. Flexible FE Std. Err.
Y 0.875 0.052 0.863 0.051 Q1 0.285 0.060 0.281 0.059 Q2 0.409 0.049 0.471 0.050 Pl 0.779 0.026 0.795 0.026 Y Y 0.122 0.218 0.084 0.210 Q1Q1 0.540 0.210 0.540 0.198 Q2Q2 0.204 0.440 0.115 0.422 PlPl 0.201 0.095 0.211 0.086 Y Q1 -0.030 0.206 0.009 0.196 Y Q2 0.534 0.140 0.556 0.139 Y Pl 0.055 0.077 0.062 0.078 Q1Pl 0.418 0.243 0.372 0.223 Q1Q2 -0.172 0.349 -0.077 0.323 PlQ2 -0.219 0.202 -0.249 0.204 t 0.010 0.002 0.015 0.002 d -0.020 0.007 0.076 0.023 td - - -0.012 0.003 0 15.483 0.017 15.385 0.017 N 471 471 R2 0.915 0.920
Notes: Signi…cance levels: * = 10%, ** = 5%, *** = 1%.
Table 4: Results of the restricted and unrestricted …xed e¤ect models. Since the …rst-order coe¢ cients are very similar in both speci…cations (re-stricted and unre(re-stricted model), we focus the discussion on the re(re-stricted FE model. The output coe¢ cient ( Y) measures the total costs elasticity with respect
to output. A value lower than 1 suggests the presence of unexploited economies of scale in the NH sector. In our case it indicates that an increase by 10% in the number of resident-days would increase total costs by about 8:75%.
The parameter estimates of output characteristics ( Q1 and Q2) show a
pos-itive and highly-signi…cant value meaning that total costs increase with patients severity and our quality indicator for the service provided, i.e. the nursing sta¤ ratio. These coe¢ cients can also be interpreted as cost elasticities. The case-mix coe¢ cient ( Q1) indicates that a 10% increase in patients severity increases costs
by almost 3%. More important, a 10% increase in the nursing sta¤ ratio ( Q2)
leads to a total costs increase of 4%. The input prices coe¢ cient ( Pl) is positive
the vector of input prices. This coe¢ cient provides information on the percent-age of labor costs over total costs of a representative NH. The estimated share of labor costs is around 80%, which is very close to the actual sample mean (83%). Consequently, capital costs represent is around 20% of total costs.
The estimated parameter ( t) is highly signi…cant and indicates that, on
av-erage, total costs increase by 1% each year (1:5% in the unrestricted model). In-creasing costs can be explained by inIn-creasing wages not associated to augmented productivity (Baumol, 1967), the adoption of more costly technologies or new procedures implemented in the whole sector due for example to new regulatory settings. This result con…rms the intuition on average costs emerged from the descriptive analysis presented in Table 3. The second-order coe¢ cients show the percentage variation in …rst-order coe¢ cients in response to a percentage vari-ation in the regressors. We observe that the second-order coe¢ cient of output ( Y Y) is not statistcally signi…cant, meaning that there is no evidence of
decreas-ing economies of scale. Total costs grow at increasdecreas-ing rates with patients severity ( Q1Q1) and labor price ( PlPl).
Our main coe¢ cients of interest are those related to the impact of the reform. In the restricted FE model, the impact of the policy change is captured by the dummy variable coe¢ cient ( d), which measures the average impact of PPS over
the whole period considered. As discussed above, costs increased by roughly 1% yearly from 1999. However, the negative and highly signi…cant coe¢ cient of the policy dummy suggests that the reform reduced mean total costs by 2% from its introduction in 2006. Concerning the unrestricted FE model, the impact of the policy reform is allowed to vary in each year and is given by the combination of changes in the intercept and slope coe¢ cients of the time trend ( d and td).
The intercept of the time trend increases by 7:6%. However, the slope coe¢ cient decreases by 1:2%. The e¤ect of the reform on costs in di¤erent years is given by T C = 0:076 0:012(t 1998), where t 2006. The e¤ect is 0:02 in 2006, 0:032 in 2007, 0:044 in 2008, 0:056 in 2009 and 0:068 in 2010. Hence, in …ve years the new payment system led to a reduction in costs of roughly 6:8%.
It is worth noticing that we estimated the impact of the policy change after controlling for quality, measured by the nursing sta¤ ratio (Q2). As shown in the
descriptive statistics, the nursing sta¤ ratio has slighly decreased after the reform. However, the relationship between the nursing sta¤ ratio and quality may not be straightforward. Although the relative number of nurses has decreased, it might be that their productivity has increased to preserve the quality of services provided to the residents. Improved managerial/organizational practices induced by the reform and hardly measurable, for instance, may have o¤set the small reduction in the nursing sta¤ ratio. We remind the reader that the nursing sta¤ ratio is periodically controlled by the cantonal authority who forbids NHs falling below a given threshold. Therefore, small reductions in Q2can be interpreted as a positive,
cost-reducing e¤ect of PPS.20This may also explain why our endogeneity test fails to reject the exogeneity hypothesis.
6
Conclusions
Because of increasing healthcare costs and continuous pressure on public expen-ditures to provide healthcare and residential services to the elderly population, prospective payment systems may represent a promising way to enhance e¢ ciency in nursing home care. Few empirical studies investigated the e¤ects of PPS in nursing home care, mostly relying on U.S. data.
In 2006, the Italian speaking canton of Switzerland (Ticino) introduced global budgets to …nance NHs. Through this paper we provided new evidence on the impact of PPS in the form of global budgets on the performance of NHs.
Among important di¤erences as with respect to the nursing home sector in the U.S., our context is characterized by nursing home services mainly provided by nonpro…t …rms as local monopolies. We investigated the impact of PPS on the costs of providing NH care using a panel data set of 41 nursing homes observed for a 12-years period from 1999 to 2010. The impact of the policy change was captured by s time dummy included in panel data models. A counterfactual approach was also considered to predict costs in the absence of a policy change.
2 0
We perform some sensitivity analysis. For example, we include a dummy variable for the organizational form. Although the coe¢ cient is statistically signifcant, it does not a¤ect the estimates of the policy dummy. We also perform the analysis without controlling for the level of nursing sta¤ ratio. The estimated coe¢ cient of the dumy variable is larger, as expected. We decide to include Q2 in the cost function to provide more conservative estimates of the impact
In this case, the policy impact was calculated as di¤erence between predicted and observed costs.
Our analysis shows that the new payment system had a mild impact on costs after controlling for quality aspects using the nursing sta¤ ratio. The new payment system reduced costs by about 7% after …ve years of policy implementation. This relatively mild e¤ect can be interpreted based on the theoretical predictions. First, we know that PPS changed incentives only for the over…nanced NHs. Second, these incentives are reduced by the fact that NHs are allowed to use only part of the savings in an autonomous way (25%). And …nally, the model predicts that if NHs attach a high weight to "human costs" of reorganizing the working conditions of their employees to reduce costs, then NHs may be better o¤ by not reducing costs. Coversely, we believe that additional resources make NHs better o¤, as these allow them to carry out new projects.
Concluding, we found evidence of a cost reducing e¤ect of PPS in the nonpro…t nursing home sector in canton Ticino, Switzerland. This result is in line with the theoretical prdictions of our simple behavioral model. Eventhough we are aware that we cannot fully control for unobserved factors that may have a¤ected the cost dynamics of NHs during the period observed, we are con…dent that in the present context the assumptions made to identify the impact of PPS are not only tenable but also very realistic.
References
ARELLANO M. (1993). On the Testing of Correlated E¤ects with Panel Data. Journal of Econometrics, 59, 87-97.
BIORN, E., HAGEN, T.P., IVERSEN, T. and MAGNUSSEN, J. (2006). Heterogeneity in Hospitals’ Responses to a Financial Reform: A Random Coe¢ cient Analysis of The Impact of Activity-Based Financing on E¢ ciency. RA Paper 8100, University Library of Munich, Germany, 1-34.
BIRNBAUM, H., BISHOP, C., LEE, A. and JENSEN, G. (1981). Why Do Nursing Home Costs Vary? The Determinants of Nursing Home Costs. Medical Care, 19(11), 1095-1107. BLUNDELL, R. and DIAS, M.C. (2000). Evaluation Methods for Non-Experimental Data. Fiscal Studies, 21(4), 427-468.
BLUNDELL, R. and DIAS, M.C. (2009). Alternative Approaches to Evaluation in Em-pirical Microeconomics. The Journal of Human Resources, 44(3), 565-640.
CAMERON, A. C. and MILLER, D. L. (2010). Robust Inference with Clustered Data. In: A. Ullah and D. E. Giles (eds.), Handbook of Empirical Economics and Finance, CRC Press, 1-28.
CAMERON, A. C. and TRIVEDI, P. K. (2005). Microeconometrics. Methods and Ap-plications. Cambridge University Press: New York.
CAMERON, A. C. and TRIVEDI, P. K. (2010). Microeconometrics Using Stata. Revised Edition. Texas: Stata Press. Chambers, R. G. (1988). Applied Production Analysis. Cambridge: Cambridge University Press.
CHALKLEY, M. and MALCOMSON, J.M. (1998). Contracting for health services when patient demand does not re‡ect quality. Journal of Health Economics, 17, 1-19.
CHEN, L.W. and SHEA, D.G. (2002). Does prospective Payment Really Contain Nursing Home Costs? Health Services Research, 37(2), 251-271.
COBURN, A.C., FORTINSKY, R., McGUIRE, C. and McDONALD, T.P. (1993). E¤ect of Prospective Reimbursement on Nursing Home Costs. Health Service Research, 28(1), 45-68.
DI GIORGIO, L., FILIPPINI, M. and MASIERO, G. (2012). The impact of the insti-tutional form on the cost e¢ ciency of nursing homes . Quaderno N. 12-03, Facoltà di Scienze Economiche, Università della Svizzera italiana.
ef-…ciency and productivity of diagnostic technologies in Portuguese public hospitals? An empirical analysis using parametric and non-parametric methods. Health Care Manage-ment Science, 2(2), 107-16.
DORMONT, B. and MARTIN, C. (2012). Quality of service and cost-e¢ ciency of French nursing homes. 9th European Conference on Health Economics (ECHE), Zurich, July 18-21, 2012.
EUROSTAT: EUROSTAT STATISTICS (2011). http://epp.eurostat.ec.europa.eu/sta-tistics_explained/index.php/Population_structure_and_ageing, Accessed June 2012. EUROPEAN UNION (2011). http://europa.eu/rapid/pressReleasesAction.do?reference= STAT/11/80&type=HTML, Accessed June 2012.
EVANS, R.G. (1971). “Behavioural”Cost Functions for Hospitals, The Canadian Journal of Economics, 4(2), 198-215.
FARSI, M. and FILIPPINI, M. (2004). An empirical analysis of cost e¢ ciency in non-pro…t and public nursing homes. Annals of Public and Cooperative Economics, 75(3), 339-365.
FARSI, M., FILIPPINI, M. and M. KUENZLE. (2005). Unobserved Heterogeneity in Stochastic Cost Frontier Models: An Application to Swiss Nursing Homes. Applied Economics, 37, 2127-2141.
FORDER, J. and ALLAN, S. (2012). Competition in the English nursing homes market. PSSRU Discussion Paper 2820, 1-29.
GERTLER, P.J. and WALDMAN, D.M. (1992). Quality-adjusted Cost Functions and Policy Evaluation in the Nursing Home Industry. Journal of Political Economy, 100(6), 1232-1256.
GRABOWSKI, D.C. and TOWN, R.J. (2011). Does Information Matter? Competition, Quality, and the Impact of Nursing Home Report Cards. Health Services Research, 46, 1698-1719.
HATTON, T.J. (2005). Explaining trends in UK immigration. Journal of Population Economics, 18(4), 719-740.
HOROWITZ, M.J. (2007). Changes in Electricity Demandin the United States from the 1970s to 2003. The Energy Journal, 28(3), 93-120.
JEGERS, M., KESTELOOT, K., DE GRAEVE, D. and GILLES, W. (2002). A typology for provider payment systems in health care. Health Policy 60(3), 255–273.
JOHNSON-PAWLSON, J. and INFELD, D.L. (1996). Nurse sta¢ ng and quality of care in nursing facilities. J Gerontol Nurs, 22(8), 36-45.
KARLSSON, M., ROBERT PLUMB, L.M. and RICKAYZEN, B. (2006). Future costs for long-term care. Cost projections for long-term care for older people in the United Kingdom. Health Policy, 75(2), 187–213.
KÉZDI, G. (2004). Robust Standard Errors Estimation in Fixed-E¤ects Panel Models. Hungarian Statistical Review Special, 9, 96-116.
KONETZKA, R.T., NORTON, E.C., SLOANE, P.D., KILPATRICK, K.E. and STEARNS, S.C. (2006). Medicare Prospective Payment and Quality of Care for Long-Stay Nursing Facility Residents. Medical Care, 44(3), 270-276.
KONETZKA, R.T, Yi, D., NORTON, E.C. and KERRY, E.K. (2004). E¤ects of Medicare Payment Changes on Nursing Home Sta¢ ng and De…ciencies. Health Services Research, 39(9), 463-487.
LINNA M. (2000). Health care …nancing reform and the productivity change in Finnish hospitals. J Health Care Finance, 26(3), 83-100.
NAKAHARA, S., POUDELA, K.C., LOPCHANB, M., POUDELC, O.R., POUDEL-TANDUKARA, K. and ICHIKAWAA, M. (2010). Di¤erential e¤ects of out-of-home day care in improving child nutrition and augmenting maternal income among those with and without childcare support: A prospective before–after comparison study in Pokhara, Nepal. Health Policy, 97(1), 16–25.
NARAYANA, P.K. and PENGB, X. (2006). An Econometric Analysis of the Deter-minants of Fertility for China, 1952–2000. Journal of Chinese Economic and Business Studies, 4(2), 165-183.
NICHOLS, A. (2007). Causal inference with observational data. The Stata Journal, 7(4), 507-541.
NORTON, E.C. (1992). Incentive regulation of nursing homes. Journal of Health Eco-nomics, 11, 105-128.
OHSFELDT, R.L., ANTEL, J.J. and BUCHNAN, R.J. (1991). The E¤ect of Prospec-tive Payment on Medicaid Payment Rates for Nursing Home Care. Southern Economic Journal, 58(1), 54-64.
ROGERS, W.H. (1994). Regression standard errors in clustered samples. Stata Technical Bullettin, 13, 19-23.
ROTTE, R. and VOGLER, M. (1999). The E¤ects of Development on Migration: The-oretical Issues and New Empirical Evidence, IZA Discussion Papers 46, Institute for the Study of Labor (IZA).
SCHNELLE, J. F., SIMMONS, S. F., HARRINGTON, C., CADOGAN, M., GARCIA, E. and BATES-JENSEN, B. (2004). Relationship of Nursing Home Sta¢ ng to Quality of Care. Health Services Research, 39, 225–250.
SEXTON, T.R., LEIKEN, A.M., SLEEPER, S. and COBURN, A.F. (1989). The impact of Prospective Reimbursement on Nursing Home E¢ ciency. Medical Care, 27(2), 154-163.
Appendix
Average costs per resident-day in pilot NHs are signi…cantly lower than in non-pilot NHs in the period before the full implementation of the reform (Table 5). In Table 6 we report the average costs of NHs in three di¤erent periods: the period prior the pilot phase (1999 2002), the pilot phase (2003 2005), and the period of full policy implementation (2006 2010). Average costs have increased in both groups between the …rst and the second period by about CHF 30 (15:5%) for pilot NHs, and CHF 20 (8:8%) for non-pilot NHs. Average costs have also increased between the second and the third period at lower rates. Since pilot NHs experienced a more remarkable increase in costs between the …rst period and the second period, the subsequent increase of only CHF 5 (2:3%) suggests that they reacted more strongly to the new payment system than non-pilot NHs (5:1%).
Group Mean costs Std. dev. t-statistic (1999-2005) on mean di¤erence Pilot (N=28) 208.50 26.20 5.258 Non pilot (N=266) 229.60 26.71
Notes: All monetary values are in 2005 Swiss francs, adjusted by the national Consumer Price Index.
Table 5: Average costs comparison between pilot and non-pilot NHs for the whole period.
1999-2002 2003-2005 2006-2010 (1) (2)-(1) (2) (3)-(2) (3) Pilot NHs 195.579 30.20 225.700 5.30 230.957 (N=16) 15.5% (N=12) 2.3% (N=20) Non pilot NHs 220.8078 19.40 240.182 12.20 252.380 (N=145) 8.8% (N=121) 5.1% (N=205)
Notes: All monetary values are in 2005 Swiss francs, adjusted by the national Consumer Price Index.
Table 6: Average costs comparison between pilot and non-pilot NHs in di¤erent periods.
CEPRAWORKINGPAPER
01/2012
V. Galasso, P. Profeta, When the state mirrors the family : the design of pension systems
02/2012
E. García-Morán, Z. Kuehn, With strings attached : grandparent-provided child care,
fertility, and female labor market outcomes
03/2012
Z. Song, K. Storesletten, Y. Wang, F. Ziliotti, Sharing high growth across generations :
pensions and demographic transition in China
04/2012
L. Crivelli, P. Salari, Fiscal federalism and income redistribution through healthcare
financing : an empirical analysis for the Swiss cantons
01/2013
L. Di Giorgio, M. Filippini, G. Masiero, Implications of global budget payment system on