HAL Id: hal-03176177
https://hal.sorbonne-universite.fr/hal-03176177
Submitted on 22 Mar 2021
HAL is a multi-disciplinary open access
archive for the deposit and dissemination of
sci-entific research documents, whether they are
pub-lished or not. The documents may come from
teaching and research institutions in France or
abroad, or from public or private research centers.
L’archive ouverte pluridisciplinaire HAL, est
destinée au dépôt et à la diffusion de documents
scientifiques de niveau recherche, publiés ou non,
émanant des établissements d’enseignement et de
recherche français ou étrangers, des laboratoires
publics ou privés.
Benjamin Fildier, William Collins, Caroline Muller
To cite this version:
Benjamin Fildier, William Collins, Caroline Muller. Distortions of the Rain Distribution With
Warm-ing, With and Without Self-Aggregation. Journal of Advances in Modeling Earth Systems, American
Geophysical Union, 2021, 13 (2), �10.1029/2020ms002256�. �hal-03176177�
1. Introduction
The strength of the global hydrologic cycle can be compactly summarized by the global statistical distribu-tion of rain. The properties of this distribudistribu-tion emerge from the interplay between a variety of atmospher-ic processes, from the large-scale energy budget and atmospheratmospher-ic general circulation to short convective processes. Its asymmetry, or “unevenness,” is related to the sporadic nature of rain on all scales and to the relative importance between dry areas, drizzle, and more active regimes of convection (Pendergrass & Knutti, 2018). As surface temperatures rise, the breadth of the distribution is stretched further by the tiered increases in mean and extreme precipitation (Pendergrass & Hartmann, 2014a), driven, respectively, by large-scale changes in atmospheric radiative cooling and the shorter-scale response of convection to atmospheric moistening (and, in particular, the Clausius-Clapeyron formula) (Allen & Ingram, 2002). Em-ulating the relevant atmospheric radiative and convective processes with simple scaling approximations
Abstract
We investigate how mesoscale circulations associated with convective aggregation can modulate the sensitivity of the hydrologic cycle to warming. We quantify changes in the full distribution of rain across radiative-convective equilibrium states in a cloud-resolving model. For a given Sea Surface Temperature (SST), the shift in mean rainfall between disorganized and organized states is associated with a shift in atmospheric radiative cooling, and is roughly analogous to the effect of a 4K SST increase. With rising temperatures, the increase in mean rain rate is insensitive to the presence of organization, while extremes can intensify faster in the aggregated state, leading to a faster amplification in the sporadic nature of rain. When convection aggregates, heavy rain is enhanced by 20%–30% and nonlinear behaviors are observed as a function of SST and strength of aggregation feedbacks. First, radiative- and surface-flux aggregation feedbacks have multiplicative effects on extremes, illustrating a non-trivial sensitivity to the degree of organization. Second, alternating Clausius-Clapeyron and super-Clausius-Clapeyron regimes in extreme rainfall are found as a function of SST, corresponding to varying thermodynamic and dynamic contributions, and a large sensitivity to precipitation efficiency variations in some SST ranges.The potential for mesoscale circulations in amplifying the hydrologic cycle is established. However, these nonlinear distortions question the quantitative relevance of idealized self-aggregation. This calls for a deeper investigation of relationships which capture the coupling between global energetics, aggregation feedbacks and local convection, and for systematic tests of their sensitivity to domain configurations, surface boundary conditions, microphysics, and turbulence schemes.
Plain Language Summary
Convective aggregation, or organization, is known to affect the spatial distribution of clouds, the wind circulation and the intensity of rain as a result of feedbacks that couple convective processes, radiative transfer in the atmosphere and energy fluxes from the Earth's surface. We investigate how the hydrologic cycle responds to warming in various conditions of forcing and aggregation feedbacks in a hierarchy of idealized simulations, and provide a fine characterization of the statistical distribution of rain in order to connect its modes of change to the physical drivers involved in aggregation. The critical role of precipitation efficiency, namely the fraction of rainwater that reaches the surface, is advanced. The complex behavior of the rain distribution in these simulations feeds a discussion on the use of idealized experiments to investigate convective organization and on their relevance to understand future changes in the hydrologic cycle.© 2020. The Authors.
This is an open access article under the terms of the Creative Commons Attribution-NonCommercial License, which permits use, distribution and reproduction in any medium, provided the original work is properly cited and is not used for commercial purposes.
Benjamin Fildier1 , William D. Collins2,3 , and Caroline Muller1
1Laboratoire de Météorologie Dynamique/IPSL, ENS, PSL Université, École Polytechnique, Institut Polytechnique de
Paris, Sorbonne Université, CNRS, Paris, France, 2University of California, Berkeley, CA, USA, 3Lawrence Berkeley
National Laboratory, Berkeley, CA, USA
Key Points:
• In aggregated radiative-convective equilibrium (RCE), the mean rainfall rate is larger, but its relative increase with warming is similar to that of disorganized RCE
• Rainrates are sensitive to the strength of aggregation and are enhanced when aggregation feedbacks are combined • In the presence of aggregation,
extreme rain can increase faster than Clausius-Clapeyron because of increasing precipitation efficiency
Supporting Information: • Supporting Information S1 • Figure S1 • Figure S2 • Figure S3 • Figure S4 Correspondence to: B. Fildier, [email protected] Citation:
Fildier, B., Collins, W. D., & Muller, C. (2021). Distortions of the rain distribution with warming, with and without self-aggregation. Journal of
Advances in Modeling Earth Systems, 13, e2020MS002256. https://doi. org/10.1029/2020MS002256
Received 21 JUL 2020 Accepted 3 DEC 2020
has enabled linking specific processes to the statistical properties of rain and their change with warming (Fildier et al., 2018; O'Gorman & Schneider, 2009; Pfahl et al., 2017), identifying sources of uncertainty in climate models (Fildier & Collins, 2015; O'Gorman & Schneider, 2009) and comparing the behavior of different modeling strategies (Fildier et al., 2017). In particular, one common deficiency to most modeling frameworks is the scale separation between the large-scale circulation and small-scale convective processes due to limitations in computing capabilities. The resulting inability of models to represent the full contin-uum of scales responsible for the spatial organization of convection raises the central question motivating this work: as the climate warms, how could changes in the mesoscale circulations involved in the spatial structure of rain affect its global statistics?
Warmer air holds more water vapor, and to first order that tends to cause an increase in extreme precip-itation intensities at the 6%–7%/K rate of the Clausius-Clapeyron formula (CC-scaling) (O'Gorman & Muller, 2010). In several cases, departures from this thermodynamic reference have been noted because of dynamical effects related to circulation changes: when convection is parameterized in general circu-lation models (GCMs) (Fildier et al., 2017; O'Gorman & Schneider, 2009; Pall et al., 2006), as well as on short-time scales for regional extremes with respect to local temperatures (Lenderink et al., 2017; Loriaux et al., 2013). However, in cases of radiative-convective equilibrium (RCE, when atmospheric radiative cooling is fully balanced by latent convective heating in the absence of lateral inflow or outflow), the CC-scaling seems to hold with respect to global temperature when convection is simulated at the kilom-eter scale (Fildier et al., 2017; C. Muller & Takayabu, 2020; C. J. Muller et al., 2011; Romps, 2011). Depar-tures from the CC scaling in RCE have been noted at low temperaDepar-tures in response to changes in hydro-meteors fall speeds and precipitation efficiency across microphysics schemes (Singh & O'Gorman, 2014). In addition, mesoscale circulations are generally unresolved, since the simulated convection is either in a disorganized state (random, or pop-up convection) or superparameterized (Grabowski, 2001; Khair-outdinov & Randall, 2001) in a coarse-grid GCM (Fildier et al., 2017), and this missing piece can also potentially affect the sensitivity of extremes to warming. One notable approach to overcome these mode-ling limitations is the use of long channel RCE simulations on cloud-resolving scales, for which extreme rain rates show a general consistency with the CC-scaling (Cronin & Wing, 2017) and small departures at low temperatures (Abbott et al., 2020). More generally, different modeling configurations are still to be explored; hence, the question of the effects of mesoscale circulations on extreme rainfall in a changing climate remains open.
The approach chosen here is to use a cloud-resolving model (CRM) in a square mesoscale RCE domain that exhibits spatial organization in the form of convective self-aggregation (see, e.g., Wing et al. [2017] for a review). This idealized setup is a specific case of organization, since convective organization can also encompass more general features observed such as mesoscale convective systems (Maddox, 1980) or patterns of shallow convection (Bony et al., 2020; Feingold et al., 2010). More generally, organization can also occur in GCMs (Coppin & Bony, 2015), with or without convective parameterization, and under various conditions of forcing (Wing et al., 2017). Under homogeneous boundary conditions, convection can also organize in squall lines due to imposed wind shear (C. Muller, 2013). Although changing the degree of organization (squall lines in that study) can lead to up to a doubling of extreme rainfall rates, for a given degree of organization the intensification of precipitation extremes with warming remains similar to the Clausius-Clapeyron theoretical expectation, close to about 7%/K with warming. Here instead, we will focus on the amplification of precipitation extremes when convection spontaneously self-aggregates, without any large-scale forcing or shear. In this modeling setup, a mesoscale circulation develops within the RCE domain, and this circulation is explicitly coupled to the resolved convective processes.
Here, the internal circulations of interest emerge spontaneously in response to internal feedbacks which drive and maintain the system into a lower energy state (Emanuel et al., 2014). Self-aggregation feedbacks involve, in particular, the spatial heterogeneities in longwave radiative fluxes (C. J. Muller & Held, 2012) and wind-induced evaporation (Bretherton et al., 2005). In this case, it takes the form of a moist patch where convection is active, surrounded by a much drier region which lets the system lose more energy radiatively to space. This organized RCE state corresponds to different mean climate properties and climate sensitivity than the disorganized RCE state (Mauritsen & Stevens, 2015), as well as heterogeneous thermodynamic
properties that could have substantial effects on the characteristics of the hydrologic cycle (Tan et al., 2015; Tobin et al., 2013).
The potential role of self-aggregation on precipitation extremes in the framework of RCE has been highlighted by several studies. At the coarse resolutions of GCMs, Pendergrass et al. (2016) show that precipitation extremes could increase faster with warming than the CC rate because of a changing de-gree of organization, and because aggregation may be more likely to occur above a critical Sea Surface Temperature (SST) threshold (Emanuel et al., 2014; Held et al., 1993; Wing & Emanuel, 2014). Bao et al. (2017) further confirmed this diagnostic by showing that the ratio of extreme-rainfall-increase to mean-rainfall-increases is greater for larger degrees of organization. However, using an idealized CRM and fixed SST, Bao and Sherwood (2018) noticed that the statistical distribution of instantaneous pre-cipitation does not change with the degree of aggregation because increases in prepre-cipitation efficiency are compensated by a reduced updraft speed of condensing parcels. This behavior appears independent from the microphysics scheme chosen in their study. These apparent contradictions raise the question: Can self-aggregation lead to stronger mean and extreme precipitation, and can it amplify their increase with global warming?
We perform a series of CRM simulations in radiative-convective equilibrium (RCE) with fixed SSTs be-tween 300 K and 308 K. Following most earlier studies of self-aggregation, for simplicity, we neglect the Earth's rotation. This is a reasonable approximation for the study of deep tropical clouds, as the Coriolis parameter is small at low latitudes. The radiative and surface-flux feedbacks are alternately turned on or off to constrain the system in organized and disorganized states, to vary the strength of aggregation, and to remove some methodological differences for more adequate comparison with previous studies. The general procedure and simulations are introduced in Section 2. Section 3 quantifies the separate roles of convective organization and surface temperatures on the distribution of rain and describes the different behavior of organized and disorganized precipitation with warming. Section 4 investigates which mechanisms involved in self-aggregation affect the strength of mean and extreme rain, in particular the circulations induced and reinforced by the radiative and surface-flux feedbacks. Section 5 investigates the thermodynamic and dy-namic response of extreme events themselves in order to explain their sensitivity to the circulation. Because the relevance and strengthening of convective organization in future climates is an active area of research, we discuss the sensitivity of these results to the simulation design, and argue for future investigations of how the coupling between global climate and local convection can be modulated by these mesoscale circu-lations (Section 6).
2. Methodology
2.1. Numerical Experiments
We perform a series of experiments using the System for Atmospheric Modeling (SAM) version 6.10.10 (Khairoutdinov & Randall, 2003). This anelastic CRM uses as prognostic variables liquid and ice static ener-gy and non-precipitating and precipitating water. Outputs are saved on hourly averages. All runs analyzed use a 4 km grid resolution and a 1,024-km square domain with doubly-periodic horizontal boundary con-ditions. The vertical grid has 64 levels with a resolution of 500 m at the tropopause and 50 m at the surface; in the upper levels a sponge layer is added to prevent gravity wave reflection. The following parameteriza-tions are used: a 1.5-order subgrid-scale turbulent kinetic energy closure for turbulent processes, the native 1-moment scheme for microphysics, and the CAM3 radiation scheme (Collins et al., 2006). Surface fluxes are calculated from Monin-Obukhov similarity theory. The model is forced with a fixed solar constant of 650 W/m2 at a 50.0° angle, typical mean insolation of equatorial regions, and with uniform SSTs of 300, 302,
304, and 306 K. It is run to RCE before analysis.
The experiments performed in this paper are summarized in Table 1 at each SST. The reference simula-tions are the first two lines. The organized run ref has interactive surface fluxes and interactive, locally computed radiation to allow spontaneous aggregation due to the surface and radiative feedbacks. In the reference disorganized run ref, the radiative feedback is removed by homogenizing the radiative heating rates at each time step in the horizontal dimensions similar to Muller and Held (2012), while the
sur-face fluxes are kept interactive (the sursur-face feedback alone is not always sufficient to trigger or maintain organization, e.g., Holloway and Woolnough [2016]). Both ref and ref are initialized from a disorganized RCE state obtained on a smaller square domain 128-km wide, used for spin up at each SST. Because the equilibration time scale of atmospheric humidity is about 40 days for disorganized runs and 80 days for organized simulations, ref is run for 100 days and ref for 150 days, and the last 50 days of each run are used for analysis. Comparing ref and ref for different SSTs allows us to quantify the overall effect of organization on extreme rainfall.
2.2. Separate Effects of Aggregation: Circulation-Reinforcing Feedbacks and Mean Climate Shift
The additional experiments shown on Table 1 are designed to separate the distinct roles that organization can have on the strength of mean and extreme rainfall intensities: “circulation effects,” associated with the horizontal heterogeneities maintained by the radiative feedback and further strengthened by the sur-face flux feedback, and “mean effects,” associated with shifts in the domain-averaged atmospheric radia-tive cooling and surface fluxes. Indeed, convecradia-tive organization is associated with the development of a large-scale circulation, with low-level divergence from dry regions and low-level convergence into moist regions (C. J. Muller & Held, 2012). This large-scale circulation is believed to be driven by differential radiative heating rates between moist and dry regions (C. Muller & Bony, 2015). Convective organization is also accompanied by enhanced domain-mean outgoing longwave radiative cooling to space (Wing & Emanuel, 2014), as the free troposphere dries in the subsiding environment. This entails a stronger do-main-averaged radiative cooling and by energy conservation a larger dodo-main-averaged surface enthalpy flux.
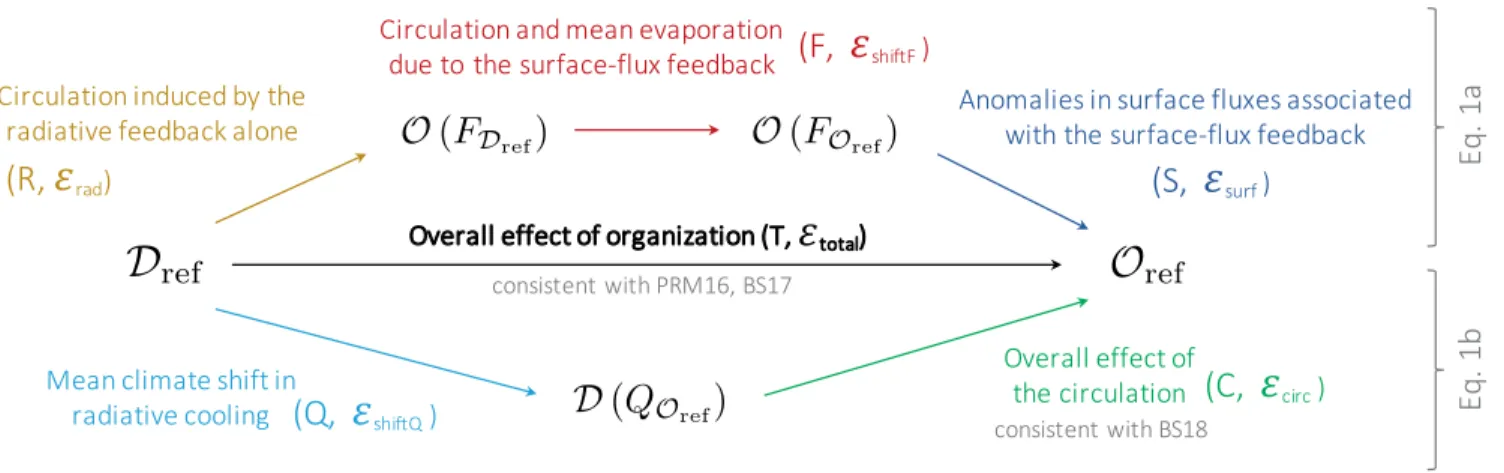
Overall, this distinction between heterogeneities and domain-averages is artificial because these elements likely interact in a nonlinear fashion. But this exercise will help to emphasize the role of the spatial heter-ogeneities on the strength of extremes, as well as to highlight that changes in mean climate state induced by organization mainly affect the domain-mean rainfall rather than the extremes. Figure 1 explains which pairing of experiments can be used to estimate the role of these individual processes on the intensity and change in extreme rainfall. These three simulations are initialized from the end state of ref and run for 100 days to achieve a robust steady state.
The two pathways drawn in Figure 1 can be decomposed into a product of enhancement factors for pre-cipitation, as follows: P P P P P P
ref ref ref
ref ref rad
ref ref ref shift surf
P P (1a)Name Radiative heating rates Surface fluxes Expected RCE state Duration Days analyzed
ref
Interactive, heterogenous Interactive, heterogenous Organized 150 days Last 50
ref
Interactive, homogenized Interactive, heterogenous Disorganized 100 days Last 50
ref
Interactive, heterogenous Prescribed from ref Organized 100 days Last 50
ref
Interactive, heterogenous Prescribed from ref Organized 100 days Last 50
ref
Radiative heating profile prescribed from ref Interactive, heterogenous Disorganized 100 days Last 50
Table 1
and ref ref ref ref ref shift P P P P P
P ref circ (1b)where P(X) is the precipitation statistic of interest (the mean, or an extreme percentile) for simulation X. Simulations
ref
and
ref
use fixed sensible and latent heat fluxes, but interactive radiation to allow organization to persist. These prescribed surface fluxes are diagnosed from the end states of ref andref
, respectively, as averages in space across the domain and in time over the last 50 days of simulation. The comparison proceeds as follows. The organized
ref
and the disorganized ref have the same mean surface fluxes, which emphasizes the role of the circulation induced by the radiative feedback alone on the intensity of extremes. The only difference between ref and
ref
are the surface-flux spatial structure, so that their differences highlights how the circulation is reinforced by the spatial structure of the sur-face-flux feedback. Differences between
ref
and
ref
represent to first order the mean shift in the atmospheric energy budget between the disorganized and organized states, which is apparent in the surface fluxes themselves in steady state.The last simulation
ref
uses a uniformly prescribed radiative cooling profile chosen as the domain mean profile at equilibrium in the ref simulation, and interactive surface fluxes to leave the system free to reach RCE. The absence of a radiative feedback constrains the system in a disorganized state in a similar manner as Bao and Sherwood (2018) and facilitates comparison with their results. By comparing
ref
with ref, it also enables isolation of the shift in mean atmospheric radiative cooling that is, induced by organization: it represents the effect of mean climate shift on precipitation intensities when convection remains disorganized, that is, without any adjustment in the circulation. Instead, differences between
ref
and represent the full effect of the circulation independently from changes in the mean ref climate, because their mean radiative cooling profile is identical while being in two different states of organization.
The relationships between these simulations and their physical interpretation introduced above are summarized in Figure 1. The main effect of organization (central arrow) will be described in Section 3
and the upper and lower pathways shown in the figure will be further analyzed and commented in Section 4.
Figure 1. Summary of the experiments and their relation to individual mechanisms. The same color coding is used in later figures. Arrows are labeled with symbols for defining enhancement factors (Equation 1) and letters for plotting them (Figure 8). References included are Pendergrass et al. (2016) (PRM16), Bao et al. (2017) (BS17), and Bao and Sherwood (2018) (BS18).
2.3. Methodological Limitations
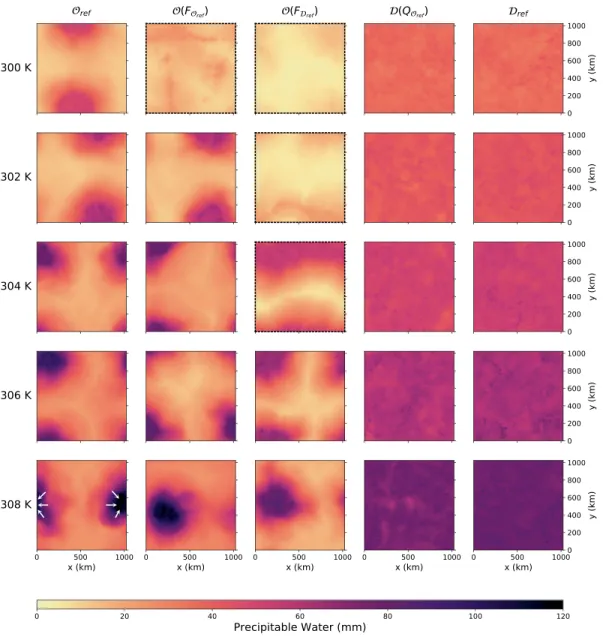
Figure 2 shows 2D snapshots of precipitable water PW at the end of the simulation for all simulation types and all SSTs. In some cases with fixed surface fluxes at the lowest SSTs, represented with a dashed frame in Figure 2, the system cannot maintain its aggregated states. These runs display oscillations in the spatial pattern of convection, where the convectively-active regions alternate between a small circular shapes and elongated stripes, and this behavior gradually leads to a strong drying of the entire domain (not shown). Because of the lack of robustness of the organized state, these runs will not be analyzed in this article. All organized simulations show 20–30 days oscillations (Figure S1b) while all disorganized runs are show a more robust statistical equilibrium (Figure S1a). After calculating sampling errors from bootstrapping on an increasing multi-day window, we say that these oscillations do not cause uncertainty on the estimate of extreme rainfall (not shown). However, they do cause slight errors on the estimate of mean rainfall: Fig-ure S1c shows the difference between estimates of mean precipitation in
ref
and ref averaged for anFigure 2. Snapshots of precipitable water for all SSTs (rows) and all simulation types (columns) at the end of the
simulation. Simulation details are provided in Table 1. Arrows are hand-drawn on one of the simulations to indicate the direction of the low-level circulation. Simulations shown in dashed frames are discarded from the analysis because their final states do not stay robustly aggregated. SST, Sea Surface Temperature.
increasing number of days starting from the end of the simulation. This measure was expected to reach zero at 50 days, and it did not, which suggests that even on 50 days time scales, the simulations are slightly out of mass equilibrium because of these large oscillations, since both runs have identical mean surface fluxes averaged over the last 50 days. This difference also appears on Figure 5a at the 306K.
3. Organized Precipitation is Heavier and Intensifies Faster with Warming
3.1. Acceleration of the Hydrologic Cycle Amplified by OrganizationWe first investigate differences between the organized and disorganized simulations about precipitation statistics and their change with warming, using the 300–304 K range as a reference (Figure 3).
3.1.1. Simultaneous Characterization of Mean and Extreme Rainfall
Characteristics of the hydrologic cycle are quantified by calculating the full distribution of rainfall intensi-ties and rainfall amounts. Rainfall intensiintensi-ties, or percentiles, are expressed in kg/m2/s or mm/day and are
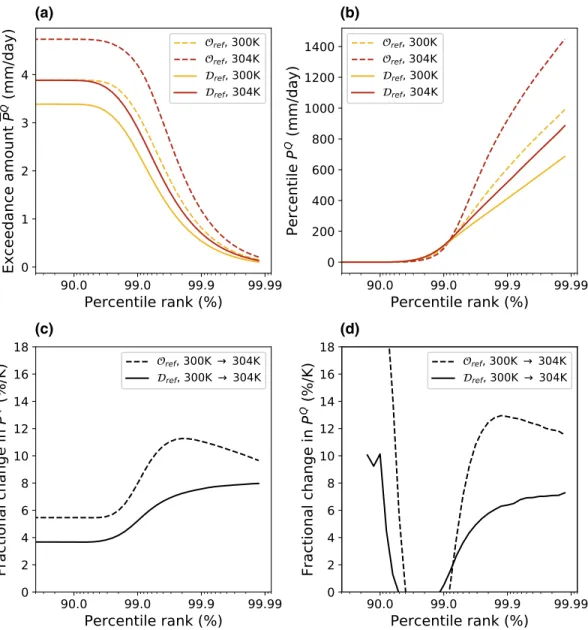
Figure 3. Comparison of statistical distribution of precipitation for the organized (dashed) and disorganized (solid)
experiments at 300 K (yellow) and 304 K (red). Statistics are shown for individual climates (upper row) along with the corresponding fractional changes with warming (lower row) for exceedance amounts PQ (left panels) and percentiles
PQ (right panels).
(a)
(b)
calculated on hourly time scales at each percentile of the distribution of rain, including wet and dry points. Percentiles PQ are chosen on an inverse-logarithmic scale of percentile ranks (…,90th, 99th, 99.9th,…) with
10 bins regularly spaced per decade, to zoom on the extremes. This metric is traditionally used as a way to quantify extreme precipitation (Fildier et al., 2018; Muller & O'Gorman, 2011; Pall et al., 2006) that facili-tates interpreting rain intensities in terms of return times or frequencies of occurrence (…, 1 1, , 1
10 100 1000,…). The second metric is rainfall exceedance amount P , also used by Pendergrass and Knutti (Q 2018): it has the same units as PQ and is calculated by averaging the rainfall intensities above each percentile PQ:
Q 1 Q ( ) Q P P f Q dQ (2) where f(Q) is the frequency of points in the Qth percentile bin. This integrated approach enables a more comprehensive characterization of the hydrologic cycle by quantifying mean and extreme rainfall simul-taneously. At the lowest percentiles, P0 corresponds to the domain mean rainfall and is controlled by the domain mean atmospheric energy budget, while at the largest percentiles with Q → 1, PQ is the mean rain rate falling inside the most intense events that are controlled by convective processes. As a result, PQ/P0 represents the fraction of global rain which falls in the form of extremes.
The distributions of exceedance amounts PQ (Figure 3a) reveal several general features of the changes in the hydrologic cycle induced by convective organization and SSTs. Here we show specific temperatures (300–304K) but this behavior is qualitatively similar for other temperature ranges. Two modes of change in the distribution of rain can be observed on these curves (with a similar physical interpretation as Pend-ergrass and Hartmann (2014a), although the statistical representation differs); although these two modes are not exactly independent (more on this in Section 6), they enable an intuitive understanding of how the distribution should respond to changes in the energy budget and in local convective dynamics/ther-modynamics. First, a horizontal shift of PQ toward the right (higher percentile rank Q) shows that rain becomes more extreme, meaning that given amounts of rain fall within fewer precipitation events, which is consistent with convection being more active. This mode can also be seen more clearly in Figure 4a, when normalizing by P. Second, a vertical shift of PQ at fixed Q is characteristic of the increase in domain-mean rainfall that is consistent with changes in the atmospheric energy budget (Fildier & Collins, 2015; Pender-grass & Hartmann, 2014a). These two shifts can either occur from changes in SSTs (different colors) or in the degree of convective organization (different line types). When fractional changes in PQ are calculated at fixed percentiles (Figure 3c), it also becomes apparent that convective organization could be simultaneously associated with larger rates of increase in domain mean rainfall (left end of the curve) and extreme rainfall (right end) as surface temperatures rise, in comparison to the disorganized case.
Focusing on the response of extreme rain intensities, it appears that PQ can be amplified by convective
organization or SST (Figure 3b) and that the aggregation-driven enhancement of extremes is exacerbated with warming (Figure 3d). Note that the magnitudes of PQ are large because they are computed on scales
of 1 h and 4 km; 1,000 mm/day approximately corresponds to 40 mm/h, which is realistic for hourly ex-tremes. Consistent with the CC scaling, extreme disorganized precipitation intensities increase at about 6%–7%/K, whereas organized extremes increase faster with warming, at 12.5%/K for this specific pair of SSTs (Figure 3d).
3.1.2. Apparent Link Between the Unevenness of the Distribution and the Degree of Aggregation
The unevenness of the distribution of rain can be seen by the sharpness of the curves in Figure 3a. Dif-ferences in unevenness are more readily seen when normalizing the distribution by the domain-mean P (Pendergrass & Knutti, 2018), see Figure 4a. It enables a comparison of the fraction of water mass that falls as extreme rain and we summarize it with a simple metric U P99.9 /P (Figure 4b).
In our simulations, it appears that this unevenness is amplified by convective organization, regardless of its effect on mean climate properties (mean radiative cooling and mean surface fluxes): it so happens that
domain-mean rainfall rates are identical to within 0.1% in the ref300K and ref304K simulations (see Figure 3a) as a result of similar radiative cooling and mean surface fluxes in these two simulations (Figure S2). This implies that at fixed SST, the reorganization of convection induces a mean climate shift equivalent to a 4K warming for disorganized rainfall. This equivalence does not hold for extreme precipitation, as can be seen by comparing the distributions of rain intensities and exceedance amounts between 300
ref K
and 304 ref K . The specific value of 4K likely depends on the domain configuration, subgrid-scale parameterizations and choice of forcing conditions, and this sensitivity would be worth further investigation. In particular, a forc-ing resultforc-ing from realistic perturbations in CO2, CH4, and aerosols could correspond a different net
radi-ative cooling and thus a different response in mean rainfall, so this number is specific to our experiment design. Qualitatively, however, when controlling for mean precipitation the organized states correspond to stronger unevenness of the distribution of rain toward more intense or more frequent extreme events. Later sections will confirm that stronger extreme events are likely associated with differences in circulation and in thermodynamic heterogeneities.
Following this reasoning, the amplification of rain unevenness U by self-aggregation circulations alone can be estimated as: 99.9 300 99.9 304 ref ref 99.9 304 ref ( ) ( ) 14.4% ( ) U U U (3) In our case, this “4K-warming equivalence” also applies for higher SSTs since 302
ref
has a similar domain mean rainfall as 306
ref
(Figure 3) although the equivalence is less robust above 304K: at that SST, mean pre-cipitation is largely enhanced due to larger sensible heat fluxes in the energy budget (Figure S2) and the estimate of mean rain is also affected by the large oscillations happening in the organized state (Figure S1). We will also see that different convective dynamics and larger precipitation efficiencies of extremes tend to occur in organized states above 304K for our simulation setup (Section 5) and that the physical drivers of change in mean and extreme rainfall cannot always be easily separated in these states in RCE (Section 6). The same exercise can be done to quantify how changes in the circulation alone affect the change in une-venness of rain with warming. Assuming that simulations refT and refT4K have similar mean climates, the amplification of the fractional increase in U by the circulation alone is
99.9 99.9
ref 300 302 ref 304 306
(
U ( )
U ( ) 1.11% /K at 300K.(4)
Figure 4. Measures of the unevenness of precipitation: (a) the fraction of total rain mass falling as extremes above
percentile PQ as a function of percentile rank Q and (b) mass fraction of rain above the 99.9th percentile as a function of
mean precipitation rate P.
More robust estimates of the amplification of extremes are calculated next (Section 3.2), followed by a more detailed attribution of this amplification to effects to aggregation feedbacks (Sections 4 and 5).
3.2. Trends in Mean and Extreme Rain, and Alternating Regimes
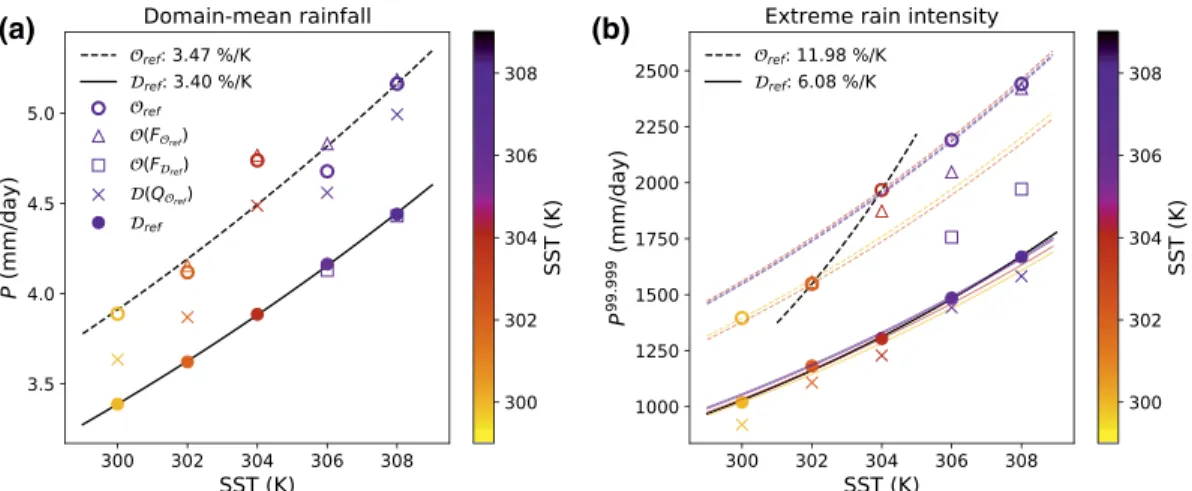
Mean and extreme rainfall intensities are shown in Figure 5 across the complete range of SSTs. Each dot shows the value of mean and extreme rain for each simulation analyzed at each SST and the black curves represent exponential fits to the ref and ref simulations. The large offset between the two exponential fits on both graphs shows that convective organization induces a clear amplification of mean and extreme rainfall in fixed climates. Organization enhances mean rainfall by an approximately fixed fraction (≈15%) which leads to global-warming trends of similar magnitude for ref (3.5%) and ref (3.4%). Section 4 further attributes this mean rainfall enhancement to the shift in mean climate properties induced by aggregation. In contrast to mean precipitation, the increasing trend of extreme rainfall intensities as a function of tem-perature is accelerated in the case of convective organization, leading to super-CC rates of increase. Fig-ure 5b shows in color the trends that would be consistent with the Clausius-Clapeyron formula, for each point (SST, P99.999) in the reference simulations
ref
and ref. Here the trends are calculated using the Buck's formula for accuracy (A. L. Buck, 1981, 1996):
99.999( ) ( ) exp 18.678 . 234.5 257.14 v T T P T q T T (5) For disorganized convection, the CC curves collapse onto each other, indicating a robust agreement with CC. The dashed curves, representing CC trends for organized precipitation, do not lie onto each other, indicating departures from the CC scaling. While the overall contribution of organization is a positive de-parture from CC, these simulations exhibit several regimes, further detailed in Section 5. Notably, super-CC increases occur between 302 and 304K (roughly a double-CC rate of increase), while robust agreement with CC is found outside this range. This highlights that nonlinear global-warming behaviors can occur in the dynamics of extreme events due to changes in organization.
We should also note that this result is only valid for intense enough extremes: choosing the 99.9th percen-tile, standard quantity to investigate extreme events, leads to a different interpretation, and for ref we see four different regimes: CC, super-CC, sub-CC, and super-CC (Figure S3). The rest of the analysis will focus on extremes between the 99.99th and 99.999th percentiles.
Figure 5. Strength of mean precipitation (left) and precipitation extremes P99.999 (right) as a function of SST for all
simulation types. Four simulations are excluded, as explained in Section 2.2 and displayed in Figure 2. Curves show the expected Clausius-Clapeyron increase of precipitation extremes that corresponds to the reference ref (solid) and ref
(dashed) simulations at each SST (color scale). SST, Sea Surface Temperature.
Section 4 emphasizes the multiplicity of effects that self-aggregation can have on the overall offset and trends in mean and extreme rainfall. Section 5 will investigate more specifically the reason for the super-CC trend in extremes and the three separate regimes that appear as SST rises.
4. Shifts in Mean Climate and Circulation Strengthening
In this section, we will use the intermediate simulations
ref
,
ref
, and
ref
in an attempt to dissect the role of aggregation on mean and extreme rainfall via two general mechanisms, using the decom-position shown in Figure 1:1. Shift in the mean climate state: changes in the atmospheric radiative cooling can be measured by compar-ing ref and
ref
(light blue arrow), and shifts in mean surface fluxes can be measured by comparing
ref
and
ref
(red arrow).2. Changes in the circulation affect the local thermodynamic environment in which convective clouds can form.
ref
ref (green) quantifies the total contribution from changes in the circulation,
ref ref
(yellow) quantifies the role of the circulation induced by the radiative feedback alone, and
ref
ref
(red) and
ref
ref (dark blue) both quantify the reinforcement of the circulation by the surface-flux feedback.Interpreting each contribution separately is obviously difficult, because these mechanisms are coupled. In particular, the red arrow (
ref
ref
) can be understood as a change in the mean climate, because it corresponds to a mean increase in sensible and latent heat fluxes, but also as a change in the circulation, because surface fluxes in ref are larger in response to the stronger surface winds caused by the radiative and surface flux feedbacks. In addition, there is no unidirectional causality running from the strength of the circulation to the strength of convection, because one adjusts to changes in the other. How-ever, this decomposition will associate changes in precipitation preferentially to shifts in mean climate or in the circulation, and will also reveal the importance of the simulation design for the distribution of rain. Recalling that the pathways drawn in Figure 1 can be written as a product of enhancement factors (Equa-tion 1), this decomposition can be calculated at each SST, which is shown on Figure 6a for mean precipita-tion and Figure 6b for the extremes. Because mean rainfall increases at an overall similar rate in ref and ref (δ ≈ 3.5%/K, Figure 5a), and because of large uncertainties on the estimate of mean properties in oscillating organized states, we will first discuss bulk enhancement factors averaged across SSTs for simplicity. The mean total enhancement (the first row of the table, denoted by P) is total 1.17, which corresponds to a 17% amplification. In the first pathway (Equation 1a), it is mostly explained by the increase in mean surface fluxes shift 1.20 while the two other enhancing components are negligible rad 0.99 and surf 0.99. This pathway simply highlights the consistency of a closed water budget in steady state, so that changes in mean precipitation must match changes in evaporation from the surface. In the second pathway (Equa-tion 1b), the shift in mean radiative cooling alone cannot explain the mean rainfall shift (i.e., shift 1.10 is less than total 1.17), because it is partly compensated by an increase in surface sensible heat fluxes in simulation
ref
which dims the latent heat response (not shown). The last term, corresponding to the experimental setup of previous studies (Bao & Sherwood, 2018), shows a complementary enhancement (circ 1.05). Because
ref
and ref have equal mean radiative cooling, this last term can be interpret-ed as the effect of the circulation on the surface enthalpy fluxes, via stronger surface winds and the drier near-surface air in the subsidence region.At fixed SST, these contributions can also be calculated for the enhancement of precipitation extremes, as shown in Figure 6b for the 99.999th percentile and on Figure 6c for all extreme percentiles. We see that the enhancement factors vary little as a function of SST, and we discuss average values above 304K. shift 0.95 is close to 1, which suggests that for disorganized convection, changes in domain mean radiative cooling have little effect on precipitation extremes at these SSTs. It confirms recent results showing that radiative cooling mostly affects weaker rain rates (Chua et al., 2019) and leaves the extremes unchanged despite the
adjustment of the mean surface fluxes. As a consequence, the response of extremes to self-aggregation at fixed SST can be attributed to the overall circulation and its effect on surface fluxes: circ total 1.5. On the upper pathway, the spatial redistribution of surface enthalpy fluxes (surf 1.04) only enhances PQ by a
few percent. The overall contribution is evenly split between the circulation induced by the radiative feed-back and the mean effect of the surface-flux feedfeed-back: rad shift 1.2.
The decomposition is then applied to the super-CC rates of increase in PQ that appears between 302 and
304K (Figure 6d). Because ref follows a CC scaling, departures dCC from the CC scaling can be
approxi-mated as the departure between the increase in extremes in the ref and ref simulations, for simplicity, and then decomposed as a sum of contributions coming from changes in the enhancing factors. Given the multiplicative form of the enhancement decomposition in Equation 1, and denoting the fractional change in precipitation extremes for a given warming gap ΔT by PQ ln(PTQΔT /PTQ) / ΔT, departures from CC can be simply estimated as
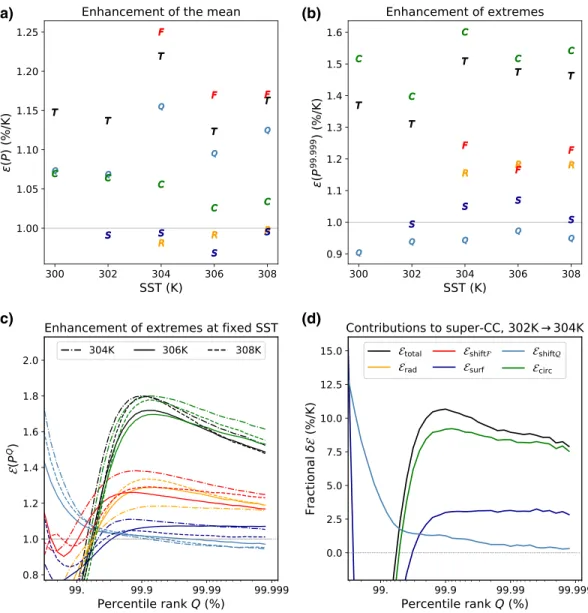
Figure 6. Enhancement of precipitation intensities PQ by the circulation (green), induced by the radiative feedback
(yellow), reinforced by the surface-flux feedback (dark blue and red), as well as the negligible effect of the larger radiative cooling (light blue). Shown at all SSTs for the mean (a) and extreme precipitation (b) and as a function of percentile rank (c). Panel (d) shows corresponding contributions to the departures from the CC rate dCC between 302
and 304K, for extreme percentiles δPQ. SST, Sea Surface Temperature.
(a)
(b)
dCC PQ
ref PQ
ref surfshift rad(6a)
circ shift.
(6b) where likewise i ln(i T, Δ T /i T, ) / ΔT, and each term can be calculated as a difference in fractional changes for pairs of simulations:
.
(7) where is the fractional change in extreme rain for simulation . Surprisingly, the increase in mean
ra-diative cooling shift does bring a small contribution of just under 1%/K to the super-CC rate (although this contribution vanishes at the highest percentiles). This is consistent with the latent heat flux increasing more rapidly than the sensible flux in the
ref
simulation as a function of SST, reinforcing convection (Figure S3). The remaining contribution comes from the overall circulation and the additional surface evap-oration that it causes (circ 7%/K). The upper pathway cannot be entirely characterized because simula-tion
ref
could not maintain a stable organized state at 302K, but the joint contribution of the radiative and surface flux feedbacks can be estimated as a residual, (radshift)totalsurf 4% / K for the highest percentiles.Testing further the sensitivity of mean and extreme rainfall to specific self-aggregation mechanisms would likely require a physically-based framework which explicitly connects the strength of the circulation to the strength of precipitation extremes. In our case, feedback mechanisms maintain the circulation and affect the mean climate simultaneously, and their effect on rain statistics cannot be easily separated. In particular, the surface-flux feedback alone is not sufficient to maintain organization (Holloway & Woolnough, 2016), as seen in the
ref
experiments, so its effectiveness to strengthen the circulation cannot be physically separated from the effectiveness of the radiative feedback to organize convection in the first place.Despite the difficulty to tease apart these contributions, two main ideas can be drawn:
1. The presence of a mesoscale circulation can induce heavier precipitation extremes even when con-trolling for mean climate properties in two separate ways, either (1) when fixing SST and mean radiative cooling rates (circ) or (2) when fixing SST and mean surface fluxes (rad). The latter case confirms that circulations can cause a stronger unevenness of the distribution of rain, since the domain-averaged rain rate is controlled by the same latent heat flux. This result indicates that even the rarest and heaviest rain events can be understood as an integral component of the circulation, although an enhancement of ex-treme rain rates also occurs in response to stronger mean surface fluxes (shift).
2. The super-CC trend in precipitation extremes is associated to the change in circulation occurring as SST rises (circ). The change in surface flux anomalies associated with the surface flux feedback (surf) also has a substantial effect on extremes, which indicates that the surface-flux feedback plays a large role in shaping the distribution of rain as SST rises, through its possible effects on convective strength. It sug-gests that organized precipitation extremes could be highly sensitive to changes in the large-scale winds in the real atmosphere because of their effects on surface evaporation.
Section 5 will investigate how a reinforcement of the circulation can amplify the heaviest rain intensities.
5. The Dynamics of Disorganized and Organized Extremes
5.1. Thermodynamic, Dynamic and Precipitation Efficiency ContributionsWe now seek to understand the cause for the CC and super-CC trends in precipitation extremes seen in Section 3.2, focusing on the reference ref and ref simulations. To do so, we use a scaling formula to approx-imate the largest rainfall percentiles PQ from the average dynamic and thermodynamic characteristics of
level in the troposphere as the vertical advection of saturation specific humidity qv at speed w along a moist adiabat e, and integrates it along the vertical to estimate the surface precipitation rate:
P w q z dz z v eQ T Q Q 0 * . (8) Superscript Q denotes that variables have been composited at the locations of extreme events: for all sur-face precipitation rates counted as the Qth percentile of the distribution, the profiles are sampled 1 h early and averaged across rainfall events in order to reconstruct the approximate conditions in which the corre-sponding convective clouds were formed. The 1 h time scale happens to match the characteristic timescale of convective updrafts and corresponds to the output time step. Coefficient ɛ can be interpreted as a proxy for the precipitation efficiency of extremes: as such, ɛ approximates the fraction of condensed water that reaches the surface, while 1 −ɛ corresponds to the fraction of cloud water that mixes in the environment. ɛ is calculated as a tuning coefficient from a least-square fit between true percentiles PQ and approximated
percentiles wQ z vq* Q between the 99.99th and 99.999th percentiles. Although ɛ is an efficiency coefficient, it remains a tuning parameter and could potentially exceed 1. It can be affected by sampling issues and its variability can reveal a limited explanatory power of the approximation formula (Fildier et al., 2018) but it also embeds additional processes such as entrainment of dry air and subtle differences in precipitation microphysics that could affect precipitation extremes (C. Muller, 2013).
This formulation facilitates decomposing the fractional changes δPQ into a sum of independent
contri-butions coming from changes in the dynamic and thermodynamic properties of extreme rainfall events. Denoting the pressure-weighted integral across the troposphere pT 0zT
ps dp
X X X dz
g , this scaling approximation can be rewritten as
P w w w q z M M v Q e Q Q Q Q * (9)
This decomposition differs from previous decompositions (Fildier et al., 2017; Muller & O'Gorman, 2011) but is similar to Romps (2011) in that it expresses the contributions as a product: M represents the vertical-ly integrated mass flux across the depth of the troposphere, such that M/〈1〉 represents an effective cloud updraft velocity; in turn Γ ×〈1〉 is a thermodynamic term representing an effective amount of moisture available for condensation, in kg/m3.
The fractional increase in extremes PQ can be decomposed in a sum of fractional contributions expressed
in %/K:
Q
precipitation mass thermodynamics Contribution from efficiency flux changes in: Γ P M (10) These individual contributions, precipitation efficiency ɛ, pressure-weighted mean vertical velocity M/⟨1⟩, in m/s, and the remaining thermodynamic term Γ × ⟨1⟩ which represents the moisture available for conden-sation in kg/m3, are shown in Figure 7 for each SST for simulations
ref
and ref.
Careful analysis showed that there is substantial noise in the calculation of vertical velocity composites—in particular, the standard deviation of w in individual extreme bins is of the same magnitude as the composite w mean—so that a precise interpretation of individual contributions is challenging. However, the scaling captures well the tail distribution of rain (Figure S4) and qualitative statements can be made.
For the reference disorganized case ref, precipitation efficiency is constant around 0.43, and the CC in-crease results from steady inin-creases in the thermodynamic contribution (about 3%–4%/K) and from overall
smaller increases in the dynamic component (0%–2%/K). These numbers are consistent in relative magni-tude with previous analyses of disorganized extremes (e.g., Romps, 2011).
In ref, this decomposition enables the investigation of the three regimes identified in Section 3.2 (CC-super-CC-CC). In the CC regimes outside the 302–304 K range, precipitation efficiency is stable and the CC rates result from roughly steady increases in the thermodynamic and dynamic component. Between 302 and 304K, the only contribution with significant magnitude and which has the right sign to explain the super-CC rates is precipitation efficiency. The plateauing of Γ and the sharp reduction in the dynamic component can be related to changes in vertical velocity profiles (dashed-orange and dashed-red curves on Figure 8b): the profile gradually shifts toward higher altitudes, reducing the integral in the lower trop-osphere and increasing it in the higher troptrop-osphere. Then vertical velocities strongly increase in the upper troposphere at high SST, which explains the faster increase in M beyond 304K, but understanding what actually sets the shape of vertical velocity profiles remains an open question.
One other feature of the decomposition is intriguing: the shape of the change in the thermodynamic con-tribution Γ mirroring that of ɛ in simulation ref. The plateauing of Γ between 302 and 304K directly re-sults from the upward shift in the vertical velocity profile (Figure 8b), which must shrink the value of
w w q zv eQ Q Q *
because z vq is smaller in the upper troposphere. We do not rule out the possibility that the corresponding increase in ɛ can partly arise as a compensation to the decrease in M when calibrat-ing the scalcalibrat-ing approximation at these SSTs; however, the jump in precipitation efficiency matches well the sudden saturation of environmental air at 304K (Figure 8a), so it is likely that a physical mechanism is also at play to simultaneously explain the change in ɛ and Γ in this SST range. A possible mechanism is that parcels be less diluted at 304K than 302K because of a smaller saturation deficit in their local environment, allowing their velocity profile to peak higher up in the troposphere; simultaneously, the larger condensate loading in this more humid 304K-atmosphere could reduce the buoyancy and the vertical speed below the altitude of the velocity maximum. This hypothesis could simultaneously explain the increased ɛ, the up-ward shift of vertical velocity profiles and the stagnation of Γ at 304K.
Testing this hypothesis and further explaining these nonlinear dynamics would likely require a closer anal-ysis of the interactions between precipitation efficiency, mixing with environmental air, and buoyancy. Al-though these results should be interpreted with care, it is unlikely that this behavior be an artifact of the scaling approximation: this formula closely captures the shape of the distribution tail at different SSTs, with correlation coefficients above 0.95 in all cases between the 99.99th and 99.999th percentiles, and the
Figure 7. Precipitation efficiency (green), and the dynamic (blue) and thermodynamic (red) components of rainfall
extremes between the 99.99th and 99.999th percentiles for simulations ref and ref: shown at each SSTs (left) and for
the fractional change between consecutive SSTs (right). The sum of contributions (or equivalently, the value of the scaling approximation, is shown in black. An archiving error for the 308
refK
3D data compromised the calculation of its scaling approximation. SST, Sea Surface Temperature.
approximate magnitude of ɛ is realistic for disorganized convection (Lutsko & Cronin, 2018). However, lim-itations of the approximation formula could lead to overestimates of precipitation efficiency, and sampling uncertainties could also have caused small errors in ɛ, M and Γ.
5.2. Amplification of Extremes by Larger Precipitation Efficiencies
We now make a stronger case for the possible role of precipitation efficiency in amplifying the strength of extremes (regardless of whether this occurs in response to changing SST or degree of organization). Fig-ure 8a shows the vertical profile of relative humidity at the location of precipitation extremes for the refer-ence disorganized and organized simulations. Convective aggregation appears to bring the environmental air close to 100% relative humidity in the moist environment in which deep convective clouds form. This lower environmental saturation deficit could have a doubly enhancing effect on the surface precipitation rate: it would increase condensation, or conversion efficiency, by reducing the dilution of cloud parcels into
Figure 8. (a)–(b) Relative humidity and vertical velocity profiles at location of precipitation extremes. (c)–(d)
Correlations of the enhancement total (from ref to ref) between precipitation extremes (PQ averaged between the
99.99th and 99.999th percentiles), precipitation efficiency ɛ and vertically integrated relative humidity ⟨RH⟩ sampled at the location of extremes. An archiving error for the ref308K 3D data compromised the calculation of its composites.
(a)
(b)
their environment, and could increase sedimentation efficiency by reducing the re-evaporation of conden-sates (Langhans et al., 2015; Lutsko & Cronin, 2018)
Figures 8c and 8d show the correspondence between the amplification (from ref to ref) in extreme precip-itation PQ, in ɛ and in vertically integrated relative humidity 〈RH〉 at the location of extremes, for all SSTs.
The correlation on panel (c) confirms the importance of fluctuations in precipitation efficiency for the strength of precipitation extremes. The correlation on panel (d) suggests that precipitation efficiency closely relates to the degree of saturation in the moist environment where extreme events occur.
These results highlight the key role played by the precipitation efficiency in modulating precipitation ex-tremes with organization. Further investigation of the sensitivity of efficiency to mesoscale organization is desirable to achieve accurate rainfall predictions in a warming climate.
6. Discussion
The present article summarizes the behavior of mean and extreme precipitation in conditions of disor-ganized and ordisor-ganized convection in large 3D domains. The analysis is based upon a diversity of forcing strategies and application of a large range of SSTs in order to highlight the strong sensitivity of precipitation in steady RCE states to the strength of the internal circulation and the global atmospheric energy budget. This section discusses additional lessons drawn from the variety of forcings and presents some remaining modeling simplifications that can affect the scope of relevance of these results.
6.1. Connection Between Mean Climate, Circulations, and Convection
Previous literature commonly uses two distinct arguments to explain the change in mean and extreme pre-cipitation, namely the global energy balance and local dynamics, respectively. Here we make a similar rea-soning to investigate the role of organization on these two quantities, assuming that the response of mean precipitation is driven by the global impact of organization on the energy balance, and that the response of extreme precipitation can be best understood from the local changes in saturation deficit and precipita-tion efficiency that appears in an aggregated atmosphere. Because these arguments correspond to separate spatial and temporal scales, understanding how the two are connected is still an open question. Here, we see that changes in mean climate properties are tightly connected to the horizontal structure of convection itself through mesoscale circulations. In the case of convective aggregation, this complicates the attribution of causality, but also extends the physical interpretation beyond the traditional distinction between drivers of change in mean and extreme precipitation.
In particular, understanding how the shape of the rainfall distribution and the intensity of rainfall extremes respond to changes in the atmospheric energy budget remains an open question. In order to describe changes in the distribution in a tractable way, Pendergrass and Hartmann (2014b) make the objective assumption that the energetic constraint on mean precipitation changes applies uniformly across all percentiles of the distribu-tion of rain amounts. This uniformity assumpdistribu-tion has later been refined, showing that an increase in domain mean radiative cooling is consistent with a reduction in moderate rain amounts and an amplification of the heaviest rain amounts (Pendergrass & Gerber, 2016). Similarly, Thackeray et al. (2018) show that changes in mean precipitation do correlate with changes in heavy precipitation rates across GCMs, suggesting that the strength of precipitation extremes is not independent from the domain-mean atmospheric radiative cooling. In contrast, Chua et al. (2019) show that doubling radiative cooling at fixed SST affects weak precipitation rates while leaving the heaviest rain rates unchanged; they report a response in the skewness of the distribution of updraft speeds that is, consistent with Pendergrass and Gerber (2016) but a moister boundary layer that “en-hances precipitation at a given vertical velocity.” Differences between these studies could arise because of the use of parameterizations in climate models or the unresolved mesoscale circulations in some modeling setups. In the case of disorganized convection, our simulations tend to confirm Chua et al. (2019)'s result because extremes are unchanged between the ref and
ref
simulations at fixed SST (Figures 5 and 6a, light blue). But in the case of organized convection, changing the mean radiative cooling at fixed SST does affect the extremes, as seen by the enhancement shift 1 in Figure 6. In this example, both the domain-meanatmospheric radiative cooling and the circulation adjust to the increased surface fluxes, which leads to a simultaneous reinforcement of mean and extreme precipitation rates. In particular, departures from their exponential fits can be seen at the same SSTs for P and PQ in Figures 5a and 5b.
Overall, mean and extreme rainfall are connected through conservation of mass and energy and through the distribution of vertical velocities in given climates (Pendergrass & Gerber, 2016) but the present work suggests that an additional connecting piece could be the spatial organization of mesoscale circulations. As a result, changes in these circulations could also act as an additional degree of freedom on their rate of change with warming as well as on the increased unevenness of the rain distribution.
6.2. Sources of Methodological Uncertainty
Further analysis is required to test the relationships between mean/extreme precipitation and convective organization in more realistic representations of the tropical atmosphere than idealized RCE in square domains. In particular, it seems necessary to quantify on which scales these relationships hold and validate the physical relevance of the super-CC and CC regimes identified. Indeed, several implicit methodological assumptions could bias our interpretation.
First, the limited domain size is suspected to amplify the degree of convective organization (Cronin & Wing, 2017), which could cause an artificial amplification of heavy precipitation intensities. On larger trop-ical domains than we employed, longwave radiative fluxes would tend to stretch the size of moist patches (Beucler & Cronin, 2019), which could damp the strong amplification in relative humidity that we find in our study, thus preventing the super-CC rates that arise from increases in precipitation efficiencies, or trans-pose this behavior to higher SSTs. However, Abbott et al. (2020, Figure 3c) document that super-CC changes in extreme rain can occur in long-channel simulations and that these are also associated with larger pre-cipitation efficiencies, so that this result may hold in larger domains. An improved characterization of the relationship between strength of self-aggregation feedbacks and domain size seems necessary to quantify the sensitivity of rain intensities to specific modeling choices.
The second issue resides in the coarse 4 km resolutions used. They prevent the adequate representation of low clouds and tend to bias the system toward an excessively dry free troposphere in the subsiding regions (Holloway et al., 2017). This could lead to an overestimate of mean rainfall increases due to the model's inability to resolve the absorption of upwelling shortwave radiation reflected by stratocumulus. In addition to its role on turbulent mixing as well as rain reevaporation and cold pools (Jeevanjee & Romps, 2013), the coarse resolutions could bias the strength of self-aggregation feedbacks by modifying the low-level circu-lation induced by longwave radiative cooling in low-clouds (C. J. Muller & Held, 2012), thus affecting the thermodynamic environment in which extreme events occur.
Third, the timescale required for these experiments to reach equilibrium is substantially larger than the lifetime of typical MCSs (Houze, 2004). Even though the effect of self-aggregation on the largest percentiles of the distribution does appear gradually during the transition between disorganized and organized states (not shown), the actual importance of aggregation for precipitation rates in shorter-lived convective systems could be smaller, and deserves further investigation.
A fourth kind of methodological limitation is the quantification of precipitation extremes themselves. In particular, the distribution of rain calculated over the entire domain actually depends on the relative oc-currence of different precipitation regimes. As a result, organized RCE states over idealized small domains likely exhibit different rainfall distributions and stronger rainfall extremes than larger simulation domains with realistic occurrences of deep and shallow convective systems, even for the same conditions of forcing and in a similar mean climate.
In addition to these methodological considerations, additional uncertainties arise from the magnitude and type of forcing conditions, in addition to the choice of closure required for unresolved processes. Winds, turbulence and cloud microphysics could affect extremes indirectly through the strength of self-aggregation feedbacks and convective mixing, but also directly, by affecting convective dynamics, mixing, and condensa-tion. Bao and Sherwood (2018) also report changes in precipitation efficiency with convective organization,
but connect them to a microphysical response rather than changes in the local environment of convective updrafts (we note though that both can be related, as for instance changes in low-level relative humidity can affect the evaporation of rain and thus precipitation efficiency). They document changes in condensate species with a reduction in graupel production and argue that it enhances precipitation efficiency while re-ducing buoyancy and updraft velocity. Further analysis is desirable to test their results in SAM with two-mo-ment microphysics schemes and under a large range of SSTs and forcing conditions.
Besides, Lane and Moncrieff (2015) and Moncrieff and Lane (2015) showed that the propagation, vertical structure, and organizational properties of MCSs depend on a balance between the strength of cold pools, convective inhibition, and sub cloud layer saturation levels, which largely varies with large-scale wind shear conditions. Such analyses have not yet been extended to the context of self-aggregation in RCE, so that the sensitivity of self-aggregation feedbacks, precipitation efficiency and rainfall extremes to wind shear is still largely unknown.
7. Conclusion
Convective organization provides a framework to study the interaction between atmospheric circulations that occur on long time scales, and convective processes that occur on short time scales. Our simulations show that these mesoscale circulations can directly change the spatial distribution of thermodynamic varia-bles such as moist static energy and relative humidity and affect local convective processes and the statistics of rain. The reverse interaction, namely the effect of local convective activity on the circulation strength or on the redistribution of moisture (Romps, 2014, e.g.), is outside the scope of the present study but is of importance when estimating the strengthening of organization in future climates.
This work provides evidence that a strengthening degree of convective organization in warmer climates can be associated with a faster increase in extreme rainfall intensities than what disorganized convection indicates, with an excess relative to the Clausius-Clapeyron scaling. In our modeling setup, we observe a ≈ 12%/K increase between 302 and 304K. These departures from CC correspond to variations in the strength of organization and concomitant mesoscale circulations: here different strengths of organization are ob-tained by simply turning on and off the radiative and surface flux feedbacks. When convection is organized, heavier extreme rainfall intensities strongly correlate with larger precipitation efficiencies: this likely results from the enhanced air saturation in the moistest areas of the domain and a reduced ability of cloud parcels to mix with dry air as they form.
Because this coupling between convection and the large-scale circulation cannot be resolved on the coarse GCM grids, it could be an important source of bias for the intensification of extreme rain events in current climate models. The magnitude of self-aggregation feedbacks in future climates has not been quantified yet because of the sensitivity of aggregation to model parameterizations and differences across simulation designs. Some of the processes from which these uncertainties originate can actually affect convection and precipitation directly, such as cloud microphysics and turbulent processes. As a result, improved under-standing of future changes in self-aggregation and precipitation extremes could be gained simultaneously by focusing on the sensitivity of these two processes to the model formulations for cloud microphysics, turbulence, surface enthalpy fluxes and radiative transfer.
This work has demonstrated a changing behavior of precipitation extremes as a function of SST via multi-plicative effects of self-aggregation feedbacks through a change in the strength of aggregation. In Section 6, it is proposed that the mesoscale circulations could possibly modulate the response of mean and extreme rain to global warming simultaneously. These nonlinear behaviors raise fundamental questions about the design of idealized experiments—for example, the small RCE domains with no wind shear used here— and the nature of their connection to the real atmosphere. Can these idealized model configurations (with self-aggregation and without) be interpreted quantitatively to estimate shifts in the hydrologic cycle? What correspondence can be achieved to map these results onto realistic estimates? Tan et al. (2015) show that a large uncertainty in current estimates of changing precipitation extremes with warming comes from lack of knowledge of how convective organization will change with warming. So, improved fundamental under-standing of convective organization and its sensitivity to warming is hence an area of priority for climate model development to achieve accurate rainfall projections in a warming climate.