HAL Id: hal-02441969
https://hal-cea.archives-ouvertes.fr/hal-02441969
Submitted on 16 Jan 2020
HAL is a multi-disciplinary open access archive for the deposit and dissemination of sci-entific research documents, whether they are pub-lished or not. The documents may come from teaching and research institutions in France or abroad, or from public or private research centers.
L’archive ouverte pluridisciplinaire HAL, est destinée au dépôt et à la diffusion de documents scientifiques de niveau recherche, publiés ou non, émanant des établissements d’enseignement et de recherche français ou étrangers, des laboratoires publics ou privés.
reactors recent R&D achievements at CEA
Hs. Pham, N. Alpy, D. Haubensack, T. Cadiou, M. Saez, O. Gastaldi, G.
Rodriguez
To cite this version:
Hs. Pham, N. Alpy, D. Haubensack, T. Cadiou, M. Saez, et al.. Supercritical CO_2 cycle coupling to sodium cooled fast reactors recent R&D achievements at CEA. NUTHOS - 11 The 11th International Topical Meeting on Nuclear Reactor Thermal Hydraulics, Operation and Safety, Oct 2016, Gyeongju, South Korea. �hal-02441969�
1/1
Supercritical CO
2Cycle Coupling to Sodium Cooled Fast Reactors:
Recent R&D Achievements at CEA
Hong-Son Pham
1, Nicolas Alpy
1,
David Haubensack
1, Thierry Cadiou
1, Manuel Saez
1, O. Gastaldi
2, G. Rodriguez
31
French Atomic and Alternative Energies Commission, CAD/DEN/DER/SESI/LEMS
2
French Atomic and Alternative Energies Commission, CAD/DEN/DTN
3
French Atomic and Alternative Energies Commission, CAD/DEN/DER CEA Cadarache, 13108 Saint Paul Lez Durance Cedex, FRANCE
hong-son.pham@cea.fr, nicolas.alpy@cea.fr,
david.haubensack@cea.fr, thierry.cadiou@cea.fr, manuel.saez@cea.fr ;
olivier.gastaldi@cea.fr; gilles.rodriguez@cea.fr
ABSTRACT
This paper highlights some recent achievements carried out at French Atomic and Alternative Energies Commission (CEA) in the framework of the R&D on the supercritical CO2 (sCO2) cycle for Sodium
Cooled Fast Reactors (SFRs). We discuss the sCO2 cycle thermodynamic potential and in-depth
investigations of some connected thermal-hydraulic issues regarding compression performance modeling and cavitation phenomenology nearby the critical point. Outlines of these numerical studies are the followings:
– Net efficiency of a condensing cycle could be up to 44% for a turbine inlet operating at (515°C, 25MPa).
– A revised approach for compression performance maps representation is developed on a 2 input parameters basis which complies with current treatment by system codes. This methodology is shown, using CFD, to succeed in modeling the impact of the fluid compressibility change on compressor performance. This finding should also ease engineering work by reducing the required number of component qualification tests. In support, ability of CFD to provide a relevant database has been validated by confrontation with some experimental data from a test compressor.
– Through analytical consideration of a characteristic parameter and further dynamic simulations, thermal regime is balanced to be the driving mechanism of bubble collapse near the critical point due to combined effects of liquid-like high density and low thermal diffusivity. A very slow contraction could therefore be foreseen, leading to the absence of noticeable pressure rise, in line with some experimental observations from the literature. Again, this outcome could support future engineering work on cycle thermodynamic and compressor thermal-hydraulic designs.
KEYWORDS
SUPERCRITICAL CO2, CYCLE PEFORMANCE, COMPRESSOR PERFORMANCE MAPS, CAVITATION, BUBBLE, SODIUM FAST REACTOR
2/2
1. INTRODUCTION
Currently, the Rankine steam thermodynamic cycle is the dominant technology for thermal to mechanical energy conversion of the power plants in operation, including concentrated solar, biomass, coal-fired and nuclear power plants. It offers high efficiency due to a low ratio of input work for liquid phase pumping to output work from vapor phase expanding under a high pressure ratio. As an alternative, the closed Brayton gas cycle promotes operation at higher temperature, thereby potentially achieving higher efficiency. Nevertheless, this cycle requires large energy input for the compression process and therefore is only attractive in the very high temperature range, typically over 850°C. In the high temperature range, around 500°C, while less efficient than the Ranking cycle, it could be selected to accommodate other engineering/project constraints. For example, a Brayton nitrogen cycle is currently considered as an alternative to the conventional steam cycle for SFRs to avoid issues related to the fast and energetic sodium/water reaction [1].
In this context, the sCO2 cycle is viewed as a potential candidate for advanced power conversion
systems since it is claimed to avoid most of the problems of the Rankine steam and other Brayton gas cycles while retaining many of their advantages [2]: i) high efficiency due to the low compression work required in the reduced compressibility region near the critical point; ii) compact turbomachinery resulting from the high density and low heat capacity of the working fluid; iii) simpler system layout than a Rankine steam cycle; iv) lower performance sensitivity to the system pressure losses than a Brayton (eg. nitrogen) cycle. The past decade has seen a growing interest in the sCO2 cycle through a
significant amount of work that has been carried out in view of analyzing these potential advantages for various heat sources such as: low-grade waste heat recovery applications [3], hybrid fuel cell systems [4], concentrated solar [5], next generation nuclear reactors [6] including innovative SMR [7], and fusion reactor concepts [8].
As mentioned, the reduced work of the sCO2 compressor takes advantage of the real gas behavior of
the working fluid near the critical point. However, the sharp change of fluid properties in this region can be viewed as having possible implications on the stable operation of the cycle and of its compressors in particular. Inline, it was suggested in [2] that switching the compression in the supercritical phase would discard cavitation problems that could be worrisome in the original design of a condensing cycle [9]. On the other hand, some recent experimental works reported the absence of dysfunctional behavior during the operation of a test compressor in the two-phase region of CO2 [10,
11]. Another main R&D question that is connected to the real gas behavior, addresses the transfer to
the sCO2 compressor of the engineering know-how gained on conventional turbomachines, such as
performance maps representation.
CEA and Argonne National Laboratory (ANL) first addressed these issues by studying cycle off-design operation under seasonal variations in the temperature heat sink [12]: a main highlight from this work was that variable speed compressor or inlet guide valves should be requested to efficiently accommodate off-design changes of compressibility. The present paper reports additional R&D works that has been performed at CEA/DEN since then:
Section 3 deals with the establishment of an approach that allows coping with the real gas behavior of the working fluid near the critical point by dressing compressor performance maps in adequate reduced coordinates (i.e. suitable dimensionless speed and flow parameters inputs and pressure ratio and enthalpy rise outputs). Limitation of previous performance maps approaches to model real gas behavior is shown and the revised approach is validated using CFD. Prior proceeding so, numerical results are confronted with some experimental data to qualify the ability of CFD to provide a relevant performance database.
Section 4 deals with cavitation phenomenology of a CO2 bubble close to the critical point.
First, the increased risk of vapor pockets appearance inside a sCO2 compressor is highlighted
through the marked decrease in the static temperature and pressure during flow acceleration, confirming the caution reported in [2]. Then, impedance of the interface motion due to thermal effect during the collapse is analytically assessed through a characteristic parameter and
3/3
further numerically calculated by use of a dynamic model, highlighting a physical explanation to the recent experimental observations about the absence of dysfunctional behavior during operation of a test compressor in the two-phase region [10, 11].
To start, the attractive thermodynamical performance of a sCO2 condensing cycle is reported in section
2 for SFRs conditions.
2. THERMODYNAMIC PERFORMANCE FOR AN SFR APPLICATION
In CYCLOP (CYCLe OPtimisation) [13], the CEA/DEN tool for power conversion cycle modelling, a cycle is represented by a set of fluid loops built from different components (heat source and sink, turbo-machines, heat exchangers) which are described by macroscopic parameters such as efficiency, pressure and heat losses if not adiabatic, as well as mass flow rate. Components are connected by points where thermodynamic states (temperature, pressure) are stored. This tool solves automatically the mass and energy balances for all components of the cycle from a minimum set of input data, allowing all cycle parameters to be quickly modified and optimised using the well-known deterministic Nelder-Mead algorithm [14]. CYCLOP has been validated on Rankine steam cycles coupled to French Pressurized Water Reactors (such as CRUAS) and the French SFR Superphenix. It has also been extensively benchmarked in the frame of R&D programs, from the helium Brayton cycle applied to a Gas-cooled Fast Reactor concept [13] to the sCO2 cycle for an SFR [12]. In this code, the
CO2 properties are determined from the Helmholtz free energy equation of state [15]. This equation is
considered by the National Institute of Standards and Technology as being the most accurate one to describe the thermodynamic properties of CO2 for a wide range of scientific and engineering
applications.
The optimization of the sCO2 cycle to an SFR test case was previously considered at CEA and
reported in [1, 12, 16]. The latest work reported a net efficiency of 43.9% for a 25MPa recompression cycle at a Turbine Inlet Temperature (TIT) of 515°C and an optimal IHX inlet temperature of 348°C. However, a sodium temperature of 345°C leaving the hot side of the IHX could interestingly enhance the compactness of the vessel and sodium intermediate loop [17]. While such a case will require a typical sCO2 IHX inlet temperature below 330°C, it was shown in [18] that this additional constraint
would make the cycle thermal efficiency decrease from 43.9% to 42.6%.
In line with the recent work [16] and current activities that target to show the ability of operating efficiently a CO2 cycle for various compressibility conditions, the former engineering choice of
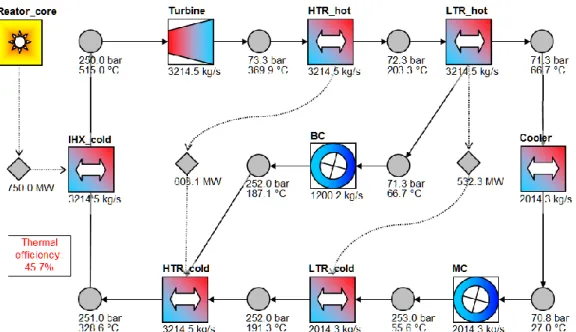
compressor inlet operation at supercritical condition [12] (which was a caution consistent with [2]), was disregarded. Instead a condensing cycle has been investigated to take advantage of the 27°C cooling of CO2 that is available [17] rather than 35°C. It comes out on Fig. 1 that - using usual
assumptions for components performances (see Table 1) - a 45.7% thermal efficiency (corresponding to 44% net) can be reached, while complying with the mentioned 330°C constraint at IHX inlet.
Table 1. Components performances used through for thermodynamic performance optimization
Isentropic turbine efficiency [%] 93
Isentropic pump efficiency [%] 88
Isentropic compressor efficiency [%] 87 Recuperators thermal efficiency [%] ≤ 92.5 Recuperators pinch temperature [°C] ≥ 10
4/4
Fig. 1 CYCLOP scheme of the optimized sCO2 recompression cycle in condensing mode for SFR-like
turbine inlet conditions (Hot and cold sides of each heat exchanger are modelled separately and the heat transfer is represented through dotted lines. Pressure and temperature are indicated under each
node, and mass flow rate is given under each component).
3.
TURBOMACHINERY PERFORMANCE MAPS REPRESENTATION
This section reports the work carried out on sCO2 turbomachinery maps representation, following a
two steps process:
First, the availability of CFD to provide a relevant numerical database for compressor performance maps, has been assessed through a comparison with some experimental results provided by the Tokyo Institute of Technology (TiTech) on a 6kWe centrifugal test compressor [19].
Second, a revised approach for sCO2 compressor performance representation has been
dressed based on an analytical thought and further numerically validated using CFD on a 38MWe conceptual compressor, again centrifugal, designed by the ALSTOM Company for a Small Modula Reactor application [18].
3.1. CFD analysis of TiTech tests with a sCO2 compressor
Table 2 reports some key characteristics of the TiTech test compressor [19] which was designed for an inlet gas phase flow.
Table 2. TiTech test compressor characteristics
Design data On design inlet conditions
Power/isentropic efficiency [kWe/-
]
6/0.89 Mass flow rate [kg/s]
2Pressure ratio 1.19 Temperature [°C
]
32Rotational speed [kpm
]
24 Pressure [MPa]
6.8Impeller diameter [mm
]
76 Compressibility Z-factor 0.53Blades number, impeller/diffuser 16/19 Density [kg/m3
]
220Interestingly, this machine was tested off-design at various compressibility inlets within the gas and supercritical domains. These tests have been simulated by CFD with STARCCM+ on a 250000 cells
5/5
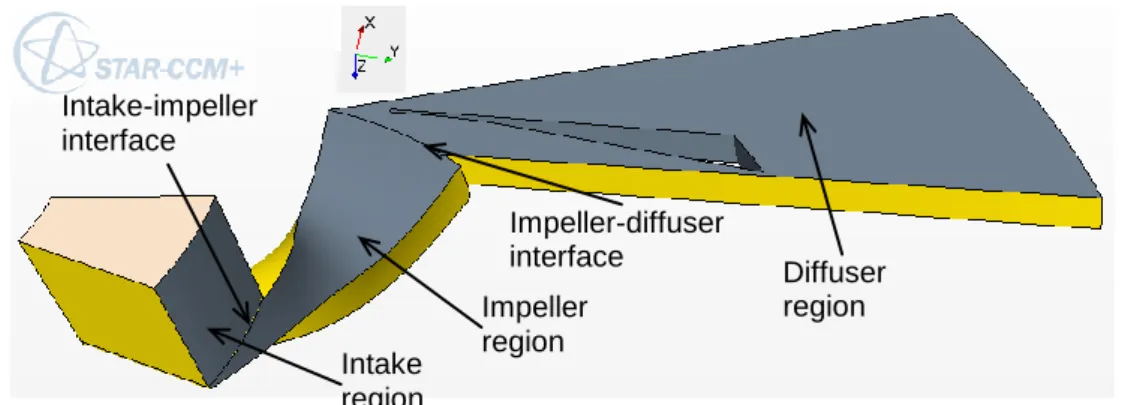
polyhedral meshing with periodic conditionsover a domain reported in Fig. 2.
Fig. 2 Calculation domain for the TiTech compressor simulation. Impeller blade is hidden under the tip-clearance flow.
Turbulence was modeled using the k- RANS model with wall integration approach for cost-accuracy compromise. Multiple frames of reference and a mixing plane interface models were additionally used to connect impeller and diffuser. A comparison between experimental and CFD results for five inlet conditions is reported in Fig. 3. A fine agreement is considered to be reached while compressibility and density at inlet vary from more than a factor two: errors are inferior to 0.57°C and 0.025MPa for outlet temperature and pressure, which is close to the sensors accuracy range (respectively 0.5°C and 0.02MPa).
Fig. 3 Left: comparison between experimental (cross mark) and CFD (square mark) compressor (T, S) outlet coordinates, according to different inlet operating points (round mark) ; iso-lines of pressure,
compressibility factor and density are also reported. Right: On-design pressure and temperature contours.
3.2. Revised approach for performance maps representation and validation through CFD Up to now, compared to the conventional two inputs parameter approach that is used for ideal gas (based on the Buckingham’s theorem [20]), two main paths have been reported in the literature for sCO2 compressor performance modeling. First one is to dress a widespread performance database by a
screening of the whole inlet compressibility conditions that could be faced [21]. Such a methodology implies to qualify this database extensively which can be seen as very demanding. A second approach which is adopted in [22], consists in keeping a two inputs parameter approach while introducing the effect of the compressibility factor Z and of the heat capacities ratio for critical conditions, as
Diffuser region Impeller region Intake region Intake-impeller interface Impeller-diffuser interface
6/6
suggested in [23] for real gas effect modeling. The latter approach has been revised in the present work based on a physical analysis by introducing the isentropic exponent ns
v P Pv
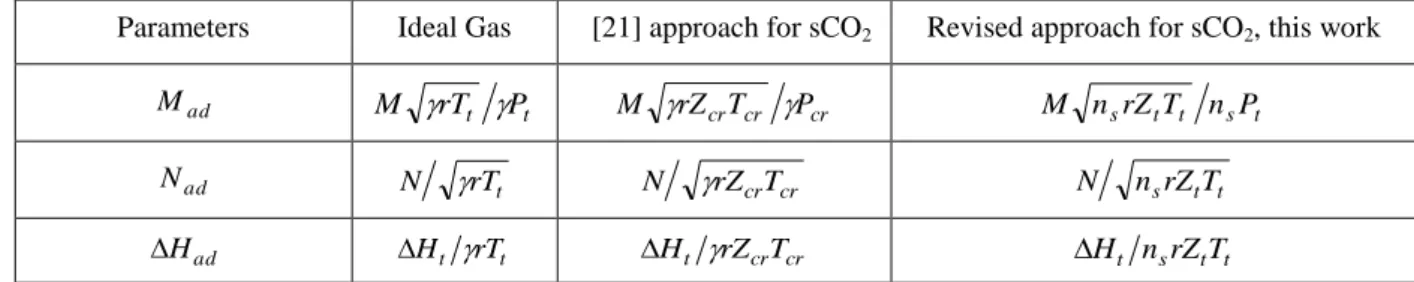
T instead of the heat capacities ratio : the latter does not any more allow reduced parameters to be representative of Mach number, on contrary to the former. Table 3 reports the different definitions for reduced parameters.Table 3. Dimensionless parameters for turbomachinery performance maps.
Parameters Ideal Gas [21] approach for sCO2 Revised approach for sCO2, this work
ad M t t P rT M M rZcrTcr Pcr M nsrZtTt nsPt ad N N rTt N rZcrTcr N nsrZtTt ad H Ht rTt Ht rZcrTcr Ht nsrZtTt
Both approaches for sCO2 were compared for three inlet conditions that present very large variations
in the specific heat ratio and compressibility; to perform so, the same CFD methodology than the one reported in §3.1 is applied on a 38 MWe compressor conceptual design. Results are reported in Table 4 where a very good consistency of the performance parameters can be noticed with the revised approach (maximum errors are of 0.6% for enthalpy rise and of 0.9point for efficiency). This accuracy is markedly improved compared to the former approach and this trend is expected to be further enhanced through consideration of higher pressure ratio, which was limited – due to numerical consideration – to 1.2 in these tests cases while it would be close to 3 on design.
Table 4. Comparison between both approaches at the corrected mass flowrate and speed of 436kg/s and 3087rpm with respect to reference conditions of 34.0°C and
7.86MPa.
Tt,in [°C] Pt,in [MPa]
ns[21] approach for sCO2 Revised approach, this work
Hcor [kJ/kg] [%] Hcor [kJ/kg] [%]
34.0 6.00 2.41 1.3 3.56 90.13 3.25 92.58
27.0 9.00 3.46 12.6 3.41 91.57 3.27 92.56
35.0 8.05 24.5 1.9 3.15 92.22 3.27 91.70
Maximum discrepancy 12% 2.09 points 0.6% 0.88 point
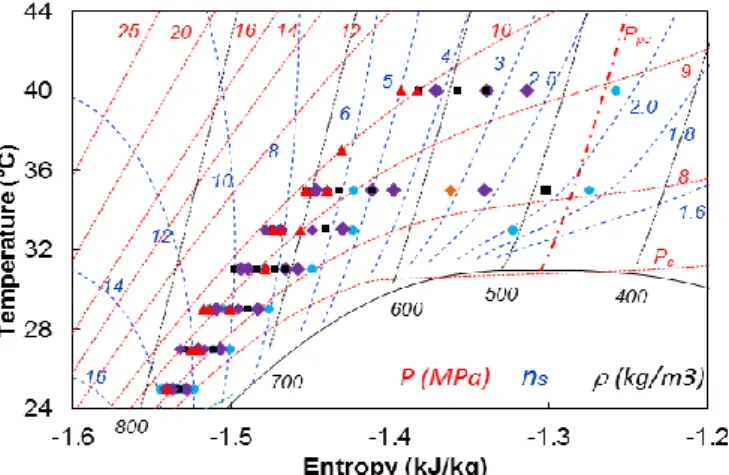
The final task has consisted in extending the application of the revised correction approach to a wider range of inlet conditions as well as of mass flowrate and shaft speed. The inlet conditions of temperature and pressure are recapitulated in Fig. 4, showing a concentration in the subcritical liquid and supercritical region.
7/7
Fig. 4 Inlet conditions screening used to qualify the compressor performance maps revised approach.
The plots of the corrected enthalpy rise and efficiency are reported in Fig. 5. Each point shown in these plots is constituted of 3 to 7 sets of inlet conditions according to Fig. 3 screening; over 100 points have been used to establish these charts. The consistency of these performance parameters at various corrected speed and mass flowrate regardless the change of the inlet conditions (so of compressibility) confirms the relevancy of this performance maps approach for the sCO2 compressor.
Fig. 5 Performance database representation.
This two parameters approach is expected to ease the experimental validation of compressor performance (by reducing the number of tests to be performed) as well as to provide a simple methodology for turbomachinery modeling (complying with current treatment by system codes). It could also be relevantly applied to model the performance maps of a N2 compressor such as the one
considered in [24], which is known to feature some real gas aspects (though much less marked than sCO2 ones).
4. BUBBLE COLLAPSE NEAR THE CRITICAL POINT
Cavitation - the formation of vapor cavities in the bulk liquid - is the consequence of a rapid depressurization of the liquid to a sufficiently low pressure. When subjected to high pressure, these voids collapse, causing dysfunctional behaviors or detrimental effects to the mechanical structure such as vibrations, noises and erosion. For CO2 close to the critical point, such a phenomenon is seen to be
promoted by the large gradient of compressibility within the pump/compressor intake region that operates to flow acceleration, as compared to an ideal gas case: comparative trends are illustrated in Fig. 6 where saturation conditions are reached at not more than 80m/s. Let’s notice that such a velocity
8/8
would rather be a low engineering value for an air compressor design (which deals typically with values over 150m/s).
Fig. 6 Isentropic decreases of static temperature and pressure as a function of velocity increase according to CO2 [15] and ideal gas thermodynamic models.
A compressor was operated in the two-phase region near the critical point of CO2 during the tests
conducted at Sandia National Laboratories [11, 22]. Surprisingly, there was no dysfunctional behavior observed during the tests, neither pressure instability nor notable increase in vibration and audible noise. Such an observation, also noticed in [10], promisingly suggests that effects of cavitation in liquid CO2 near the critical point could be much less severe than those traditionally experienced in
hydraulic devices.
Such an important outcome deserves a comprehensible explanation through an in-depth understanding of the physical phenomenon. In that line, two approaches were carried out:
A characteristic number was calculated to discriminate the collapse regime between inertia and thermal ones, which feature very different dynamics.
Dynamic of the bubble collapse was simulated based on the well-known model of Rayleigh-Plesset [25,26 ]: ) ( ) ( ) ( * * ) ( * ) ( 2 1 2 1 4 2 3 V i i l l IV i l III l l li II l l l I i i i R R R p p p p R R R
Eq. 1 In Eq. 1:
Term (I) refers to the motion of the bubble interface.
Term (II) is the instantaneous tension or inertial term, which is determined by conditions in the liquid bulk.
Term (III), so-called the thermal term, refers to the change of the saturation pressure with respect to the change of the temperature at the interface.
The two last terms (IV) and (V) are the contribution of surface tension and liquid viscosity, respectively.
4.1. Thermally controlled regime and identification of the driving mechanism
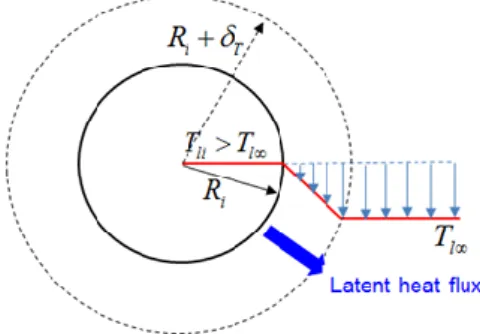
During bubble collapse, liquid temperature at the interface varies due to the phase change. Indeed, condensation releases a quantity of heat which is removed through a thermal layer that is formed around the bubble (cf. Fig. 7). Liquid temperature at the interface becomes higher than bulk liquid temperature so that vapor pressure (assumed to be equal to the saturation pressure at the interface
Ideal gas
9/9
temperature) also deviates from its initial value. The thermal term in Eq. 1 is negative and therefore has an impeding effect on the motion of the bubble interface
.
Fig. 7 Thermal boundary layer surrounding the bubble during the collapse.
Different parameters were proposed in the literature to characterize the role of thermal effects in bubble dynamics, among which as the -factor [27] which is defined according to Eq. 2. Depending on its weight compared to inertia, the regim could be nammed “thermally controlled” and the energy conservation equation should be combined to Eq. 1 to describe bubble dynamics.
* , 2 l f l l o l lv v pl l p p R h T c
Eq. 2
The -factor balances the amount of heat to be removed for a given volume of condensing vapor to the connected rise of temperature on liquid side due to its thermal inertia and diffusivity. The following limits can be used to evaluate the thermal effects: : thermal term is negligible; : inertial term is negligible; : both inertial and thermal terms should be retained.
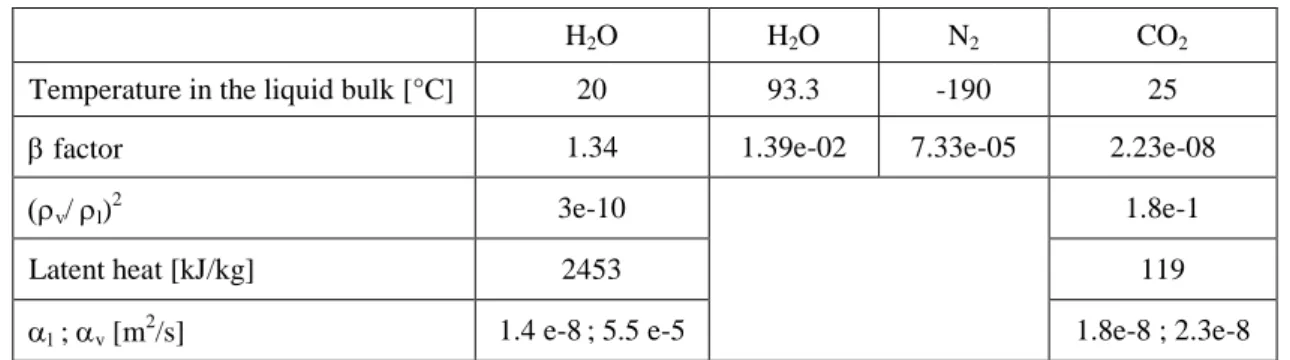
To get a clearer view through orders of magnitude, the factoris computed considering a 1 mm initial radius CO2 bubble at 25°C under a step increase of 2% in the liquid pressure. The same
calculations are carried out for three other gases (again considering initial saturation conditions) to provide a qualitative comparison since their cavitation effects are paradigmatic of inertia and thermal regimes:
A H2O bubble at ambient temperature which is commonly known to lead to detrimental
effects.
A H2O bubble at 93.3°C which was numerically investigated in [27], where significant
thermal effects leading to a slow contraction of the bubble were reported.
A N2 bubble at -190°C which characterizes cryogenic cavitation and was previously
demonstrated to be significantly affected by thermal effects [28].
Note that the choice of such a small 2% pressure variation is done in order to maintain liquid properties, especially those of CO2, constant since this is the assumption upon which the -factor is
10/10
Table 5. Thermal effects charateristic parameter during a bubble collapse.
H2O H2O N2 CO2
Temperature in the liquid bulk [°C] 20 93.3 -190 25
factor 1.34 1.39e-02 7.33e-05 2.23e-08
v/ l)2 3e-10 1.8e-1
Latent heat [kJ/kg] 2453 119
l ; v [m2/s] 1.4 e-8; 5.5 e-5 1.8e-8 ; 2.3e-8
From Table 5, it comes out that the -factor is much below the mentioned criteria that bounds thermal regime dominance and is even three orders of magnitudes lower than N2 cryogenic case. Hence strong
implications of thermal effects are very likely which should explain the reported absence of collapse damage.
As can be noticed in Table 5, low value of -factor is mostly driven by the closeness of respective liquid and vapor densities, accordingly with the conclusions reported in [11]. However, interestingly, Table 5 also reports the proximity of vapor and liquid thermal diffusivities (to which the-factor is blind): this physical trend, which is characteristic of the closeness of the critical state, should also play a role on the thermal regime limitation. The following section will address this point by simulating transient motion of the bubble interface during its collapse.
4.2. Simulation of the bubble collapse in liquid CO2 close to the critical point 4.2.1 Mathematical model
Consistently with the above remark, thermal layers inside and surrounding the bubble are both considered, as reported in Fig. 8.
Fig. 8 Schematic of the considered temperature profiles developed inside and outside a CO2 bubble.
The following set of equations is combined to Eq. 1 and solved under MATLAB. Liquid density, surface tension and viscosity are assumed to be constant in order to relax the numerical problem. Interface is supposed to meet thermodynamical equilibrium. All the thermodynamic properties (i.e. ρ, u, p and ) are calculated from [15].
Energy balance in the liquid and vapor thermal layers (supposing a quadratic temperature distribution as proposed in [30]): 2 2 2 2 l l i i R R l l l li l l l l l i l i R R u u T T T r v dr r k k R t r r r R R
Eq. 3 vi
T
cT
liT
lT
Vapor Liquid iR
lR
vR
11/11
2 22
v Ri v v vi c v v v i v i Ru
u
T
T
r
v
dr
k
R
t
r
R
R
Eq. 4 Where:o The internal energy u rl( )u
l, ( )T rl
since liquid density is supposed to beconstant in the whole liquid region.
o Velocities in the liquid and vapor are given by:
2 2( ) / /
l i li i
v r R m R r (continuity equation) Eq. 5
( ) / /
v i vi i
v r R m
r R (radial linear reduction hypothesis from interface tocenter [30]) Eq. 6
Energy balance within the whole vapor bubble :
) ( ) ( ) ( 2 2 3 ) ( 3 1 III vi II R v v I i vi i R R v v c v v mu r T k R p R dr r u r dt d u R dt d i i v Eq. 7The first term on the right hand side is the pressure work connected to the volume change; the second term is the conductive heat exchanged with the vapor region across the interface; the third term is the internal energy associated with the mass flux of phase change.
Mass and energy equations at the interface:
(1/ 3)
vR
i vR
im
Eq. 8 2 2 lv i v c vi v i l l li l mh R R T T k R R T T k Eq. 9 vi li TT (Equilibrium condition) Eq. 10
4.2.2 Model benchmark
Fine implementation of the model was checked through a benchmark with a study from the literature [29] on a Na bubble collapse, as reported in Fig. 9. Note that such a case introduces a refinement concerning temperature discontinuity at the interface: mass transfer limitation is induced by a kinetic c-factor which could induce an inertia regime (c=1), a thermal regime (c = 0.01) or a mixed situation.
12/12
Fig. 9 Results of the bubble collapse in liquid sodium using Eq. 1 to 10, and comparison with [29].
4.2.3 CO2 bubble collapse results
The model is applied to study the collapse of a 1mm initial radius bubble in an infinite liquid domain at a temperature of 25°C. The liquid pressure is increased linearly, from an initial value of 6.436MPa, by 5% during 2.5ms (which can be seen as typical of the ramp within the mentioned SMR compressor [18]). Note that the density increase is below 3%, and thus is consistent with the model assumption.
Fig. 10 Transient results of a CO2 bubble collapse under a 5% linear increase in the
liquid pressure in 2.5ms (calculation time = 5ms). Top: radius and temperatures in the gas bulk and at the interface. Bottom: pressure in the gas bulk and at the
interface, phase change rate (negative when condensing).
0 1 2 3 4 x 10⁻³ 0 1 2 3 4 5 6 7x 10 -3 Bubble radius t(s) R i ( m ) 0 1 2 3 4 x 10⁻³ 1000 1100 1200 1300 1400 1500 1600
Vapor & liquid temperatures
t(s) T v , T li ( K ) R i,c=0.10 R i,c=0.01 Ri,c=1.00 Tv,c=0.10 Tli,c=0.10 Tv,c=1.00 Tli,c=1.00 c = 0.10 c = 0.01 c = 1.00
13/13
From Fig. 10, it comes out that:
Pressure dynamic at the interface matches the liquid pressure ramp: this is typical of the thermal regime due to combined effects of a large condensation heat flux that is released (to be connected to a high, liquid-like, gas density) and of thermal insulation in the liquid side (to be connected to a low thermal diffusivity). This induces a rise of the temperature interface that balances the ramp of liquid saturation condition. A main consequence is that bubble radius change just accommodates its density change (and therefore does not feature any surge such as in an inertia regime reported in Fig. 9 for c=1.).
Respective thicknesses of inner and outer thermal layers are of the same order of magnitudes (to be connected to the low, liquid-like, gas thermal diffusivity). Thermal insulation on the gas phase has a very remarkable consequence: due to its compression, temperature in the gas bulk increases (so that pressure) and this bubble warming impedes the condensation rate that indeed even finally reverses (evaporation) at t=2.5ms, just before the ending of the pressure ramp. After this date, condensation is again enhanced and a slow bubble contraction is predicted.
As a result, according to this simulation, specifics of the collapse in the vicinity of the critical point are a strong impact of the thermal regime, with a main role of the balance between liquid and gas phases thermal diffusivities. Additional calculations were performed which further exhibited the complex mechanism and the role on the dynamics of gas and liquid properties convergence and of latent heat vanishing.
5. CONCLUSIONS AND PROSPECTS
Net efficiency of a sCO2 condensing cycle is found to be up to 44% net for a turbine inlet operating at
(515°C, 25MPa); such a cycle would be therefore competitive with a traditional Rankine steam cycle for SFRs like heat source temperature. In-depth investigations of some paramount thermal-hydraulic issues regarding compression performance modeling and cavitation phenomenology near the critical point have been carried out:
– An approach that allows coping with the real gas behavior of the working fluid near the critical point by plotting compressor performance maps in adequate reduced coordinates (i.e. suitable dimensionless speed and flow parameters inputs and pressure ratio and enthalpy rise outputs), has been established. Limitation of another performance maps approach from the literature has been underlined and the revised approach has been validated using CFD. In support, numerical results have been confronted with some experimental data to qualify the ability of CFD to provide a relevant performance database. Next, the revised methodology could be valuably applied to model the performance maps of a N2 cycle (that is considered for SFRs and which
also features some real gas effects) and is additionally seen as a relevant support for future engineering work by reducing the required number of compressor qualification tests.
– Cavitation phenomenology of a CO2 bubble close to the critical point has been studied. First, the
increased risk of vapor pockets appearance inside a sCO2 compressor has been highlighted,
confirming an original caution from the literature. Then, dynamic of interface motion during the collapse has been analytically assessed and further numerically calculated, highlighting a physical explanation to the recent experimental observations about the absence of dysfunctional behavior during operation of a test compressor in the two-phase region. Thermal regime is indeed balanced to be the driving mechanism of bubble collapse nearby the critical point due to combined effects of liquid-like high density and low thermal diffusivity. The mechanism is actually complex due to convergence of both phases physical properties and of the latent heat vanishing. It would therefore deserve to be further explored and validated at laboratory scale. A deeper knowledge of this mechanism should enhance the thermodynamic and thermal-hydraulic engineering designs of the cycle and of its pumping machine.
14/14
NOMENCLATURE
Lattin letters Greek symbols
Isobaric heat capacity [J/kg/K] Thermal diffusivity [m2/s]
Coefficient of phase change Factor of Florschuetz and Chao
H Enthalpy [kJ/kg] Ratio of mixture density to liquid
density
Latent heat [J/kg] Thermal layer thickness [m]
Thermal conductivity [W/m/K] Specific heat ratio
M Mass flow rate [kg/s] Dynamic viscosity [Pa.s]
Rate of phase change [kg/s] Density [kg/m3]
P, p Pressure [Pa] Surface tension [N/m]
ns Isentropic exponent
Bubble radius [m]
Radial coordinate [m] or Specific gas constant [J/kg/K].
Temperature [°C]
Specific internal energy [J/kg]
Z Compressibility factor
Subscripts Superscript
ad Adimensional * At the saturation conditions
cr Critical conditions
cor Corrected by the reference conditions
Uniform vapor region inside the bubble
Final state (case of a liquid pressure rise)
Bubble interface
in Inlet
Liquid phase
At the liquid interface
In the bulk liquid
t Total value
Vapor phase
15/15
ACKNOWLEDGMENTS
Authors thanks SFR R&D project from CEA for supporting the activity on supercritical CO2 over 10
years, as well as the ALSTOM Company and US-Argonne National Laboratory for their close collaborations. Dr. Kisohara (Japan Atomic Energy Agency, JAEA) is also acknowledged for his strong support to promote the TiTech - CEA “Cooperation for computer analysis of the sc-CO2
compressor loop experimental data”. Indeed, sCO2 test compressor results embedded in that collaboration were entrusted to TiTech by the Ministry of Education, Culture, Sports, Science and Technology of Japan (MEXT). Both institutes are therefore deeply acknowledged.
REFERENCES
1. N. Alpy, D. Haubensack, N. Simon, L. Gicquel, G. Rodriguez, and L. Cachon, “Gas Cycle Testing Opportunity with ASTRID, the French SFR Prototype”, Proceeding of the 2011
Supercritical CO2 Power Cycle Symposium, Boulder, Colorado (United States), 24-25 May
(2011).
2. V. Dostal, “A Supercritical Carbon Dioxide Cycle for Next Generation Nuclear Reactors”,
PHD Dissertation, Massachusetts Institute of Technology (2004).
3. Y. Chen, “Thermodynamic Cycles using Carbon Dioxide as Working Fluid : CO2 Transcritical Power Cycle Study”, PHD Dissertation, KTH Royal Institute of Technology (2011).
4. D. Sanchez, R. Chacartegui, F. Jimenez-Espadafor, and T. Sanchez, “A New Concept for High Temperature Fuel Cell Hybrid Systems Using Supercritical Carbon Dioxide”, Journal of Fuel
Cell Science and Technology 6 (2) (2009).
5. C. S. Turchi, Z. Ma, T. W. Neises, and M. J. Wagner, “Thermodynamic Study of Advanced Supercritical Carbon Dioxide Power Cycles for Concentrating Solar Power Systems”, Journal
of Solar Energy Engineering 135 (4), p. 41007 (2013).
6. P. Hejzlar, V. Dostal, M. J. Driscoll, P. Dumaz, G. Poullennec, and N. Alpy, “Assessment of Gas-cooled Fast Reactor with Indirect Supercritical CO2 Cycle”, Nuclear Engineering and
Technology 38 (2), pp. 436–446 (2006).
7. H. J. Yoon, Y. Ahn, J. I. Lee, and Y. Addad, “Potential Advantages of Coupling Supercritical CO2 Brayton Cycle to Water-cooled Small and Medium Size Reactor”, Nuclear Engineering
and Design 245, pp. 223 – 232 (2012).
8. S. Ishiyama, Y. Muto, Y. Kato, S. Nishio, T. Hayashi, and Y. Nomoto, “Study of Steam, Helium and Supercritical CO2 Turbine Power Generations in Prototype Fusion Power Reactor”, Progress in Nuclear Energy 50 (2–6), pp. 325 – 332 (2008).
9. G. Angelino, “Carbon Dioxide Condensation Cycles For Power Production” Journal of
Engineering for Power 90 (3), pp. 287 – 295 (1968).
10. Y. Ahn, S.J. Bae, M. Kim, S.K. Cho, S.J. Baik, J.I. Lee and J.E. Cha, “Review of supercritical co2 power cycle technology and current status of research and development”, Nuclear
Engineering Technology 47, pp 647-661 (2015).
11. J.S. Noall, J.J. Pasch, “Achievable Efficiency and Stability of Supercritical CO2 Compression Systems”, Proceedings of the 2014 Supercritical CO2 Power Cycle Symposium, Pittsburgh, Pennsylvania (United States), 9-10 September (2014).
12. J. Floyd, N. Alpy, A. Moisseytsev, D. Haubensack, G. Rodriguez, J. Sienicki, and G. Avakian, “A Numerical Investigation of the sCO2 Recompression Cycle off-design Behaviour, Coupled to a Sodium-cooled Fast Reactor, for Seasonal Variation in the Heat Sink Temperature”,
Nuclear Engineering and Design 260, pp. 78–92 (2013).
13. D. Haubensack, C. Thévenot, and P. Dumaz, “The Copernic/Cyclop Computer Tool: Pre-conceptual Design of Generation 4 Nuclear Systems”, Proceedings of the 2004 Conference on
High Temperature Reactors, Beijing, China (2004).
14. J. A. Nelder and R. Mead, “A Simplex Method for Function Minimization”, The Computer
Journal 7(4), pp. 308 – 313 (1965).
15. R. Span, W. Wagner, “A New Equation of State for Carbon Dioxide Covering the Fluid Region from the Triple-Point Temperature to 1100 K at Pressures up to 800 MPa”, Journal of
16/16
Physical and Chemical Reference Data 25, p. 1509 (1996).
16. J. Floyd, N. Alpy, D. Haubensack, G. Avakian, and G. Rodriguez, “On-design Efficiency Reference Charts for the Supercritical CO2 Brayton Cycle Coupled to an SFR”, Proceedings
of the 2011 International Congress on Advances in Nuclear Power Plants (ICAPP’11), Nice,
France (2011).
17. L. Cachon, C. Biscarrat, F. Morin, D. Haubensack, I. Moro, “Innovative power conversion system for the French SFR prototype, ASTRID”. Proceedings of the 2012 International
Congress on Advances in Nuclear Power Plants - ICAPP '12, Chicago IL, United States,
24-28 June (2012).
18. H.S. Pham, N. Alpy, J.H. Ferrasse, O. Boutin, J. Quenaut, M. Tothill, D. Haubensack and M. Saez, “Mapping of the thermodynamic performance of the supercritical CO2 cycle and optimization for a small modular reactor and a sodium-cooled fast reactor”, Energy 87, pp. 4212-424 (2015).
19. M. Aritomi, T. Ishizuka, Y. Muto and N. Tsuzuki, “Performance Test Results of a Supercritical CO2 Compressor Used in a New Gas Turbine Generating System”, Journal of Power and
Energy Systems 5, pp. 45–59 (2011).
20. S.K. Roberts, S.A. Sjolander, “Effect of the Specific Heat Ratio on the Aerodynamic Performance of Turbomachinery”, Journal of Engineering for Gas Turbines and Power 127 (773) (2005).
21. A.Moisseytsev ∗, J.J. Sienicki, “Transient accident analysis of a supercritical carbon dioxide Brayton cycle energy converter coupled to an autonomous lead-cooled fast reactor”, Nuclear
Engineering and Design 238 (8), pp.2094-2105 (2008).
22. S.A. Wright, R.F. Radel, T.M. Conboy, and G.E. Rochau, “Modeling and Experimental Results for Condensing Supercritical CO2 Power Cycles”, Sandia Report 108840 (2011). Available online: http://prod.sandia.gov/techlib/access-control.cgi/2010/108840.pdf.
23. A.J. Glassman. Turbine Design and Application. NASA Lewis Research Center, Cleveland, United State (1972).
24. G. Mauger, “Description of an improved turbomachinery model to be developed in the cathare3 code for ASTRID power conversion system application”, Proceedings of the
International Topical Meeting on Nuclear Reactor Thermal Hydraulics NURETH-16, Chicago
IL, United States, 30 August-04 September (2015).
25. M.S. Plesset, “The dynamics of cavitation bubbles”, Journal of Applied Physics 16, pp. 277– 282 (1949).
26. Lord Rayleigh, “On the pressure developed in a liquid during the collapse of a spherical cavity”, Philosophical Magazine 6(34), pp. 94–98 (1917).
27. L.W. Florschuetz, B.T. Chao, “On the Mechanics of Vapor Bubble Collapse”, Journal of Heat
Transfer 87, pp. 209–220 (1965).
28. C.C. Tseng, W. Shyy, W., “Modeling for isothermal and cryogenic cavitation”, Journal of Heat
and Mass Transfer 53, pp. 513–525 (2010).
29. T. Theofanous, L. Biasi, H.S. Isbin, H. Fauske, “A theoretical study on bubble growth in constant and time-dependent pressure fields”, Chemical Engineering Science 24, pp. 885–897 (1969).
30. S. Fujikawa, T. Akamatsu, “Effects of the non-equilibrium condensation of vapour on the pressure wave produced by the collapse of a bubble in a liquid”, Journal of Fluid Mechanics 97, pp. 481–512 (1980).
![Fig. 6 Isentropic decreases of static temperature and pressure as a function of velocity increase according to CO 2 [15] and ideal gas thermodynamic models](https://thumb-eu.123doks.com/thumbv2/123doknet/12996351.379699/9.892.266.641.172.423/isentropic-decreases-temperature-pressure-function-velocity-according-thermodynamic.webp)
![Fig. 9 Results of the bubble collapse in liquid sodium using Eq. 1 to 10, and comparison with [29]](https://thumb-eu.123doks.com/thumbv2/123doknet/12996351.379699/13.892.131.770.108.335/fig-results-bubble-collapse-liquid-sodium-using-comparison.webp)
