HAL Id: cea-01053356
https://hal-cea.archives-ouvertes.fr/cea-01053356
Submitted on 30 Jul 2014
HAL is a multi-disciplinary open access
archive for the deposit and dissemination of sci-entific research documents, whether they are pub-lished or not. The documents may come from teaching and research institutions in France or abroad, or from public or private research centers.
L’archive ouverte pluridisciplinaire HAL, est destinée au dépôt et à la diffusion de documents scientifiques de niveau recherche, publiés ou non, émanant des établissements d’enseignement et de recherche français ou étrangers, des laboratoires publics ou privés.
Design, optical characterization, and operation of large
transmission gratings for the laser integration line and
laser megajoule facilities
Jerome Neauport, Eric Journot, Gaël Gaborit, Philippe Bouchut
To cite this version:
Jerome Neauport, Eric Journot, Gaël Gaborit, Philippe Bouchut. Design, optical characterization, and operation of large transmission gratings for the laser integration line and laser megajoule fa-cilities. Applied optics, Optical Society of America, 2005, pp.3143-3152. �10.1364/AO.44.003143�. �cea-01053356�
Design, optical characterization, and operation of
large transmission gratings for the laser
integration line and laser megajoule facilities
Jérôme Néauport, Eric Journot, Gaël Gaborit, and Philippe BouchutWithin the framework of the laser integration line (LIL) and the laser megajoule, we describe the design, optical characterization, mounting, alignment, and operation on the LIL of large 420 mm ⫻ 470 mm transmission gratings. Two types of grating were manufactured. The first, operating at a wavelength of 1.053 m, was used for deviation purposes. The second, operating at a wavelength of 0.351 m, was used for both deviation and focusing purposes. We demonstrate that these large transmission gratings are suitable for nanosecond-regime operation on high-power laser facilities. © 2005 Optical Society of America
OCIS codes: 140.0140, 050.1950, 080.3630, 220.4840.
1. Introduction
In fusion-class laser systems, such as the laser mega-joule1(LMJ) or National Ignition Facility (NIF),2the
energy transported by large laser beams needs to be focused on a small target of a size of approximately 1 mm at the wavelength of 0.351 m. The LMJ will thus be equipped with 240 beams having a section of 400 mm ⫻ 400 mm. Each laser line will be consti-tuted of 40 large optical components. The amplifica-tion as well as the transport of the large laser beams are made at a wavelength of 1.053 m (called 1). Frequency conversion at 0.351 m (called 3) and focusing are subsequently performed. The design and building of optical elements ensuring the focusing of such powerful laser beams have to take into account various constraints. As Latkowski et al.3 recently
pointed out, limiting the exposure of the final optics assembly to laser-induced high-energy neutrons and gamma rays is a key issue for limiting maintenance cost of this expensive end part of the laser line.
There-fore, since 1994 we have worked out focusing solu-tions that satisfy this constraint. Since laser–target interaction is performed at 3, the residual 1 and 2 remaining after frequency conversion must be separated from the main 3 laser beam. For most of the laser–target vacuum chamber space to be used for diagnostics, it was necessary to perform this wave-length separation before the beam enters the cham-ber. Let us now focus on the optical component involved in the laser beam focusing. To minimize the final focal spot size, limit the laser line cost, and facilitate maintenance operations, we restricted to one or two the number of optics involved in focusing. Note that for high-power lasers, high damage thresh-old optics are needed. The typical fluence specifica-tion for optics operating at 0.351 m ranges from 10 to 16 J兾cm2, depending on the position of these optics
within the laser line. Taking into account alignment uncertainty, optics aberrations, and stability consid-erations of the laser lines, we show that the optics guaranteeing the focusing function have to be almost diffraction limited at their operating wavelengths. On the basis of these considerations, reflective, re-fractive, or diffractive solutions have been sought.
Our refractive solutions used mirrors to focus the light at a wavelength of 0.351 m. Though this prin-ciple have been already applied on other laser driv-ers,4we found out that using a combination of a plane
mirror and a parabolic focusing mirror for our system led us to cumbersome solutions. Moreover, despite the latest significant progress made, high-reflection
J. Néauport (jerome.neauport@cea.fr), E. Journot, and G. Ga-borit are with the Commissariat à l’Energie Atomique, Centre d’Etudes Scientifiques et Techniques d’Aquitaine, BP2, Le Barp Cedex, France, 33114. P. Bouchut is with the Commissariat à l’Energie Atomique Laboratoire d’Electronique de Technologie de l’Information, 17 rue des Martyrs, 38054 Grenoble Cedex 9, France.
Received 12 July 2004; revised manuscript received 27 October 2004; accepted 5 November 2004.
0003-6935/05/163143-10$15.00/0 © 2005 Optical Society of America
coatings based on fluoride materials could not sustain high fluence at 0.351 m and had rather complex coating designs.5Hence, they were discarded.
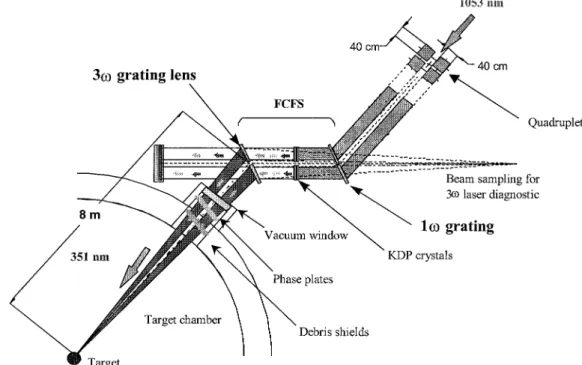
Refractive designs used an aspheric prismatic lens to focus the 3 light at the center of the vacuum chamber. Taking into account the neutrons isolation and the wavelength separation constraints, the re-fractive designs led us to complex solutions and were therefore dismissed. Designs based on diffractive el-ements were compatible with our constraints and led us to the final optics assembly baseline depicted in Fig. 1. Focusing and wavelength separation is made by a focusing grating called the 3 grating. This grat-ing is equivalent to a very chromatic off-axis lens and is introduced after the frequency conversion com-pleted by KDP crystals. Since it is used in a diffracted order, the 3 grating introduces an optical path dif-ference between top and bottom rays that must be compensated, if laser-pulse-width broadening is to be avoided. This is done by a second grating, called the 1 grating, working at a wavelength of 1.053 m and located just before the KDP crystals. Resorting to these two diffractive optics led us to this zigzag setup and enabled isolation from neutrons and gamma rays to be performed. Moreover, since the laser is used in broad spectral bandwidth for beam-smoothing pur-poses,6 dispersion of the 1 grating enhances the
KDP conversion yield because the phase-matching angle of each wavelength on the KDP crystals is adapted.7 Another advantage of the diffractive
method is due to the holographic nature of the 3 grating. By construction, this grating features a fo-cused reflected order that can be used for laser line focal spot diagnostic.
We herein present the developments we have achieved to have our gratings operational in our final
optics assembly. The design of these two diffractive components is depicted in Section 2. Final specifica-tions and some manufacturing consideraspecifica-tions are de-tailed in Section 3. Optical metrology of the components and results are presented in Section 4. Finally, we present data obtained on the laser inte-gration line (LIL). This 1兾60 scale prototype of the LMJ, equipped with 8 laser beams of full aperture, used the manufactured gratings.
2. Design of the 1 and 3 Gratings
Designs of 1 and 3 gratings are very similar. The following discussion is mainly based on the 1 grat-ing design. Transposition to the 3 gratgrat-ing is briefly discussed at the end of this section. Since the purpose of large-laser fusion facilities is to bring the maxi-mum amount of energy onto the target, the losses incurred by the gratings must be as low as possible. We thus want a diffraction efficiency of more than 90%. Moreover, high damage threshold optics in UV are needed. Therefore, pure fused-silica optics are necessary. Accordingly, the only affordable gratings are engraved on fused silica.
The main task was then to draw a highly efficient grating operating in TM polarization (the plane of polarization of the E vector is in the plane of inci-dence). This polarization was retained for conversion frequency considerations.7
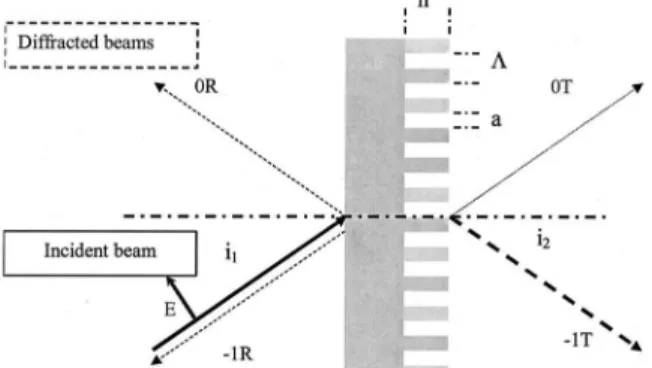
The basic geometric law of diffraction grating re-lates the incident 共i1兲and diffraction 共ip兲angles with
the wavelength () and period of the grating (⌳) [see Fig. 2 and Eq. (1)]. We use the notation ᎑pR for re-flected orders and ᎑pT for transmitted orders.
sin i1⫹ sin ip⫽ ⫺p 兾⌳ (1)
To achieve high diffraction efficiency in a specific der, it is necessary to minimize the number p of or-ders in which the energy can be diffracted. However, diffraction by phase discontinuity of the refractive profile structure implies that all available orders con-tain energy, even though a refractive profile for one specific order is optimized. If ⌳ is greater than 20, diffraction is well described by geometric analysis of phase in the various diffracted waves, and for smaller ⌳, we need to solve Maxwell’s equations in the peri-odic structure to assess the diffraction efficiency of each diffracted order. It is very difficult to experimen-tally achieve more than 80%– 85% of diffraction effi-ciency in one specific order with this kind of grating. This experimental fact is consistent with the well-known energy contained in the first ring of the dif-fraction figure of a circular pupil. Hence, to reach our goal of 90% diffraction efficiency in 1 order, we must design a grating with ⌳ close to since Eq. (1) shows that p values can yet only be ⫺1, 0, 1.
As previously demonstrated,8,9 symmetrical
dif-fracting profiles with a symmetrical operational con-figuration are likely to maximize the energy diffraction in 1 order. By choosing the angle of inci-dence to eliminate the p ⫽ 1 solution, we obtain 2 orders accessible to the diffracted energy: p ⫽ 0 or p ⫽ ⫺1. Given that our gratings operate in transmis-sion, the reflected orders will have an efficiency less or equal to Fresnel’s reflection coefficient. The period of the grating being close to the wavelength, the ap-parent index of the grating profile is averaged be-tween glass and air indexes. In fact, the grating profile behaves like an antireflection coating depos-ited on the bulk glass substrate and induces the ef-ficiency of reflected orders to be very small (less than 1%). Our last degree of freedom to optimize the p ⫽ ⫺1 T order in terms of diffraction efficiency is the geometry of the grating profile. This geometry is de-fined by the type of profile (triangle, square. . .), the depth of the grooves (h) and the duty cycle (DC) [Eq. 2].
DC ⫽ (⌳ ⫺ a)兾⌳. (2)
We then must solve Maxwell’s equations for the re-tained grating, optimizing h to achieve the best
dif-fraction efficiency of the ⫺1T order. To perform that, the GSOLVER code was used.10 This code is
dedi-cated to diffraction calculation for every kind of grat-ing and was run on a desktop PC. By our settgrat-ing all the parameters of the grating (wavelength, grating period and profile, DC, depth, material index and absorption, and polarization state of the incident wave) except for a variable one, the code calculates the diffraction efficiency of all the orders for a given value of the variable. Using this procedure, we find a theoretical value of h that achieves 100% of the trans-mitted diffracted energy in the ⫺1T order. For most cases, the depth of the profile is approximately 2–3 times the period of the grating.
We have to keep in mind that we must manufac-ture a lamellar grating in fused silica with a spatial period of approximately 0.35 m for the 3 grating. The holographic recording process, detailed in Section 3, is the only one producing large optical components with such fine structures. All the manufacturing steps of this process need a lot of care, but the etching one is the most difficult to achieve. Therefore, to loosen the design constraints, one has to minimize the grating profile depth. Furthermore, the holographic recording and etching make a square profile easier to achieve.
Accordingly, we determined the optimum depth of the structure for a DC of 0.5 and then checked the sensitivity of diffraction efficiency with respect to small variation of depth, DC, incident angle, wave-length, and index. Using GSOLVER, we have found that whatever the profile, the minimal depth is achieved for DC ⫽ 0.5. The minimum depth is ob-tained for a square profile but with a tiny loss of efficiency.
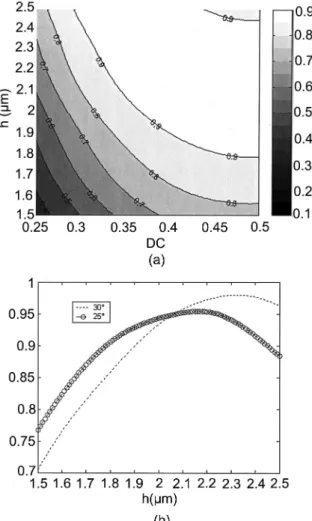
Although Kogelnik8 has shown that the best
con-figuration to optimize the ⫺1T order is i1 ⫽ i⫺1
⫽ 30°, ⫽ ⌳ ⫽ 1.053 m, we have found that this configuration leads to quite deep gratings (Fig. 3). We were seeking the least-sensitive operating configura-tion with respect to fabricaconfigura-tion parameters (h, DC), with more than 90% efficiency and the smallest pos-sible depth. The only parameter that can change is
Fig. 2. Operational configuration of the transmission grating.
Fig. 3. Diffraction efficiency in the ⫺1T order, 30° incidence, TM, and wavelength of 1.053 m.
the incident angle, and a more robust operational configuration is obtained for an incident angle of 25°. In Fig. 4 a typical diffraction efficiency abacus for variables (h, DC) for such a 1 grating operating at 25° in TM is shown and compared to the 30° solution for DC ⫽ 0.5.
The final theoretical 1 grating retained configu-ration is ⫽ 1.053 m, i ⫽ 25°, ⌳ ⫽ 2.4564 m (groove density of 803.019 g兾mm), h ⫽ 2.1 m, DC ⫽ 0.4 to 0.5, Diffraction efficiency ⬎90%.
The design of the 3 grating is very similar:
i ⫽ 25° (same incident angle to compensate the optical path difference),
3 ⫽ 1兾3,
⌳3⫽ ⌳1兾3 (groove density of 2409.058 g兾mm),
h3 ⫽ h1兾3,
DC ⫽ 0.4 to 0.5,
Diffraction efficiency ⬎90%.
The major characteristic of the 3 grating is that it is a focusing grating. To achieve focusing one needs to modify the holographic recording configuration as de-scribed in next section in order to obtain slightly curved and no equispaced grooves.
3. Specifications for the 1 and 3 Gratings
On the basis of the work presented in Section 2, the specifications detailed in Table 1 were selected for the 1 and 3 LIL兾LMJ gratings. Diffracted ⫺1T wave-front quality is specified in terms of encircled energy for the 3 focusing grating. For the 1 grating, we have specified the curvature of the wave front in the
Fig. 4. (a) Diffraction efficiency in the ⫺1T order, 25° incidence, TM, and wavelength of 1.053 m (b) 30° and 25° gratings diffrac-tion efficiency ⫺1T order TM for DC ⫽ 0.5.
Table 1. 1 and 3 Gratings Specifications
Gratings
Specification 1 3
Wavelength 共m兲 1.053 0.351
Polarization TM TM
Substrate Fused silica Fused silica Dimensions 420 mm ⫻ 470 mm 420 mm ⫻ 470 mm Clear aperture 400 mm ⫻ 450 mm 400 mm ⫻ 450 mm
Incidence 25° 25°
Deviation for the geometric center of the quadruplet 50° 50°
Focal distance - 8 m
Efficiency in the ⫺1T order ⬎90% ⬎90% Efficiency in the ⫺1R order - ⬎1% Damage threshold for 3᎑ns pulses at 1.053 m ⬎25 J兾cm2
-Damage threshold for 3᎑ns pulses at 0.351 m - ⬎12 J兾cm2 Focal spot encircled energy (diameter) - 90% ⬍50 m
95% ⬍90 m Transmitted wave-front quality on clear aperture Curvature ⬍1 m
⫺1T order. We have also specified the maximal slope of this diffracted wave front in microradians after suppressing the wave-front curvature.
Grating manufacturing was done by Jobin Yvon using a conventional holographic process (Fig. 5). A polished substrate is covered with a photosensitive resin. The latter is exposed onto a holographic bench. The pattern generated by the interference of two plane wave fronts is used for recording the 1 grat-ing. A plane and a spherical wave front are used to introduce the focusing property of the 3 grating. The exposed photosensitive layer is then developed to dis-play grooves in relief on the substrate. This structure is then transferred into the fused-silica substrate by an ion-etching process.
4. Gratings Characterization
A. Wave-Front Quality
To check the power and maximum slope of a trans-mitted wave front in the first order of the 1 grating, we use a ZYGO interferometer set with an 800᎑mm expander. This interferometer is equipped with a modified ZYGO MARK IV mainframe operating at 1.064 m. Two reference flats are used (800᎑mm di-ameter, flatness close to 60 nm on a 400 ⫻ 400 mm2aperture). The phase map is achieved as a result of the interferometer using a software called FLIP,11 which is based on a spatial linear carrier
analysis.12With this method 1 interferogram of
ap-proximately 50 fringes (tilt between the reference and the transmitted wave front) is needed to calcu-late the phase map of the wave front. Therefore, it has the advantage of being slightly sensitive to vibra-tion, compared with the phase-shifting method. It
enables us to measure large components without moving a large reference flat with a piezoelectric. We obtained the measured wave front by averaging 50 interferograms with 2 opposite tilts. However, the measurement tilt limits the spatial resolution to a period greater than 10 mm. The analysis of the phase map is made by a software called Anaphase.13This
software is used by all LIL兾LMJ optics manufactur-ers and computes all parametmanufactur-ers of the specified wave front [power, peak to valley (p.v.), rms, slope, etc.].
A typical 1 grating ⫺1T order transmitted wave front is shown on Fig. 6. The wave-front curvature is
Fig. 5. Grating manufacturing process.
Fig. 6. Transmitted wave front of a 1 grating (00-0007) in nano-meters, ⫺1T order, 1.064᎑m wavelength, TM polarization. Power, 110 nm; p.v. without power, 410 nm; maximum slope, 9 rad.
far below Commissariat à l’Energie Atomique (CEA) specification. We have noticed that a residual amount of aberrations has been introduced during the grating recording. The maximal slope is beyond CEA’s spec-ification. However, since the defect is located at the edge of the clear aperture, the component can be used without problems.
The 3 grating ⫺1T order focal spot is also a good indication of the wave-front quality. This focal spot
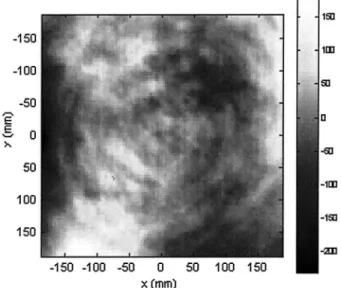
Fig. 7. (a) Efficiency of a 1 grating (99-0135), ⫺1T order, 1.053᎑m wavelength, and TM polarization. (b) Efficiency of a 3 grating (CH03-03), ⫺1T order, 0.351᎑m wavelength, and TM polarization.
Table 2. Focal Spot Analysis of 3- Grating
Focal spot encircled energy diameter 00-0006 (m) Specification (m) ⬎90% 57 50 ⬎95% 92 90
was measured in operating conditions by Jobin Yvon. Some findings obtained on a 3 grating are given in Table 2. The measured focal spot is very close to CEA’s specification. Other far-field images of the 3 grating have been also detailed before.6
B. Diffraction Efficiency
We have developed a specific photometer together with Société Européene des Systèmes Optiques Com-pany14in order to check the photometric
character-istics of our gratings. This device is a single-point scanning system. The beam (A ⬃ 5 mm at 1兾e in intensity) is stationary while the undergoing compo-nent moves parallel to its surface. The photometer uses two detectors:
- a reference detector, monitoring laser power varia-tions during scanning (approximately 30 min), - a signal detector, measuring transmission or
reflec-tion powers.
The signal detector follows the beam during the scanning motion. This point is significant for the 3 grating since the local deviations vary all along the scanned surface.
A calibration is made before each measurement by use of the transmission through air for a coefficient close to 1 or a reflection on a fused-silica plate for a coefficient close to 0.01. The photometer performs measurements with two linear polarizations (TM or TE) at three wavelengths (1.053, 0.5265, and 0.351 m) delivered by a unique Q-switched laser. The estimated absolute accuracy of the photometer is 0.002 共k ⫽ 3兲 for a coefficient close to 1 and 0.0002 共k ⫽ 3兲 for a coefficient close to 0.01.
With this setup, it was possible to measure the diffraction efficiency of various gratings by scanning the clear aperture, with a sampling step of 20 mm ⫻ 20 mm in their ⫺1T order at their operating wave-length in TM polarization. Figure 7(a) shows the ef-ficiency map obtained for a 1 grating. The substrate on which the grating was etched had a solgel coating deposited on the other side. Figure 7(b) shows the efficiency map obtained on a 3 grating sample. The back side of the substrate was not solgel coated and therefore, the Fresnel losses have not been taken into account (approximately 2.5%). In both cases, excel-lent diffraction efficiencies were measured with mean values of approximately 95.0% for the 1 grating and 93.9% for the 3 grating (Fresnel losses of the back side deducted).
C. Laser-Induced Damage Threshold
We measured laser-induced damage threshold at the wavelength of 1.064 m for the 1 grating and 0.355 m for the 3 grating by using an automated damage test facility that has been described previ-ously.15 Multiple pulses of increasing energy were
sent on a site until scattering was detected by a di-agnostic with a He–Ne laser source. A ramp-on-site (R兾1) procedure was employed. During this proce-dure, more than 200 sites were tested on a 100᎑mm
grating sample, giving access to the statistical weight of the peak fluence at which the damage occurred. Minimal, mean, and maximal values of this statisti-cal repartition were then computed. Testing at 1.064 m was made with a Coherent Infinity laser with a pulse duration of 3 ns, the laser beam surface on the sample being equivalent to a Gaussian beam of 0.2 mm2. Testing at 0.355 m required use of a
Spec-tra Physics GCR-350 laser source with a pulse dura-tion of 6.8 ns, the laser beam surface on the sample being 0.02 mm2. Data gathered during measurement
at 0.355 m were rescaled for 3᎑ns pulse duration by use of the 0.5 scaling factor.16 Samples were
mea-sured at their working incidence in TM polarization, with grating surface being placed on the exit surface of the laser beam. The R兾1 damage testing procedure was chosen because it was convenient for small sam-ples. Moreover, it is a reliable indicator for the im-provement of the damage threshold all along the grating manufacturing process development. Note that it is not a direct indicator of the optics lifetime for the 3 grating operating at 0.351 m since lifetime is governed at this wavelength both by damage initia-tion and by damage growth.17
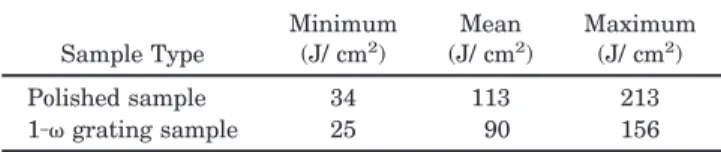
Tables 3 and 4 present our findings. To evaluate the effect of grating manufacturing, we compared the results with those of a polished sample with no grating engraved. Minimal threshold of the 1 grat-ing 共25 J兾cm2
兲is compatible with our specification. However, grating manufacturing induces a degra-dation of the performances of the original finished substrate. Up to now, we have not been able to account for this phenomenon or to relate it to a specific manufacturing process step of the grating. As we have not noticed any evolution of the 1 grating operating on LIL (see Subsection 4.B), this problem has not been further investigated. As de-scribed before by Nguyen et al.,18 the 3 grating
performances are limited by the polished substrate. Besides, we have noticed an improvement of both mean and maximal values of the damage threshold on the 3 grating. This improvement has been
at-Table 3. Laser-Induced Damage Threshold of a 1- Grating Compared with the Threshold of a Polished Sample without Grating Engraveda
Sample Type Minimum (J/ cm2) Mean (J/ cm2) Maximum (J/ cm2) Polished sample 34 113 213 1᎑ grating sample 25 90 156 aR兾1 testing mode, 1.064 m, 3 ns.
Table 4. Laser-Induced Damage Threshold of a 3- Grating Compared with the Threshold of a Polished Sample without Grating Engraveda
Sample Type Minimum (J/ cm2) Mean (J/ cm2) Maximum (J/ cm2) Polished sample 10,5 16 26 3᎑ grating sample 10,5 29 50
tributed to the etching process of the grating. The lifetime at 351 nm of fused-silica optics will proba-bly be essentially affected by surface flaws and con-taminants left by polishing processes. Growth of laser-induced damage initiated at these defects is
the key factor of the operational durability of any fused-silica optics, including gratings.
5. Operation of the 1 and 3 gratings on the Laser Integration Line
A. Integration and Alignment Principles of the Grating
As explained in Section 1, the final optics assembly must focus four UV beams on a single point. To achieve this and to avoid any problem related to ghost beams, one needs to correctly align the 1 and 3 gratings in x–y and z and theta x and theta y direc-tions.
The angular tuning of the 1 gratings has been performed with a high-precision theodolithe. We tuned theta x and theta y alignment by observing the classic 0R reflection order of the grating and the theta z alignment thanks to the ⫺1R order (Fig. 8). At the end of this process, the four 1 gratings are parallel to one another within a tolerance of 10 s of arc in each angular direction. The group of 1 gratings has then been integrated in the final optics assembly.
The alignment of the 3 gratings is more compli-cated and has been done in two steps. The first step was very similar to the 1 grating alignment, whereas the second step was performed through a wave-front sensor. Alignment has been carried out with the final optics assembly mounted on its align-ment bench. An optical fiber, lit by a 3 laser, illu-minates the final optics assembly and acts as a 3
Fig. 8. Grating alignment principle.
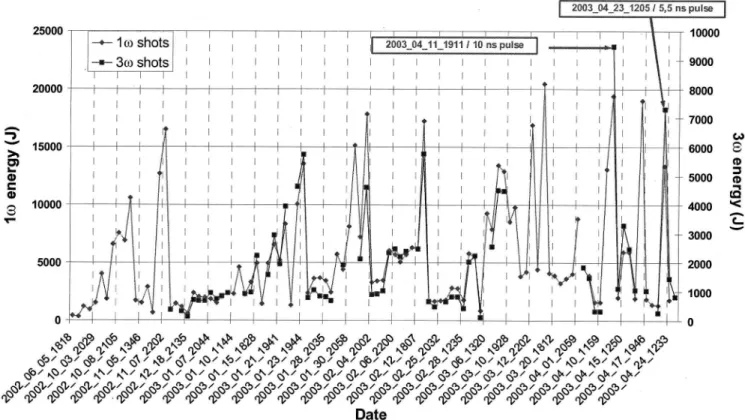
Fig. 9. Shots energy and chronology. LIL campaign (one beam line) from 2 June to 3 April. Energy at 1.053 and 0.351 m for each shot.
point source. This diverging beam is collimated by the 3 gratings, diffracted in the ⫺3T order by the 1 gratings, then reflected back by a mirror (which is the alignment reference of the final optics assembly), dif-fracted again by the 1 gratings, and finally focused by the 3 gratings. The position of each focal spot has been tuned by translation of the 3 gratings in x–y–z alignment. Tilting the 3 gratings tuned the focal spot quality. The wave-front analysis has been done in the vicinity of ⫺1T foci.
As noted before, ⫺1R foci also exist, and the super-imposition of the four ⫺1R focal spots has been checked at each step of the alignment process.
When the alignment of the final optics assembly has been completed
i. the focused ⫺1T beams are superimposed to the 3 source point with a quality close to the diffraction limit,
ii. the focused ⫺1R beams are superimposed.
B. Operation of the Gratings on the Laser Integration Line Ramp-Up Campaign
During the characterization of the LIL laser perfor-mances, we have explored an energy兾power diagram with specific points: 2 TW兾700 ps, 7.3 kJ兾5 ns, and 9.5 kJ兾9 ns (Fig. 9). Both 1 and 3 gratings operat-ing on the LIL have been observed and measured before and after the shot campaign. We have not noticed any significant evolution of the 1 grating despite shots at more than 15 kJ sustained by this grating during the campaign. Regarding the 3 grat-ing, some damage appeared on the grating surface with a good correlation with the position of the laser beam hot spots. This damage was typical of that gen-erated on fused-silica polished surfaces at the wave-length of 0.351 m. Our conclusions, supported by experiments described in Subsection 4.C, are that damage is induced by weak points of the finished substrate before grating manufacturing. Moreover, a measurement of the diffraction efficiency of the 3 grating at the wavelength of 0.351 m in its ⫺1T order revealed no significant evolution of the effi-ciency as shown on Table 5.
6. Conclusion
Although 100% diffraction efficiency gratings have been put forward before, we have suggested a new design of gratings, making the production of large-size optics possible with a diffraction efficiency of more than 90%. These optics are made by use of a conventional holographic process and present high
damage thresholds at both 1 and 3. These compo-nents permit the laser beam to be focused with a quality similar to that of an aspheric lens. We have also described an alignment procedure that makes it possible to focus four 3 laser beams onto the same focal spot. The very good performances achieved in our laboratory have been confirmed during the LIL operation. More than 40 1 and 3 large gratings have been successfully produced and tested, thus demonstrating the relevance of diffractive optics for large-power laser facilities.
We acknowledge J. Flamand, F. Bonnemason, G. de Villèle, Y. Josserand, S. Kaladgew, P. Gacoin, and the entire Jobin Yvon LIL兾LMJ manufacturing team for their enduring enthusiasm, efforts, and compe-tence during the development and production of LIL gratings. We thank also J. Paye, who was at the origin of the grating focusing idea in 1994.
References
1. M. L. André, “Status of the LMJ project,” in Solid State Lasers for Application to Inertial Confinement Fusion: Second Annual International Conference, M. L. André, ed., Proc. SPIE 3047, 38 – 42 (1996).
2. W. H. Lowdermilk, “Status of the National Ignition Facility project,” in Solid State Lasers for Application to Inertial Con-finement Fusion: Second Annual International Conference, M. L. André, ed., Proc. SPIE 3047, 16 –37 (1996).
3. J. F. Latkowski, Alison Kubota, M. J. Caturla, S. N. Dixit, J. A. Speth, and S. A. Payne, “Fused silica final optics for inertial fusion energy: radiation studies and system-level analysis,” Fusion Technol. 43, 540 –558 (2003).
4. R. L. Bieri and M. W. Guinan, “Grazing incidence metal mir-rors as the final elements in a laser driver for inertial confine-ment fusion,” Fusion Technol. 19, 673– 678 (1991).
5. J. Dijon, E. Quesnel, B. Rolland, P. Garrec, C. Pelle, and J. Hue, “High-damage threshold fluoride UV mirrors made by ion-beam sputtering,” in Laser-Induced Damage in Optical Materials: 1997, G. J. Exarhos, A. H. Guenther, M. R. Kozlow-ski, and M. J. Soileau, eds., Proc. SPIE 3244, 406 – 416 (1998). 6. J. Néauport, X. Ribeyre, J. Daurios, D. Valla, M. Lavergne, V. Beau, and L. Videau, “Design and optical characterization of a large continuous phase plate for Laser Integration Line and laser Megajoule facilities,” Appl. Opt. 42, 2377–2382 (2003). 7. A. Adolf, A. Boscheron, A. Dulac, and E. Journot, “Final optics
design for the Megajoule laser,” in Third International ference on Solid State Lasers for Application to Inertial Con-finement Fusion, W. H. Lowdermilk, ed., Proc. SPIE 3492, 44 –50 (1999).
8. H. Kogelnik, “Coupled wave theory for thick holographic grat-ings,” Bell Syst. Tech J. 48, 2909 –2947 (1969).
9. T. K. Gaylord and M. G. Moharam, “Analysis and applications of optical diffraction by gratings,” in Proc. IEEE 73, 894 –937 (1985).
10. Grating Solver Development Company, P.O. Box 353, Allen, Texas, 75013.
11. Flow Interferogram Processing, software developed by SA-GEM St Pierre du Perray, Avenue de la Tour Maury, 91280 St Pierre du Perray, France.
12. D. Malacara, M. Servin, and Z. Malacara, Interfergram Anal-ysis for Optical Testing (Marcel Dekker, New York), pp. 285– 335.
13. A. Liard, M. Bray, and G. Chabassier, “Laser megajoule optics: II. Wavefront analysis in the testing of large components,” in
Table 5. Evolution of the Diffraction Efficiency of the 3- Grating before and after LIL Campaign on a Centered300 ⫻ 280 mm2portion of
the Clear Aperturea
Status ⫺1T Order Efficiency at 0.351 m Before campaign 94.1% ⫾ 0.4%
After campaign 94.5% ⫾ 0.4%
Optical Fabrication and Testing, R. Geyl and J. Maxwell, eds., Proc. SPIE 3739, 461– 473 (1999).
14. Société Européenne des Systèmes Optiques, Pôle d’activité d’Aix les Milles, 305 rue L. Armand, BP55000, 13792 Aix en Provence Cedex 3, France.
15. J. Hue, J. Dijon, G. Ravel, P. Lyan, P. Garrec, T. Lanternier, M. Olivier, and A. Lagrande, “Automatic YAG damage test bench-es: additional possibilities,” in Laser-Induced Damage Thresh-old in Optical Materials: 1998, G. J. Exarhos, A. H. Huenther, M. R. Kozlowski, K. L. Lewis, and M. J. Soileau, eds., Proc. SPIE 3578, 290 –301 (1998).
16. J. H. Campbell, F. Rainer, M. R. Kozlowski, C. R. Wolfe, I. M. Thomas, and F. P. Milanovitch, “Damage resistant optics for a
megajoule laser,” in Laser-Induced Damage Threshold in Op-tical Materials: 1990, H. E. Bennett, L. L. Chase, A. H. Guen-ther, B. E. Newnam, M. J. Soileau, eds., Proc. SPIE 1441, 444 – 456 (1990).
17. H. Bercegol, P. Bouchut, L. Lamaignere, B. Le Garrec, and G. Raze, “The impact of laser damage on the lifetime of optical components in fusion lasers,” in Laser-Induced Damage Threshold in Optical Materials: 2003, G. J. Exarhos, A. H. Guenther, N. Kaiser, K. L. Lewis, M. J. Soileau, and C. J. Stolz, eds., Proc. SPIE 5273, 312–324 (2004).
18. H. T. Nguyen, B. W. Shore, S. J. Bryan, J. A. Britten, R. D. Boyd, and M. D. Perry, “High efficiency fused-silica transmis-sion gratings,” Opt. Lett. 22, 142–144 (1997).