HAL Id: hal-03120979
https://hal.archives-ouvertes.fr/hal-03120979
Submitted on 19 Mar 2021
HAL is a multi-disciplinary open access
archive for the deposit and dissemination of
sci-entific research documents, whether they are
pub-lished or not. The documents may come from
teaching and research institutions in France or
abroad, or from public or private research centers.
L’archive ouverte pluridisciplinaire HAL, est
destinée au dépôt et à la diffusion de documents
scientifiques de niveau recherche, publiés ou non,
émanant des établissements d’enseignement et de
recherche français ou étrangers, des laboratoires
publics ou privés.
Evaluation of aerosol indirect radiative forcing in
MIRAGE
Steven Ghan, Richard Easter, James Hudson, Francois-Marie Bréon
To cite this version:
Steven Ghan, Richard Easter, James Hudson, Francois-Marie Bréon. Evaluation of aerosol indirect
radiative forcing in MIRAGE. Journal of Geophysical Research: Atmospheres, American Geophysical
Union, 2001, 106 (D6), pp.5317-5334. �10.1029/2000JD900501�. �hal-03120979�
JOURNAL OF GEOPHYSICAL RESEARCH, VOL. 106, NO. D6, PAGES 5317-5334, MARCH 27, 2001
Evaluation of aerosol indirect radiative forcing in MIRAGE
Steven Ghan and Richard Easter
Pacific Northwest National Laboratory, Richland, Washington James Hudson
Desert Research Institute, Reno, Nevada
Francois-Marie Br6on
CEA Laboratoire des Sciences du Climat et de l'Environnement, Gif-sur-Yvette, France
Abstract. We evaluate aerosol indirect radiative forcing simulated by the Model for
Integrated
Research
on Atmospheric
Global Exchange
(M/RAGE). Although explicit
measurements of aerosol indirect radiative forcing do not exist, measurements of many of the links between aerosols and indirect radiative forcing are available and can be used for evalu-ation. These links include the cloud condensation
nuclei concentration,
the ratio of droplet
number to aerosol number, the droplet number concentration, the column droplet number, thecolumn
cloud water, the droplet effective radius, the cloud optical depth, the correlation
between
cloud albedo
and droplet
effective radius,
and the cloud radiative
forcing. The CCN
concentration simulated by MIRAGE agrees with measurements for supersaturations largerthan 0.1% but not for smaller supersaturations.
Simulated
droplet number concentrations
are
too low in most but not all locations with available measurements, even when normalized by aerosol number. MIRAGE correctly simulates the higher droplet numbers and smallerdroplet
sizes
over continents
and in the Northern
Hemisphere.
Biases
in column cloud water,
cloud optical depth, and shortwave
cloud radiative
forcing are evident in the Intertropical
Convergence Zone and in the subtropical oceans. MIRAGE correctly simulates a negativecorrelation
between
cloud albedo and droplet size over remote oceans
for cloud optical
depths
greater
than 15 and a positive
correlation
for cloud optical depths
less than 15 but fails
to simulate a negative correlation over land.1. Introduction
One of the greatest sources of uncertainty in estimates of anthropogenic climate change is in the estimate of the indirect radiative forcing, in which aerosol particles are activated to form cloud droplets, thereby influencing cloud reflectivity by changing the droplet effective radius [Twomey, 1977; Charlson et al., 1992] and the cloud liquid water content [Fouquart and lsaka, 1992; Hudson, 1993; Rotstayn, 1999]. The uncertainty in estimates of the global mean indirect radia-
tive forcing
by anthropogenic
aerosol
is roughly
1.5 W m
'2,
which is more than half the present global mean radiative forcing due to anthropogenic increases in greenhouse gas concentrations, and comparable to the global mean of the sum of the forcing by increasing greenhouse gases and the direct forcing by anthropogenic aerosols [Intergovernmental Panel on Climate Change (IPCC), 1995]. The total present-day anthropogenic forcing can therefore range from less thanI W m
'2 to more
than
4 W m
'•. The
uncertainty
in the
indirect
component of the anthropogenic aerosol forcing must be sub- stantially reduced if the anthropogenic signal of climate change is to be detected in the observed climate record and ifCopyright 2001 by the American Geophysical Union.
Paper number 2000JD900501.
0148-0227/01/2000JD900501 $09.00
predictions of future climate change are to be useful for
assessing
climate
impacts
and developing
a policy for miti-
gating climate change.How can the uncertainty be reduced? Penner et al. [1994]
and the National Research Council (NRC) [1996] Panel on
Aerosol Radiative Forcing and Climate Change describe a strategy involving a combination of in situ measarements, satellite measurements, and modeling studies designed to evaluate and improve understanding of the key processes involving direct as well as indirect radiative forcing. This strategy has led to increasing sophistication in global model estimates of indirect forcing. Several global modeling groaps have applied empirical relationships between pollutant con- centrations and cloud droplet number to estimate the indirect forcing [Jones et al., 1994; Boucher and Lohmann, 1995; Jones and Slingo, 1996; Lohmann and Feichter, 1997; Rotstayn, 1999]. More recently, Ghan et al. [1997b] introduced a physically based relationship between aerosol concentration and cloud droplet number, which Chuang et al. [1997] and Lohman et al. [1999] applied to global coapled chemistry-aerosol circulation models. These physically base• models are necessary to separate the natural and anthro- pogenic components of the forcing and to consider future scenarios of emissions of aerosols and their precursor gases.
The Pacific Northwest National Laboratory (PNF•) Model for Integrated Research on Atmospl'•eric Global Exchaage (MIRAGE) was developed for such a purpose. It consists of a
5318 GHAN ET AL.: EVALUATION OF AEROSOL INDIRECT RADIATIVE FORCING
detailed
global
tropospheric
chemistry
and
aerosol
model
that
predicts
concentrations
of oxidants
as well as aerosols
and
aerosol
precursors,
coupled
to a general
circulation
model
that
predicts
cloud
water
and
cloud
ice mass
and
cloud
droplet
and
ice crystal
number
concentrations
[Ghan et al., 1997a,b].
Both number and mass of several externally mixed lognormal aerosol size modes are predicted, with internal mixing assumed for the different aerosol components within eachmode. Predicted
aerosol
species
include
sulfate,
organic
and
black carbon, nitrate, soil dust, and sea salt. The climatemodel
uses
physically
based
treatments
of aerosol
radiative
properties
(including
dependence
on relative
humidity)
and
aerosol activation as cloud condensation nuclei. Moredetailed
descriptions
of the chemistry
and
aerosol
treatment
in
MIRAGE are presented
by R. C. Easter
et al. (manuscript
in
preparation,
2000) (hereinafter
referred
to as E2000). Ghan
et al. [this issue (a)] describe the treatment of water uptake and aerosol radiative properties. The treatments of cloud-aerosol interactions and cloud radiative properties in MIRAGE are described in section 3 of this paper.
Before models can be used to estimate the anthropogenic
aerosol
radiative
forcing,
they must
be thoroughly
evaluated.
E2000 evaluate the simulation of the concentrations of the
aerosols
and their precursor
gases
by MIRAGE. Ghan et al.
[this issue
(a)] evaluate
the simulation
of the aerosol
direct
forcing. In this paper
we evaluate
the simulation
of the
aerosol indirect forcing by MIRAGE. Ghan et al. [this issue(b)] apply
MIRAGE to estimate
the direct
and
indirect
forcing
by anthropogenic sulfate particles.2. Evaluation Strategy
Evaluation of the simulated aerosol indirect forcing
requires
measurements
of a variety
of fields
related
to aerosol
indirect forcing. Our evaluation strategy is to employ a suite of complementary and redundant measurements to evaluate the aerosol indirect forcing simulated by MIRAGE. E2000 evaluate the aerosol concentration simulated by MIRAGE.
We therefore begin our evaluation by examining the cloud
condensation nuclei (CCN) concentrations simulated by MIRAGE. We then proceed on to the relationship between
droplet and aerosol number concentrations, the droplet
number concentration, the cloud liquid water path, the cloud droplet effective radius, the cloud optical depth, and finally the cloud radiative forcing. It should be noted that although none of the fields is a measure of the aerosol indirect forcing, successful simulation of all of the fields would greatly increase confidence in estimates of aerosol indirect forcing by
the same model.
The evaluation focuses on the 12-month period June 1994 to May 1995 simulated by MIRAGE. Nudging toward European Center for Medium-Range Weather Forecasting (ECMWF) analyzed winds, temperature, and sea surface temperature is applied to reduce the influence of natural variability on the interpretation of the results [Feichter and Lohmann, 1999]. The simulation was performed at a
horizontal
resolution
of T42 (about
2.8
ø latitude
and longi-
tude) with 24 levels, about half in the boundary layer. Measurements for the same time period are used in the evaluations whenever possible, but measurements from other years had to be used in some cases. Nudging reduces the need for multiyear simulations because the simulated circulation systems are constrained to follow those observed.3. Evaluation
3.1. Cloud Condensation Nuclei Concentration
The first step in the connection between aerosols and
indirect forcing is the Cloud Condensation Nuclei (CCN)
concentration. If a model fails to simulate a realistic distribu-
tion of CCN as a function of supersaturation, then one cannot
expect it to correctly simulate the cloud droplet number con-
centration. To evaluate the simulated CCN spectra, we have
compiled a climatology of CCN spectra measured by the Desert Research Institute CCN spectrometer [Hudson, 1989]
at various field experiments. Table 1 lists the approximate latitude, longitude, and dates of each of the field experiments.
Additional information about the CCN measurements is
described by Hudson and Li [1995], Hudson et al. [1999], Hudson and Xie [ 1999], Hudson and Yurn [ 1999], and Yurn and Hudson [2000]. The measurements have been averaged over all samples within each 100 hPa layer that measurements were available. To compare with the measurements, we have selected the MIRAGE grid cell and simulated month closest
Table 1. Field Experiments Whose CCN Measurements Were Used for Model
Evaluation
Experiment Latitude Longitude Region Period
FIRE '• I 33 238 California coast June-July 1987
ASTEX b 38 332 Azores June 1992
SOCEX c 1 -42 142 Tasmania July 1993
SOCEX 2 -42 142 Tasmania Jan.-Feb. 1995
SCMS d 30 280 Florida July-Aug. 1995
ACE ½ 1 -45 145 Tasmania Nov.-Dec. 1995
ARM •' IOP 38 262 Oklahoma Sept.-Oct. 1997.
FIRE 3 72 210 Arctic Ocean May 1998
'•FIRE, First International Satellite Cloud Climatology Project Regional Experiment.
bASTEX, Atlantic Stratocumulus Transition Experiment.
cSOCEX, Southern Ocean Cloud Experiment.
dSCMS, Small Cumulus Microphysics Study.
½ACE, Aerosol Characterization Experiment.
GHAN ET AL.: EVALUATION OF AEROSOL INDIRECT RADIATIVE FORCING 5319 lOOO lOO lO lOOO lOO lO lOOO lOO lO lOOO lOO
tE
• 10 z 1 0.01 SOCEX- 1--
.... Observed
r1
I I I I IIIII
O.Ol o.1 FIRE-$-
- - - Observed..
=:::•
1
I I I I IH•ill
I I I I I III
0.01 0.1 1 ASTEX_== I idIRAIGi•
IIII I
--I--
-- •- ---I
-- I'-
!-l -r•
-
0.01 0.1 1 ACE-1_== I idlRAIGi•
l lll I
Observed -- --- • i i_• - •.'• I I I•111 i I I I lilT 0.1 Supersafurafion (%) SOCEX- 21000
___-
0.01 0,1 1 SCMS10000
--- Observed -1000
100 ____=-
--'
'"
10 •l•R--•'
I I I III I ! I I I III
O.Ol o,1 1 FIRE-11000
__= I MIRAIG•
=
o
- - -
100
==-
1
I..'1 I I I IIII
I I I I I III
0.01 0.1 1 ARM
10000
=== I idIRA•G•
Observed
_;___
1000
__=-
=
:____=-
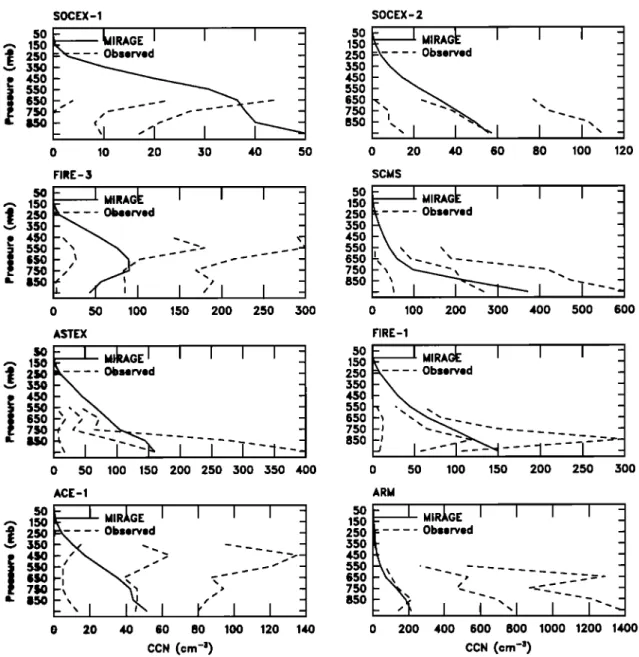
_- lO O,Ol o,1 1 $upersafurafion (%)Figure
1. Cloud
Condensation
Nuclei
(CCN)
concentration
as a function
of supersaturation,
averaged
over
all measurements
at pressures
between
800 and 900 hPa during
each
of eight
field experiments
(dashed
line) and averaged
over the closest
month
and grid cell for the same
pressure
interval
in the Model
for
Integrated
Research
ou Atmospheric
Global
Exchange
(MlRAGE) simulation
(solid
line). The additional
dashed lines indicate the 10th and 90th percentiles of the measurements.to that of each field experiment. The simulated CCN concen- tration at supersaturations of 0.02, 0.05, 0.1, 0.2, 0.5, and 1%
is calculated
each time step using
the K/3hler
equilibrium
theory
applied
to the aerosol
size
distribution
and
composition
simulated
by MIRAGE for each
of the four lognormal
aerosol
modes
treated
in MlRAGE. Note that CCN with S = 0.02,
0.05, 0.1, 0.2, and 0.5% correspond
to sea-salt
particles
with
dry diameters
of 0.33, 0.18, 0.11, 0.072, and 0.039 I.tm,
or
ammonium
sulfate
particles
with dry diameters
of 0.39, 0.21,
0.13, 0.084, and 0.046 I.tm.Figure
I compares
simulated
and observed
CCN spectra
averaged over pressures between 800 and 900 hPa for allmeasurements
at each experiment
location. Although
the
simulated
CCN concentrations
at supersaturations
S of 0.1-1%
are quite
close
to those
observed
for all but one experiment
(Southern
Ocean
Cloud Experiment
(SOCEX) 1, in which
MlRAGE overestimates the CCN concentration by a factor of 5-10), MlRAGE consistently simulates significantly fewer CCN at S=0.02%. This suggests that either MlRAGE simu- lates too few coarse particles or the CCN spectrometer over-
estimates the CCN concentration for S=0.02%. MlRAGE
neglects many potential sources of coarse mode particles,
such as bacteria [Matthias-Maser and Jaenicke, 1994;
Lighthart and Shaffer, 1994], pollen, fungal spores, viruses,
and algae. However, the number concentrations for such coarse mode particles are generally much lower than the
measured CCN concentrations at S=0.02%, so it is unlikely
that these
missing
sources
can account
for the discrepancy.
Alternatively, the simulated CCN concentration at S=0.02%
could also be increased by prescribing broader aerosol size
distributions for the accumulation mode in MIRAGE, which
5320 GHAN ET AL.' EVALUATION OF AEROSOL INDIRECT RADIATIVE FORCING SOCEX-1
so
I[
lu•.^•œ
I
I
I
-
,-, 150'• 250 - - -
-
I 450
550 650 0 10 20 30 40 50 FIRE:-3250 ed
350 450•
..'..'..-..
75O 0 • •00 •so 200 2s0 ASTEXso
[: 1 lili•AGE:I
I
I
I
55O $5O 500 0 50 100 150 200 250 $00 550 400 ACE- 1 so I I I I - --• 150 -'• 250
-
,..., 550 .... - 550 .---" 6N) - 71.0 - --ß
- •5o
I
I -
80 100 SOCE:X- 250 •
I MIRAG• I
I
I
-
150 - 250 ... 550 - 450 - 550 - 650 - -85o
I
I
I" -
0 20 40 60 80 100 120 SCMS50 -
I MiRAG
•
I
I
I
-
150 - -250
_•---
Observed -
550 - 450 - -550 • %.,,_
650 - ...•...••
...
-
750
•
-•..
-_
850_ , I
I '--"r"'• I
I---
0 100 200 .300 400 500 600 FIRE-150
•
I MIRA& I
I
I
150250
-•O:s.rved -
550 45O 550"øf!
',
750 850 _- _- _- -- -- -'- 0 50 100 150 200 250 $00 ARM:
I MiR,[.GE:
I
I
I
I
:
--- Observed - 50 150 250 550 450 550 650 750 850 0 20 40 60 120 140 0 CCN(•m-') ccN (=m-')I
I •1
I
I
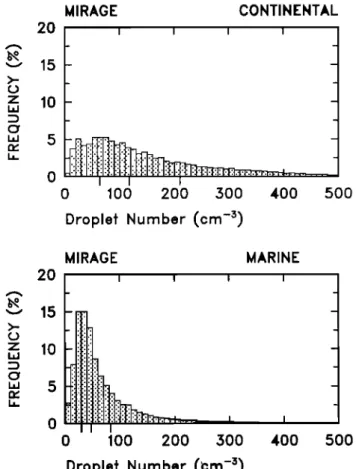
200 400 600 800 1000 1200 1400Figure 2. Time mean vertical profiles of the CCN concentration at a supersaturation of 0.1%, as measured
during
each
field experiment
(dashed
line) and as simulated
by MIRAGE during
the same
time of year
and
at the closest
grid cell. The additional
dashed
lines indicate
the 10th and 90th percentiles
of the
measurements.
sapersaturations. However, the width of the aerosol size dis- tributicm required for consistency with the CCN spectra is
inconsistent with measured aerosol size distributions.
On the other hand, Wood et al. [2000] have found a similar
difference in the slopes of the CCN spectra as measured dur- 'rag the second Aerosol Characterization Experiment and as estimated from K6hler theory using the measured aerosol size distribution. This suggests that the difference between the MIRAGE simulation and the measurements at S=0.02% may not be due to missing 0.4 !xm diameter particles in MIRAGE. Recent comparisons between CCN spectrometer measure-
ments have indicated that the CCN measurements at low con-
centrations (such as at a supersaturation of 0.02%) can
overestimate the CCN concentration by perhaps a factor of 2.
After the CCN data (shown in Figure 1) were analyzed, it came to oar attention, mainly from analysis of comparisons with other CCN counters at a workshop in 1997 [J. Snider
etal., manuscript in preparation, 2000], that the Desert Research Institute (DRI) CCN spectrometer data needs to be
corrected. This correction is needed because of the inherent
spreading of signals within the instrument, which causes channels (corresponding to derived critical supersaturations) that should have high counts to be underestimated and
channels that should have low counts to be overestimated. This does not alter the total concentrations of CCN but
usually causes an overestimate of concentrations at low S. This can be corrected by "inverting" the data according to the method used by Wendisch et al. [1996] using the iterative solution of Twomey [1975] as modified by Markowski [1987]. So far, these corrections indicate only small changes for S >
0.1% and 10 to 100% overestimates at lower S. This accounts
for at least some of the disagreement between simulations and observations at low S. The problem is especially acute for the ARM data since this is the only set of data acquired with the
GHAN ET AL.: EVALUATION OF AEROSOL INDIRECT RADIATIVE FORCING 5321
newer DRI CCN spectrometer, which has less resolution than
the older
one and will require
more
severe
inversion
20
corrections. This is probably why there are greaterdifferences between simulations and observations at low S for
ARM.
"•
15
Figure 2 compares vertical profiles of simulated and
observed
CCN concentration
at S=0.1%
for each
experiment. z
10
The measurements show a variety of vertical profiles:decreasing with height (ARM, ASTEX, SCMS, SOCEX 2), La 5 decreasing with height but depleted in the boundary layer
(FIRE
1),
nearly
constant
with
height
(ACE
1), and
increasing
0
with height (FIRE 3 and SOCEX 2). The simulated profilestend to decrease with height, except for the FIRE-3 case (Arctic Ocean) where the simulated profile increases with height between 950 and 750 hPa, in agreement with the
observations. The agreement between simulated and ob-
served
profiles
is within
the
range
of variability
in the
obser-
90
vations for all locations except the ARM IOP site, whereMIRAGE underestimates the CCN concentration by a factor
--• •5 of 3-4, and SOCEX 1, where MIRAGE overestimates the
CCN concentration in the planetary boundary layer by a
•' ]0
factor
of 3-4. The ARM site is located
in a concentration ha
gradient region in the central United States (lower concen-
trations to the west, higher concentrations to the east), and ha ,5 concentrations during a specific observational period would
be expected
to be sensitive
to actual
airflow
patterns.
The
0
overprediction at SOCEX 1 is consistent with the excessiveMethane Sulfonic Acid (MSA) and sulfate simulated at Cape Grim, Tasmania [E2000]. The excessive MSA may be due to
excessive Dimethyl Sulfide (DMS) emissions in the Southern
Ocean. However, E2000 conclude that the widespread exces-
sive sulfate simulated by MIRAGE is due to inefficient wet removal that happens in winter with such clean air and abundant drizzle [e.g., Boers et al., 1996, 1998].
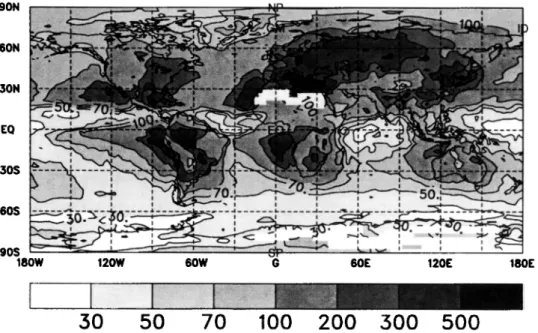
MIRAGE CONTINENTAL i I i I - 0 100 200 300 400 500
Droplet Number (cm -•)
MIRAGEt I
I
I
_ I ii i 0 100 200 300Droplet Number (C:m
-3)
MARINE I 400 500Figure 3. Spatial frequency distribution of the cloud water- weighted annual mean in-cloud droplet number concentration simulated by MIRAGE for continental (top) and marine (bottom) grid points. The three marks along each horizontal axis show the 25th, 50th, and 75th percentiles.
3.2. Cloud Droplet Number Concentration
The prediction of droplet number is perhaps the most important !ink in estimates of indirect radiative forcing. Given the CCN spectrum and the spectrum of updraft velocities, MIRAGE calculates the droplet nucleation rate and applies it to the droplet balance equation to predict the droplet
number concentration [Ghan et al., 1997b]. Aerosol activa-
tion/droplet nucleation is parameterized using the multimode version [Abdul-Razzak and Ghan, 2000] of the single-mode
parameterization developed by Abdul-Razzak etal. [1998]. The activation parameterization determines the mass and
number fraction activated for each mode, which is then used
to determine the droplet nucleation rate for the CCM and the
aerosol mass and number nucleation rate for treating nuclea-
tion scavenging of the aerosol. The activation rate for a new
cloud is given by the number activated in each new cloudy layer, divided by the time step. Activation for an old cloud is assumed to occur only at cloud base, where it is expressed in terms of a flux of nucleated droplets into the lowest layer of the cloud; the activation rate is then given by the flux
convergence in the lowest layer in a manner consistent with
the treatment of turbulent transport of droplets [Ghan et al.,
1997b]. In contrast
to other
mechanistic
treatments
of droplet
number [Chuang et al., 1997; Lohmann et al., 1999], no lower
bound is placed on the simulated droplet number or aerosol
number.
However,
a lower
bound
(0.04
m
2 s
'2)
on the
subgrid
variance of vertical velocity is applied because the vertical
resolution of MIRAGE is insufficient to resolve the cloud-top radiative cooling that drives turbulence in bouadary layer clouds. The subgrid variance of vertical velocity is otherwise
determined from the Yamada and Melior [1979] second-order turbulence closure (level 2.5) model.
Droplet loss by collision/coalescence is expressed in terms of droplet number and cloud water using the Ziegler [198:5] parameterization. Droplet loss by collection is treated by assuming collection of cloud water by rain, snow, and ice reduce droplet number and cloud water but not the average size of the cloud droplets. The treatment of droplet loss by mixing/evaporation is described by Ghan et al. [ 1997b].
Figure 3 shows the spatial frequency distribution of the
annual mean in-cloud droplet number concentration simalatM
for continental and marine grid points. Consistent with in situ measurements [Squires, 1958; King et al., 199:5], droplet number concentrations are typically hig[w.r in continental air than in marine air. The median simulated droplet numher
concentration for marine and continental air is 47 and
117
cm
'3, respectively.
These
concentrations
are lower
thaa
most in situ measurements. For exan•le, the median dropletnumber concentration for clean marine and continental air
during the Atlantic Stratocumulus
Transition
Experiment
(ASTEX) was estimated by King et al. [1995] to be 148 and393
cm
'3,
respectively.
5322 GHAN ET AL.: EVALUATION OF AEROSOL INDIRECT RADIATWE FORCING
[z 10
ß :o.-'• o10-'
10 o
10
Sulfcte (10-g
rn
Figure 4. Simulated
annual
mean
in-cloud
droplet
number
concentration
for all grid points
plotted
against
the simulated
annual
mean
sulfate
mass
concentration.
The solid line shows
empirical
relationship
D of
Boucher and Lohmann [1995].
et al., 1994; Boucher and Lohmann, 1995; Jones and Slingo,
1996; Feichter et al., 1997; Lohmann and Feichter, 1997;
Rotstayn, 1999; Kiehl et al., 2000] have used empirical relationships between droplet number and either sulfate mass or aerosol number (determined from suifate mass by assuming a prescribed aerosol size distribution). Figure 4 shows the relationship between droplet number concentration and sulfate mass concentration simulated by MIRAGE. The relationship is in excellent agreement with the empirical relationship D of Boucher and Lohmann [1995], with droplet number concen-
trations
increasing
from 10 to 30 cm
-3 for sulfate
mass
concentrations
of 0.3 Ixg
m
-3 to 200-500
cm
'3 for sulfate
mass
concentrations
of 10 Ixg
m
-3. As in the measurements,
sulfate
mass concentration only explains a fraction of the variability in droplet number, which depends also on the aerosol size distribution, the turbulence kinetic energy both at cloud base and at cloud top, and the mass concentrations of other components of the CCN. Interestingly, the droplet numberand sulfate mass concentrations cluster around two modes
(20-50 droplets
cm
-3, 0.4-0.6 Ixg m
-3 sulfate,
and 60-150
droplets
cm
'3, 1.5-3
Ixg
m
-3 sulfate).
This
bimodality
is sug-
gestive of Baker and Charlson's [ 1990] multiple equilibrium hypothesis (clean-precipitating cloud and dirty-nonprecipi- tating cloud). A more likely explanation is the very different sulfur emissions in industrial and remote regions.Another test of the prediction of droplet number in MIRAGE is to compare the ratio of droplet number to aerosol number (interstitial plus activated) with in situ measurements. This provides a test of the treatment of cloud-aerosol
interactions, which is less sensitive to the aerosol simulation
than the droplet number concentration itself. Figure 5 plots
the ratio versus the aerosol number to show how the ratio
depends on the aerosol number. Comparable measurements
are available in the work of Gillani et al. [1995]. Both the
measurements and the simulation indicate that the ratio
decreases with increasing aerosol number, reflecting the increasing competition for water (and hence lower maximum supersaturations) at higher aerosol concentrations. However,
0.8
0.6
0.4
0.2
0.0
ALL LIQUID WATER CLOUDS
1.0
200 400 600
Aerosol Number (cm -3)
800 lOOO
Figure 5. MIRAGE simulation of the ratio of droplet number to aerosol number (interstitial plus activated) plotted versus aerosol number for all grid cells.
GHAN ET AL.: EVALUATION OF AEROSOL INDIRECT RADIATIVE FORCLNG 5323 •*;.;** '-•'-:-:-::-:• ... ½- '.'.-;•:*.•}'-:/•;•Y-..'-:,' './% • .•. ,• •- , ~ "•!J!11111111•••_...-.••-•-•.:;... •*:-'.'•2q •. ;::::'•' . •:.'.:!* ... • :::.::::-:;--;- . ... ;'•:--::=,½•.:.:•::. :•?'•-7---:"-:- •.c;... ... :.?.-?,.::..:.,•,;,.• •::,, ,..:•$ .:::•:•?,;-•.•;•:•[. Jl ... "•'---::-:-;'/" :-'-::::;:: .... --.'-'::-:' ": '"':•:'::•:':" '•_•ii•"'"':: ... :-.-" "•"••:..•":'.'•::-:"---.:--*'••.:..'"•- •;•-, ""•' "-"•,; ... •..' .-.'.' ... -*,-4, ... -::' ':..'":':'::-,•;*:•:•"::,.;.•-.---,..,.;-:'*;;-:,::;:,-•...:.,-:c. ' 60N ... :•:=•...:..•,, • ..;::,-,.-:.:.-'-';....-.,.=:-':7,;+.:; ,':;.=.;.,:-.:....,. ... ß .:'..:.- ;:--:.'::-..:.:: :-. -,'--. ,:., '•' * .:';:....:.;, .,•-:'?--',:::-:'-.:;-:,.; .;:;:.' :.-.-** **a-: -• .%,.;•, ..---•.,: .;,;:.::,.•::-,..-:,:,...:: ... ..::.--•.-..:.>. r...:,,:. .. ,,,.... ,:...**:**-•*---'-'•:,• ... -::----. ,..**..-'.-s'-,,.•:;• .... :-:.- -, .-': ... :'-'--"'...:'•.:0'.-,:--,-:". .:**:::-•, ... ***;***:-. ... -:-;;-*:•i :,•;.. ... '--...:-:,-,-:,..: ... :-....:-**., /'"'•':• ... ,:-. .... :-:-. ... :•,.:.-.-..-,:::.½.:**• ... :½'* ,½?r-- .,.'•:-:-::f• • ....*..,..:,...****..-. .... *. •../•;. •.. .... -:..,--'-.'•..=..'...½.'-;•:-.::,•-..:-.. •. / .*.-..,., •*.. •}.,:•..-:, - -, , -..: ..a.?E::Sa•i:i,.!,:-: ... :c•:,.• •.-,.'.: .... ,,.•...• '. . • ... :*.;•...'.:•i•;>•....,,-..•.,%•.:-.: :, •.- ..,.., r.½... '"':"" ' i ,•f- - ' '. :. "• ß -"' ',,•,,,7,* - -'"' ,
...
i.*,=
•'""':
'.,•;i•...."•*
' *'•':'"'::"
""*'
...
-:r.•.,
...
.,:*--:.'-'.-'
- ."
.•-,:':,'
,-
-.
. ' ...
'•,:'..;•,.
'•...-•
-:,
' -
...
.,. ---..:.-::.:::-
...
... ,. ß :..
,...:
....
...
...
:,-,.-
...
...
...
..,.,
---:-.:::::.-
.:
.... :
...
-,
.... -.:
...
...
.:..,
...
.,,
...
..
.
, ':-,'
',: ... ",:...;-..i:.'--..
' ...
::',<•
',',::::;,..:
'.,,:
":.<."*
-c/.--?-:.
'"-:,---"
.•!;'
.::."
...:"
:---"
:...:,:
•,...'"'•,
"-";'•'
:.::
.. •;•..•
'" •.,•:--•.,:':.:---.x•;!:::**..•:.-*."-;;,;;
...
:.... •. .-.--:-::::-...:..:... ,,:•.. s.:.-•}•,./- . . . ..• ... . -' :.. ,.---%,.. .'--,,;,, .',-,:-:;:. :: : .:.%... .•. :...:..-. ½.-- : :,..,...--":-:-::::':;;..,,.,::.:•,..-.i..:..'.'•. *¾.:,':,•:-?-':.•;•., . **.:..::-'"' '. ... "-:'-c. i '*':: ' ... '-;;*-'--'•*•:**' ;**. ' '..•, ß - ,...::.•;- .... ' ... •--%':*.- ".':-:<-•i;:: .... ..:-•':•;,.,.,. - .'L:;:,. ... --.."***½,.'.-:-½•-:.-/.:-,.'4,,:-•-a: ':i:!!,:.: :"'}'*•'.:,•;' -..'r,::.•, ... ½:•.• ß ß .•-,..;•:,:....-,:.c•--,--,'.---'-,--- ½;....*,•... -•--. -.,•.,
,...** . ß .;,..,. ':':/-½'.;.. F.: s.:, .'-,:, .; ...
•.; 1½;7%41,:::." '•: ' ... :;:::?;•::ii, i?::'"' •:'•:::'"'..?.•R•:.-;*.• .... ".;:::½' -•iii;;!::i•:i:::.; '"••'•'•""'x•::t; ';'*-'*::*';;'*'-::t:•!i**:*:*';*::-•!!:;'J• i *:½'-"*-:.---*-'•;:;*•' .:::.-;•:;'*"½"•i?.-.-"•::.•""'"•""-"**--.--"•!;...;• ;' .7::•a:...-•;½.?: :;.; •l. •.'.'""':"' '" "•.'-.•!;!'•'•½•i.!;.i!:'::; .... ':•. '• .... •1,'.:;=:.*..,.'-'•.':;.-.?-'-½. ,• •. • -':'*•' :';•:-"f•--::'•-. ... *::-:<=7"' ':::'":"::':::'::'".:::•:"-4;: •-:..""
."- ... ' ... . ... i: ..• .• ...•--..,,,•-. -..:.... -".. •'•"•' t[ • t• '• i . "•.•:1 ... ... ,...-.:-?:'-.-..-.::. '
60S : ... "• ... • ... • ... '• ... •- ... 4 ... -...-.,,. ... ,- ---..--.• ....
' -.• - '"' • -• • ....
•3,0. <:•P:.,_...• , -• '"• . "-'. ,.,_. • --..' '"'==:
180W 120W 60W 0 60E 120E 180E
30
50
70
100
200
300
500
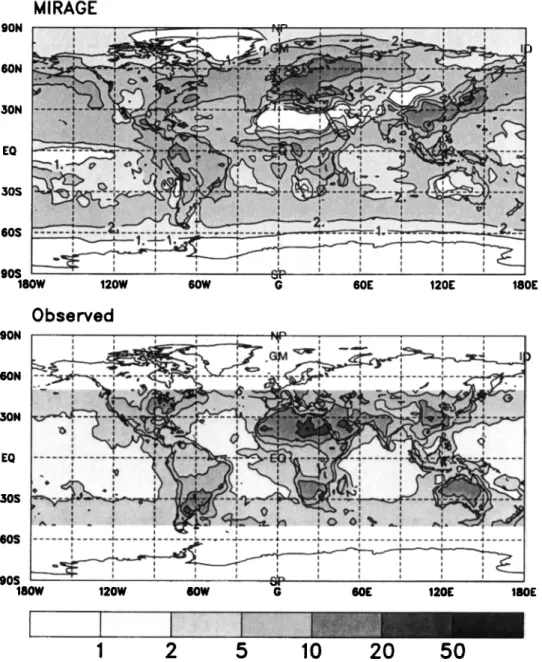
Figure
6. Cloud-water-weighted
vertical
and
annual
mean
in-cloud
droplet
number
concentration
(cm
-3)
simulated by MIRAGE.the ratio simulated by MIRAGE is significantly smaller than
the measured ratio (the fact that the measurements do not
sample particles smaller than radius 0.085 lam has been accounted for by subtracting the number smaller than the cutoff size from the simulated aerosol number). This bias
suggests that either activation is underestimated in MIRAGE
or the droplet sinks due to mixing/evaporation, colli- sion/coalescence of droplets, and collection by precipitating
hydrometeors are overestimated.
The treatment
of activation
has
been
evaluated
by Gultepe
et al. [1996] and Lin and Leaitch [1997]. Although Gultepe etal. found good agreement between the parameterized number activated and the observed droplet number if the measured standard deviation of vertical velocity is used in theactivation parameterization, Lin and Leaitch found that the
parameterized activation underestimates the droplet number if the parameterization is applied in the same way as in
MIRAGE, i.e., by integrating
over the subgrid
frequency
distribution of vertical velocity. The bias is larger than the difference between the parameterized activation and thatcalculated by a detailed model [Abdul-Razzak and Ghan,
2000], suggesting
that the problem
is not with the parame-
terization itself but with the treatment of subgrid variability.The horizontal distribution of the cloud water-weighted vertical and annual mean in-cloud droplet number is illus- trated in Figure 6. Simulated droplet number concentrations are greatest near the regions with the largest emissions of primary particles and aerosol precursor gases and least in
regions far from the largest emissions and where aerosol
removal by precipitation is most frequent. Mean droplet con-
centrations
are 30-60 cm
-3 in the Aerosol
Characterization
Experiment (ACE 1) region south of Tasmania, smaller than
the measured
values
of 30-120
cm
-3 [Yurn
et al., 1998;
Boers
and Krurnmel, 1998]. The simulated droplet concentrations over the northeast United States and southeast Canada (200-300
cm
-3) are consistent
with measurements
there
[Leaitch
et al., 1992]. The simulated droplet concentrations in the
northwest
Atlantic
Ocean
(150-200
cm
-3)
are somewhat
lower
than in situ measurements during the North Atlantic Regional
Experiment [Leaitch et al., 1996]. The droplet number simu-
lated
near
the Azores
(200-400
cm
-3) is actually
somewhat
higher
than
values
of 50-300
cm
-3 measured
during
ASTEX
[King et al., 1995; Hudson and Li, 1995; Hudson and Yum, 1997].
Global information about droplet number concentration is
available from the Hah et al. [1998b] analysis of Advanced
Very High Resolution Radiometer (AVHRR) measurements
and International Satellite Cloud Climatology Project
(ISCCP) for the year 1987. Figure 7 compares the annual means of the simulated and observed column droplet number concentrations. Although interpretation of the column droplet number in terms of droplet number concentration is complicated by variations in cloud depth, several conclusions can be drawn from Figure 7. First, MIRAGE correctly simu- lates higher column droplet number concentrations in the industrial regions of the United States, Europe, and East Asia compared to over the oceans. Second, over the major deserts (Sahara, Gobi, and Australia) the column droplet number simulated by MIRAGE is an order of magnitude less than that estimated from satellite measurements, but as noted by the Hah et al. [1998b] satellite analysis over the deserts is probably detecting dust rather than cloud droplets. These conclusions are further supported by an examination of the zonal mean column droplet number (Figure 8), which indi- cates good agreement between the MIRAGE simulation and the observations except at the latitudes of the deserts, where the observed column droplet number is larger.
3.3. Cloud Liquid Water Path
One of the key fields that determine the cloud albedo and the planetary radiation balance is the cloud liquid water path, also known as column cloud water. MIRAGE predicts strati- form cloud liquid water content using Ghan and Easter's [1992] simplification of the Colorado State University
5324 GHAN ET AL.: EVALUATION OF AEROSOL INDIRECT RADIATIVE FORCING 90N 60N 5ON EQ 50S 60S 90S 18t MIRAGE .•: ,:::.x:::*::x:•-•::.•.. :.:,.:..:::•:::•::x'-::::. •: :•-.:•,:. "•-'••• ... i .... "_._L..'-" • ' 'Y ... •'••-•:•'-•':-•:•'-:.-::--:.• ... ' ... • ... '...::•::-..' ... • ' :.. 8:.•':.-:"•'...• ...::..:' '...:.:..; • . ....• ... - ... ....: .. . •••• ... x""•'••"• ... 'a•a•'•i? ... :• •'i ... ...•?•27•--•]• - • .- .... :.::: ... .'.• .... :•:a•z•jj• • ... ...:.:•. -::-:--..:•a• ... --• - :..• -.i:':::'" : ... :..-•:'". ... • ...:....• ... • •••:'u•J?•a•'• .... :. .... .:• :-. _. ..•::.. :•:-.•- .•..• •-• -.. :• .-• -:•: ... • .•.::..•..:• •. • • •---- -••••• . - •=.,:.:,,,:. ... •..._•. , , .t .... '•1•.• .... -• •'•':"' .... , ....• • • • . - .•.-•' . •: • . . :- .... i .. . :. .. • -- . tW 120W 60W G 60[ 120E 18l Observed 180E
1
2
5
10
20
50
Figure
7. Annual
mean
column
droplet
number
concentration
(10
6 cm
-•) simulated
by MIRAGE
and
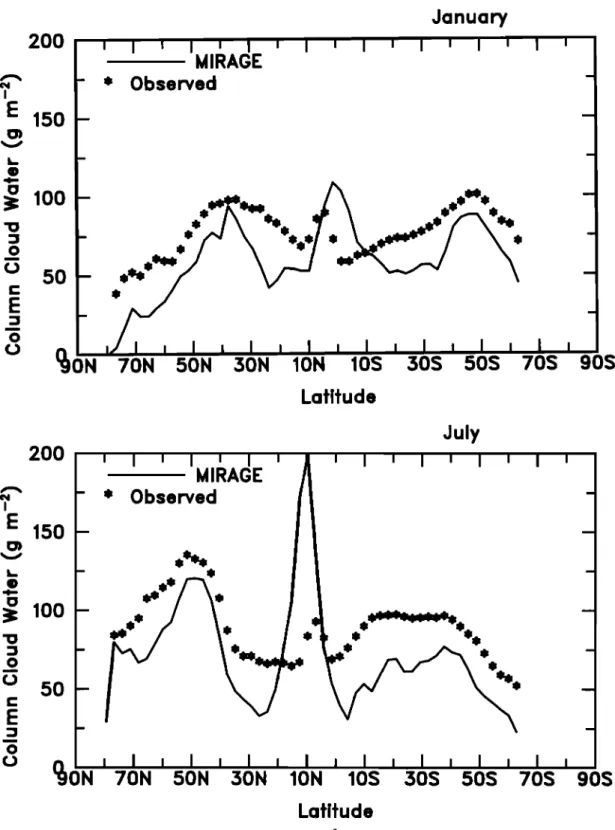
estimated from satellite measurements by the Han et al. [ 1998b].bulk cloud microphysics [Tripoli and Cotton, 1980; Cotton et al., 1986]. Subgrid variability in cloud liquid water is pres- ently neglected. Convective cloud liquid water is also neglected. Figure 9 compares the monthly and ocean mean column cloud water simulated by MIRAGE with an estimate from multiyear Special Sensor Microwave/Imager measure- ments [Greenwald et al., 1995] for January and July. SSM/I measurements of column cloud water are not possible over land. Although the simulated column cloud water agrees with
the measurements to within 30% in the midlatitude storm
tracks, MIRAGE overestimates the column cloud water by a
factor of 2 in most of the Intertropical Convergence Zone
(ITCZ) and underestimates it by a factor of 2-3 in most of the subtropics. The positive bias in the ITCZ may be due to the limitations of the SSM/I analysis in precipitating clouds, but it
should be noted that the simulated ITCZ is much weaker
without nudging toward analyzed winds. The negative bias in
the subtropics is probably due to deficiencies in the shallow- convection parameterization in MIRAGE.
3.4. Cloud Droplet Effective Radius
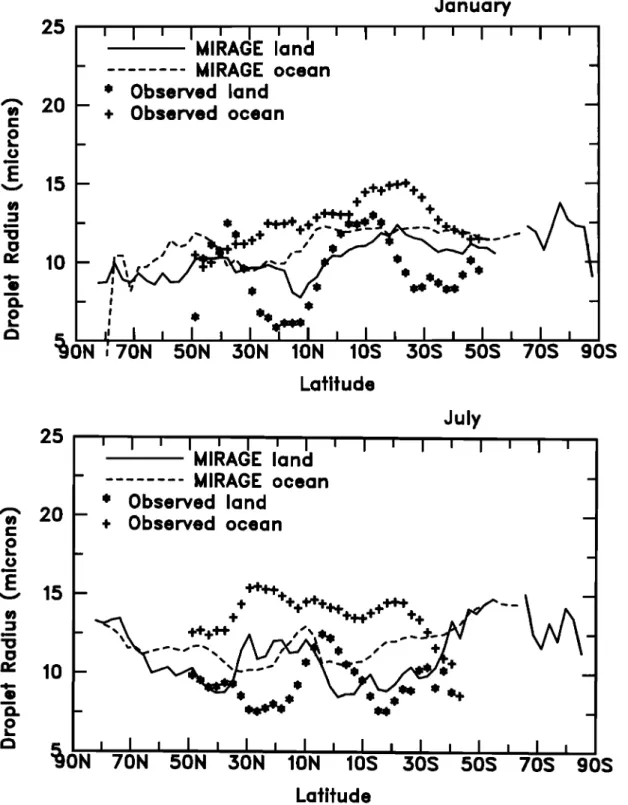
Another key field that determines cloud albedo is the cloud droplet effective radius, which in MIRAGE is expressed in terms of droplet number and liquid water content [Ghan et al.,
1997a]. Two different estimates are available from measure-
ments. Figure 10 compares the zonal land and ocean mean effective radius simulated by MIRAGE for January 1995 and July 1994 with that estimated from International Satellite Cloud Climatology Project (ISCCP) data by Han et al. [ 1994] for January and July 1987. The simulated values represent cloud-water-weighted means over the depth of the ,cloud,
which according to in situ measurements [Nichols, 1984] might be systematically smaller than the value near cloud top, which is estimated from the satellite retrieval algorithm
GHAN ET AL.: EVALUATION OF AEROSOL INDIRECT RADIATIVE FORCING 5325 lO 8 6 4 2 I I I I I MIRAGE Observed I I I I I I I I I I
N
70N
50N
50N
1ON
10S
50S
50S
70S
90S
LafifudeFigure $. As in Figure 7 but for zonal means.
[Nakajima et al., 1991]. MIRAGE correctly simulates
smaller droplets over the continents than over the oceans but underestimates the droplet radius by 1-3 !.tm over most of the oceans. This bias may be due to the difference between the
droplet size measured at cloud top and the cloud-water-
weighted mean droplet size diagnosed from the MIRAGE
simulation. In both the MIRAGE simulation and the observa-
tions the droplet radius tends to be somewhat smaller in the more polluted Northern Hemisphere. However, the observa-
tions are limited to latitudes 50øS to 50øN, so conclusions
cannot be drawn for the polar latitudes.
An alternate analysis of cloud droplet radius is based on the analysis of Polarization and Directionality of the Earth's Reflectances (POLDER) polarimeter measurements [Br•on and Goloub, 1998]. In addition to its multispectral and multi- directional capabilities, POLDER provided measurements of the linear polarization of the reflected light. The analysis of POLDER measurements revealed unexpected polarization
features over some cloud fields [Br•on and Goloub, 1998]: minima and maxima of the polarization as a function of the scattering angle within the range 145 ø-170 ø. Such features
result from a narrow droplet size distribution, for liquid clouds, which yield an oscillating polarized phase function in this scattering angle range. Br6on and Goloub developed an inversion method based on these findings. The inversion
compares the measured polarization to a number of cloud droplet distributions with different effective radii. The
method has several limitations: it may retrieve a valid radius only if (1) the cloud field is homogeneous over a distance of roughly 150 km, (2) some specific viewing geometry condi- tions are met, and (3) the droplet size distribution is relatively
narrow. On the other hand, if such conditions are met, the
method is highly accurate and reliable. Because the polariza- tion is most sensitive to single scattering, the retrieved radii are representative of the cloud top, i.e., an optical depth of
roughly 1.
Given the special conditions required for the POLDER droplet radius analysis, full global coverage is only possible for averages over multiple months. Figure 11 compares the zonal !and and ocean mean cloud droplet radius simulated by MIRAGE for June 1994 to May 1995 with that estimated
from POLDER measurements for November 1996 to June
1997. Again, the !and-ocean contrast in droplet radius is clearly evident in both the simulation and the POLDER analy- sis. The smaller droplet sizes in Antarctica and in the eastern Pacific off the coast of Baja California are correctly simu- lated, but MIRAGE overestimates droplet size in many regions, particularly in the midlatitude storm track of the Southern Hemisphere. MIRAGE overestimates droplet size at almost all latitudes, with the largest errors near 70øS and over the subtropical continents. The global mean simulated effec- tive radius is 10.83 for land and 11.84 for ocean; the global
mean observed effective radius is 8.61 for land and 10.96 for
ocean. Given the tendency for droplet radius to be largest near cloud top, the droplet radius bias in the MIRAGE simulation cannot be explained by the fact that the POLDER
analysis is more characteristic of the droplet radius at cloud top, while the MIRAGE estimate is weighted by the cloud
water throughout the atmospheric column. However, the bias
is opposite to the bias evident in the comparison with the Han et al. [1994] analysis, indicating some uncertainty in the observations. Yet the simulations and both analyses are
consistent in their estimate of larger droplets over the oceans
than over land.
3.5. Cloud Optical Depth
The cloud
optical
depth
combines
the influence
of liquid
water path and effective radius. In MIRAGE the cloud
optical
depth
is related
to the effective
radii of droplets
and
ice crystals
and to the column
loading
of cloud
liquid water
and cloud
ice [Ghan
et al., 1997a]. Figure
12 compares
the
5326 GHAN ET AL.' EVALUATION OF AEROSOL INDIRECT RADIATIVE FORCING 200 150 - 100 - 50- I I I I I
MIRAGE
Observed
January
] I ] !•JON 70N 50N 3;ON 1ON 10S 50S 50S 70S
90SLatitude
200 150 lOO 50 MIRAGE ObservedJuly
, I [ I , I [ I ] I ] I [ I [ I70N
50N
3ON
1ON
10S
3OS
50S
70S
, I
90SLatitude
Figure
9. Ocean
zonal
mean
column
cloud
water
(g m
-2) simulated
by MIRAGE
and
estimated
from
Special Sensor Microwave/Imager measurements for January (top) and July (bottom).zonal mean cloud optical depth simulated by MIRAGE and estimated from satellite measurements by ISCCP [Rossow and Lacis, 1990] for January and July. MIRAGE over- estimates the monthly mean cloud optical depth in most regions except in West Africa in January and North America and central Asia in July. The simulated zonal mean cloud
optical depth is about double the observed optical depth at almost all latitudes. The ITCZ is clearly too strong in the
MIRAGE simulation, particularly in July. This bias is con-
sistent with the excessive cloud liquid water path in the ITCZ, but the excessive cloud optical depth in the subtropics is inconsistent with the underpredicted cloud liquid water path
there.
Further information about the relationship between cloud optical depth and cloud droplet effective radius is provided by
Han et al. [1998a], who used satellite measurements to
determine the temporal correlation between cloud albedo and droplet effective radius. They found that over the oceans the
GHAN ET AL.: EVALUATION
OF AEROSOL
INDIRECT
RADIATIVE FORCING
25
"' 20'• 15
=:
10
January
' I i' i I i I i I I IMIRAGE land
-
- ...
MIRAGE ocean
-
*
Observed
land
-
+ Observed
ocean
-
Laflfude
25
'•,
20
15
ac
10
July
MIRAGE land
-
- ...
MIRAGE ocean
*
Observed
land
+ Observed
ocean
,
I
,
I
I
I
I
I
I
I
,
I
,
I
,
I
•JON
70N 50N ;SON
1ON 10S 30S 50S 70S 90S
Lafifude
Figure
10. Land
and
ocean
zonal
mean
cloud
droplet
effective
radius
simulated
by MIRAGE
and
estimated
by
Han
½t
al. [1994]
from
International
Satellite
Cloud
Climatology
Project
(ISCCP)
data
for
January (top) and July (bottom).5327
correlation
is positive
for cloud
optical
depths
less
than
15 but
negative
for cloud
optical
depths
greater
than 15. Over land
they
found
a negative
correlation
for all cloud
optical
depths.
The zonal
land
and
ocean
means
of the temporal
correlation
between
cloud
optical
depth
(a surrogate
for cloud
albedo)
and droplet
effective
radius
as simulated
by MIRAGE are
illustrated
in Figure 13. Over the remote
oceans,
MIRAGE
successfully
simulates
a negative
correlation
for optical
depths
greater
than
15 and
a positive
correlation
for optical
depths
less
than 15. However,
MIRAGE fails to simulate
a
negative correlation over !and for thin or thick clouds.Although
the correlation
simulated
over land is less
than
that
over ocean for optically thin clouds (which is consistent withobservations),
it is much
greater
for optically
thick
clouds
(which
is inconsistent
with observations).
Lohmann
et al.
5328 GHAN ET AL.: EVALUATION OF AEROSOL INDIRECT RADIATIVE FORCING
20
18•
16
•,E•
14.
õ 12
lO
•.
8
'
I
I
I
I
I
I'
i
I
i
I
I
I
I
I
i
I
i
'
I I MIRAGE land - ... MIRAGE ocean -*
Observed
land
-
+ Observed
ocean
-
-.
,,,,
',,X,
... -,. _
\J
•j•N• I • I • I • I • I • I i I I I ,
70N
50N
5ON
1ON
10S
5OS
50S
70S
90S
Lafifude
Figure ]]. Land and ocean zonal mcan cloud droplet effective radius (microns) simulated M]•AGE for
June 1994 to May 1995 and estimated from POLDER measurements for November 1996 to June 1997.
of the ECHAM model that predicts droplet number in a manner very similar to MIRAGE. As MIRAGE, the ECHAM model successfully simulates a negative correlation over remote oceans for optical depths greater than 15 and a
positive
correlation
for optical
depths
less
than
15, and
fails
to
simulate a negative correlation over land for thin clouds.However, unlike MIRAGE, the ECHAM model successfully
simulates a negative correlation over !and for cloud optical depths exceeding 15. The agreement between MIRAGE and ECHAM is better than the agreement between MIRAGE and
the observations, which is to be expected because the parame- terizations used in MIRAGE and ECHAM are very similar.
3.6. Cloud Radiative Forcing
Although the time mean cloud optical depth simulated by MIRAGE appears to be far too high, the bias is not evident in
the time mean cloud radiative forcing. Figure 14 compares the zonal mean shortwave cloud forcing simulated by
MIRAGE and observed by ScaRaB [Kandel et al., 1998] for January 1995 and July 1994, respectively. The simulated
zonal
mean
shortwave
cloud
forcing
is within
25 W m
'2 of the
ScaRaB estimate at most latitudes, with excessively strong
forcing in the ITCZ (particularly in July) and in the subtropics of the Southern Hemisphere, and weak cloud forcing at latitudes 55øS-75øS in January. The cloud forcing simulated
in the ITCZ is not nearly so strong if the simulated winds are
not nudged toward the analyzed winds, indicating that the excessively strong bias in the ITCZ is probably due to differ-
ences in the deep convection parameterizations in MIRAGE and the ECMWF analysis model. The apparent inconsistency between the excessive cloud optical depth and the much more realistic cloud radiative forcing has been explained by Ghan etal. [1997a] in terms of the variability of cloud optical depth.
For completeness, Figure 15 compares the simulated and observed zonal mean longwave cloud forcing for January and July. MIRAGE simulates the gross features of the longwave
cloud forcing
quite well, including
the maxima
in the mid-
latitudes of each hemisphere and in the ITCZ and the minima in the subtropics and the polar regions. The zonal mean long-wave
cloud
forcing
is underestimated
by about
10
W m
-2
in
the ITCZ and overestimated in latitudes 50ø-90øN and 70 ø- 90øS.
The global means of the simulated and observed cloud radiative forcing are listed in Table 2. The agreement is to
within
2 W m
'• except
for the shortwave
cloud
forcing
in July,
when MIRAGE overestimates the shortwave cloud forcing by10 W m '•. The overestimate
in July is due to the excessively
strong ITCZ when MIRAGE is nudged by the ECMWF analyses; the shortwave cloud forcing in MIRAGE simu- lations without nudging is much closer to observations.4. Summary
Although measurements are not available to evaluate directly the estimate of aerosol indirect radiative forcing by integrated models such as MIRAGE, measurements of many
of the links between aerosols and radiative forcing are avail-
able. These links include the CCN concentration, the ratio of
droplet number to aerosol number, the droplet number con- centration, the column droplet number, the column cloud
water, the droplet effective radius, the cloud optical depth, the
correlation between cloud albedo and droplet effective radius,
and the cloud radiative forcing. In this paper we have com-
pared measurements of each of these fields with the simu- lation by MIRAGE.
The agreement between simulated and observed CCN con- centration is quite good at supersaturations between 0.1 and