HAL Id: inserm-03168758
https://www.hal.inserm.fr/inserm-03168758
Submitted on 14 Mar 2021
HAL is a multi-disciplinary open access
archive for the deposit and dissemination of sci-entific research documents, whether they are pub-lished or not. The documents may come from teaching and research institutions in France or
L’archive ouverte pluridisciplinaire HAL, est destinée au dépôt et à la diffusion de documents scientifiques de niveau recherche, publiés ou non, émanant des établissements d’enseignement et de recherche français ou étrangers, des laboratoires
Parents’ ratings of post-discharge healthcare for their
children born very preterm and their suggestions for
improvement: a European cohort study
Anna-Veera Seppanen, Priscille Sauvegrain, Elizabeth Draper, Liis Toome,
Rym El Rafei, Stavros Petrou, Henrique Barros, Luc Zimmermann, Marina
Cuttini, Jennifer Zeitlin
To cite this version:
Anna-Veera Seppanen, Priscille Sauvegrain, Elizabeth Draper, Liis Toome, Rym El Rafei, et al.. Parents’ ratings of post-discharge healthcare for their children born very preterm and their suggestions for improvement: a European cohort study. Pediatric Research, Nature Publishing Group, 2020, 139 (1), pp.e20151175. �10.1038/s41390-020-01120-y�. �inserm-03168758�
Parents’ ratings of post-discharge healthcare for their children born very preterm and their suggestions for improvement: a European cohort study
Anna-Veera Seppänen1,2*, Priscille Sauvegrain1,3, Elizabeth S Draper4, Liis Toome5,6,
Rym El Rafei1,2, Stavros Petrou7,8, Henrique Barros9, Luc J I Zimmermann10,11, Marina
Cuttini12, Jennifer Zeitlin1 and the SHIPS Research group**
*Corresponding author:
Anna-Veera Seppänen
Université de Paris, CRESS, Obstetrical Perinatal and Pediatric Epidemiology Research
Team, EPOPé, INSERM, INRA, F-75004 Paris, France
Maternité de Port-Royal, 53 Avenue de l’Observatoire, 75014, Paris, France.
E-mail: anna-veera.seppanen@inserm.fr
Telephone: +33 (0)1 4234 5583
**SHIPS Research Group: Belgium (J Lebeer, I Sarrechia, P Van Reempts, E Bruneel,
E Cloet, A Oostra, E Ortibus); Denmark (K Boerch, P Pedersen); Estonia (L Toome, H
Varendi, M Männamaa); France (PY Ancel, A Burguet, PH Jarreau, V Pierrat, A
Nuytten); Germany (RF Maier, M Zemlin, B Misselwitz, L Wohlers) Italy (M Cuttini, I
Croci, V Carnielli, G Ancora, G Faldella, F Ferrari); the Netherlands (A van Heijst, C
Koopman-Esseboom); Poland (J Gadzinowski, J Mazela, A Montgomery, T Pikuła)
Portugal (H Barros, R Costa, C Rodrigues); Sweden (U Aden); United Kingdom (ES
team (S Petrou); Inserm Coordination (J Zeitlin, A M Aubert, C Bonnet, R El Rafei, A-V
Seppänen)
Affiliations
1. Université de Paris, CRESS, Obstetrical Perinatal and Pediatric Epidemiology
Research Team, EPOPé, INSERM, INRA, F-75004 Paris, France
2. Sorbonne Université, Collège Doctoral, F-75005 Paris, France
3. Department of Obstetrics and Gynecology, Pitié-Salpêtrière Hospital, AP-HP, Paris,
France
4. Department of Health Sciences, University of Leicester, Leicester, United Kingdom
5. Tallinn Children’s Hospital, Tallinn, Estonia
6. University of Tartu, Tartu, Estonia
7. Warwick Medical School, University of Warwick, Coventry, United Kingdom
8. Nuffield Department of Primary Care Health Sciences, University of Oxford, Oxford,
United Kingdom
9. EPIUnit-Instituto de Saúde Pública da Universidade do Porto, Porto, Portugal
10. European Foundation for the Care of Newborn Infants (EFCNI), Munich, Germany
11. Department of Paediatrics, Research School for Oncology and Developmental
Biology, Maastricht UMC+, Maastricht, the Netherlands
12. Clinical Care and Management Innovation Research Area, Bambino Gesù Children’s
Author contributions
AVS, ESD, LT, RER, SP, HP, MC, JZ and the SHIPS Research Group made substantial
contributions to conception and design and acquisition of data. AVS, PS and JZ analyzed
the data. AVS, PS, ESD, LT, RER, SP, HP, LJZ, MC and JZ contributed to interpretation
of data, drafting the article, revising it critically for important intellectual content, and
approved the final version to be published. Members of the SHIPS research group approved
the final version to be published.
Statement of financial support
The research received funding from the European Union’s Horizon 2020 Research and
Innovation Programme under grant agreement No 633724. Anna-Veera Seppänen has a
doctoral contract funded by Sorbonne Université Collège Doctoral, Paris, France.
Disclosure
No conflict of interest declared.
Category of study
Population study
Patient consent
Ethics approvals and parental consent were obtained according to national legislation in
Acknowledgement
This is a post-peer-preview, pre-copyedit version of an article published in Pediatric
Research. The final authenticate version is available online at:
http://dx.doi.org/10.1038/s41390-020-01120-y
Impact Statement
In a European population-based very preterm birth cohort, parents rated post-discharge healthcare as poor or fair for 14.2% of children, with a wide variation
(6.1% to 31.6%) between countries
Dissatisfaction was reported in over one-third of cases when children had health or developmental difficulties, such as epilepsy or cerebral palsy
Parents’ free-text suggestions for improving preterm-related post-discharge healthcare were similar across countries; these focused primarily on better
communication with parents and better coordination of care
Parents’ lived experiences are a valuable resource for understanding where care improvements are needed and should be included in future research
Abstract
Background: Follow-up of very preterm infants is essential for reducing risks of health and
developmental problems and relies on parental engagement. We investigated parents’
perceptions of post-discharge healthcare for their children born very preterm in a European
multi-country cohort study.
Methods: Data come from a five-year follow-up of an area-based cohort of births <32
weeks’ gestation in 19 regions from 11 European countries. Perinatal data were collected
from medical records and five-year data from parent-report questionnaires. Parents rated
post-discharge care related to their children’s preterm birth (poor/fair/good/excellent), and
provided free-text suggestions for improvements. We analyzed sociodemographic and
medical factors associated with poor/fair ratings, using inverse probability weights to
adjust for attrition bias, and assessed free-text responses using thematic analysis.
Results: Questionnaires were returned for 3635 children (53.8% response rate). Care was
rated as poor/fair for 14.2% [6.1% (France) to 31.6% (Denmark)]; rates were higher when
children had health or developmental problems (e.g. cerebral palsy (34.4%) or epilepsy
(36.9%)). From 971 responses, four themes and 25 sub-themes concerning care
improvement were identified.
Conclusions: Parents’ experiences provide guidance for improving very preterm children’s
post-discharge care; this is a priority for children with health and developmental problems
Introduction
Very preterm births (<32 weeks of gestation) represent up to 1.6% of births in high-income
countries (1) or up to 2% of births worldwide (2). Although survival for these infants has
improved, they remain at increased risk of developing multiple health and developmental
problems compared to infants born at term (3, 4). As the prognosis for each individual
infant is unknown at discharge from hospital, follow-up is essential for the early
identification of health needs, the coordination of health services from multiple providers,
and for enabling timely intervention (5).
Parents’ engagement is crucial for successful follow-up of preterm infants (6), but few
studies have reported on parents’ own evaluations of the post-discharge care offered to
their children. Parents may provide important insights for improving healthcare beyond
aspects of medical, outcome-related quality (7, 8), and this knowledge may help to improve
service adherence, care delivery (8) and, consequently, health outcomes. Qualitative
studies involving parents have suggested that there is room for improvement in the
continuity of care for preterm infants (9) and that assistance with accessing services or
providing comprehensive information to parents may impact on the use of post-discharge
services in this population (10). The use of early intervention services has been shown to
improve outcomes in both children (11) and parents (12) and may be of most benefit to
socially deprived families (13). At the same time, unfavorable social factors such as poorer
financial resources (14) or lower educational level (15) have been associated with multiple
barriers for attending follow-up services (14) and follow-up discontinuation (15) for
Although parents are frequently involved in evaluating specific healthcare services or units
(16, 17), pediatric specialties (18) or aspects of care (9), there have been no large scale or
international evaluations of post-discharge care involving parents of children born very
preterm. The main aims of this study were to assess parents’ ratings of their children’s
prematurity-related care from discharge from neonatal care until five years of age, in a
large cohort from 19 regions in 11 European countries, by sociodemographic
characteristics and child health outcomes. In addition, we aimed to provide a thematic
synthesis of parents’ suggestions on how healthcare can be improved.
Method
Data sources
The data were collected for the Screening to improve Health In very Preterm infantS
(SHIPS) study, which followed up the area-based EPICE cohort of infants born before 32
weeks’ gestation over 12 months in 2011-2012 (19, 20), in all maternity units of 19 regions
in 11 European countries: Belgium (Flanders); Denmark (Eastern region); Estonia (entire
country); France (Burgundy, Ile-de-France, and Northern regions, six months’ data
collection only); Germany (Hesse and Saarland); Italy (Emilia-Romagna, Lazio, and
Marche); the Netherlands (Central and Eastern regions), Poland (Wielkopolska); Portugal
(Lisbon and Northern regions); Sweden (greater Stockholm) and the United Kingdom (East
Midlands, Northern, and Yorkshire and the Humber regions). Children were followed up
at two and five years of age using parental questionnaires. At five years of age, a sub-set
of all children born before 28 weeks’ gestation were also invited to participate in clinical
Ethics
Ethics approvals and parental consent were obtained according to national legislation in
each country before data collection. The SHIPS project was approved by the French
Advisory Committee on Use of Health Data in Medical Research (CCTIRS) and the French
National Commission for Data Protection and Liberties (CNIL).
Study population
At baseline, the cohort included 7900 live births and 2429 stillbirths and terminations of
pregnancies. 6792 infants were discharged alive from the neonatal unit (Supplemental
Figure S1 (online)). At five years, 6759 children were alive, of whom parents of 3687
(54.5%) children participated in the follow-up and 3635 (53.8%) returned a questionnaire
(19).
Data collection
At inclusion, pregnancy and perinatal data were collected from obstetric and neonatal
records. At five years of age, health, healthcare and socioeconomic information was
collected using parent-report questionnaires that had been pre-tested in all national
languages. The questionnaires could be completed at home, in follow-up clinics, online or
using paper questionnaires, depending on local study protocols. Questionnaires could be
filled in by mothers, fathers or other primary caregivers. They were asked the following
question: “How would you describe the healthcare your child has received related to his or
or has not received any healthcare related to very preterm birth?”. The parents were also
asked to provide suggestions for how healthcare for very preterm children can be improved,
as free-text responses.
Data analysis
Proportions of poor to fair ratings (considered to represent dissatisfaction) were described
by country. The association between dissatisfaction, and sociodemographic characteristics
and child health was assessed using χ² tests. Sociodemographic characteristics included
maternal educational level (lower: lower secondary [ISCED levels 0-2], intermediate:
upper or post-secondary, non-tertiary or short cycle tertiary [levels 3-5], or higher:
Bachelor degree or higher [levels 6-8]) (21), country of birth (native-born, born elsewhere
in Europe or born outside Europe), family situation (mother living with partner vs. single
caregiver or other family situation), age at delivery (<24, 25-34 or >35 years), parity at
delivery (multiparous vs. nulliparous), and multiplicity (singleton vs. twins or more). As in
previous analyses of this cohort, perinatal risk factors were used to create a variable
representing overall risk of health and developmental problems at discharge from the
neonatal hospitalization, classified as: lower (born over 29 weeks’ gestation, not small for
gestational age [SGA; birthweight <10th centile for intrauterine norms for gestational age
and sex, using references developed for the cohort (22)] and without severe neonatal
morbidities [bronchopulmonary dysplasia (BPD), i.e. need for supplemental oxygen or ventilation at 36 weeks’ postmenstrual age, stages III–V retinopathy of prematurity (ROP),
levels III-IV intraventricular hemorrhage (IVH), cystic periventricular leukomalacia
[CA]), moderate (not classified as higher or lower risk) or higher risk (born below 28 weeks’ gestation or at least one neonatal morbidity or a severe CA) (23). Data on the child’s
health at five years included a parental rating of their child’s overall health status
(good/excellent vs. poor/fair) and asthma diagnosis. Data on developmental and
neurosensory difficulties included the parent’s rating of their child’s development
(average/advanced vs. delayed/very delayed), clinical diagnosis of cerebral palsy, epilepsy
and autism, and reports of moderate or severe vision or hearing problems (defined as
having difficulties seeing even with glasses, being blind or seeing light only, requiring
hearing aids, or being deaf).
To obtain adjusted risk ratios for dissatisfaction with healthcare services, we used three
multilevel generalized linear regression models with a log link, Poisson distribution and a
robust variance estimator (24), with two levels to account for correlation between siblings:
one including sociodemographic variables and country only, and two adding either
parent-rated health and developmental problems or diagnosed developmental or neurosensory
difficulties. We did not run a model with all variables due to collinearity between
parent-reported health status and clinical diagnoses. The covariates were selected based on the
scientific literature and bivariate analyses, including variables that were related to parental
ratings with a p-value <0.2. We used the sample average as the reference for presenting the
country risk ratios for poor/fair ratings. In sensitivity analyses, regression models were (1)
adjusted for all covariates without selection based on a p-value cut-off and (2) restricted to
Non-response and missing data
The response rate varied depending on the country (53.8% overall, range 29.3 to 96.4%);
non-responders in the cohort were more likely to be younger, foreign-born mothers and
have a lower educational level, as detailed elsewhere (19). To take into consideration
potential attrition bias, we generated inverse probability weights based on characteristics
of non-responders available at baseline and at the two-year follow-up, after multiple
imputation of missing values (25), following methods previously used in this cohort (26).
This approach gives a higher weight to children with characteristics that are
under-represented because of non-response. First, twenty imputations using multiple chained
equations were performed to impute missing values for the variables used for predicting
the inverse probability weights. Data were assumed to be missing at random. All variables
associated with loss to follow-up were included in the regression: gestational age in
completed weeks, Apgar score (<7), use of continuous positive airway pressure (CPAP),
use of mechanical ventilation, use of prophylactic surfactant within two hours after birth,
birth in level 3 unit, inborn status (no transfer within 48h of birth), SGA, any CA (severe
or non-severe vs none), BPD, any severe morbidity at discharge (IVH or cPVL, ROP or
NEC), surgery (for patent ductus arteriosus, CA, NEC or other reasons), infant received
human milk at discharge, mode of delivery (vaginal/instrumental vs caesarean), previous
caesarean section, parity at delivery, antepartum hemorrhage after week 20, premature
rupture of membranes (>12h), multiplicity, mother’s age at delivery, mother’s country of
birth, mother’s educational level, gross motor impairment at 2 years corrected age (27) and
cognitive delay at 2 years corrected age (27) and study region. The weights were estimated
are derived from the weighted sample and all models were run with weights. In sensitivity
analyses, we ran models truncating weight values at the 95th percentile to assess whether
the results were affected by the extremes of the weight distribution.
Missing data were not frequent among responders: 2.7% of healthcare ratings were missing
and the proportion of missing data varied between 0.3% (maternal age) and 5.3% (country
of origin) for co-variables.
Analysis of free-text responses
Free-text responses were explored using thematic analysis. We used an iterative process
for the translation of responses and initial coding into keywords and subthemes. The
approximately 1300 free-text responses were first automatically translated using Google
Translate. Tables including the original juxtaposed with the automatically translated text
were used for a first coding of keywords and preliminary themes by the first author. In this
step, specific ambiguities in the translations or where multiple interpretations were possible
were highlighted. These tables were then sent to the country teams who reviewed the
translations and key words. The focus of this step was to ensure that the text was correctly
translated and that these translations, as well as the keywords, reflected the original content.
As it was not possible to return questionnaires to the responders for clarifications, responses
that could not be interpreted after review, due to poor wording or lack of detail, were
removed. After this step, keywords were coded into themes and subthemes by the first
author, which were reviewed and validated by a qualitative researcher (PS); a random
first author until consensus was reached. Responses that contained more than one
suggestion were coded into several themes and duplicate responses for multiple siblings
were removed. Themes and subthemes were summarized and described by country and
healthcare ratings. Citations were extracted to illustrate the most common subthemes, while
ensuring the confidentiality of the responder. The citations selected for presentation in the
manuscript were reviewed again by country team members to ensure the precision of the
translation.
All data analyses were carried out with STATA 14.0 (Stata Corp., College Station, TX,
USA) and Excel 2013.
Results
Questionnaires were returned for 3635 children; by mothers (83%), fathers (15%) and other
caretakers, such as grandparents (1.4%), all hereafter referred to as parents. Parents
reported that 92.8% of the children had received post-discharge care for their prematurity.
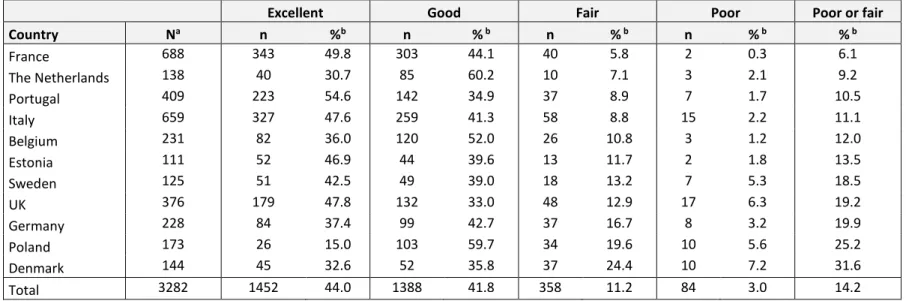
For 14.2% of these children, parents judged the care to be poor or fair, but this varied from
6.1% in France to 31.6% in Denmark. (Table 1). Parents expressed more dissatisfaction
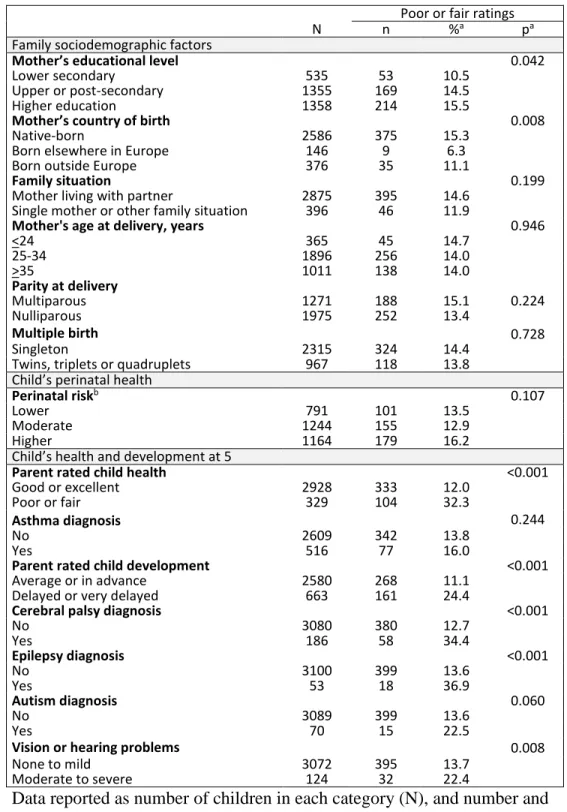
with post-discharge care when maternal educational level was higher and when mothers
were native-born or born outside Europe compared to mothers born elsewhere in Europe
(Table 2). Proportions of poor/fair ratings were higher for children with parent-rated health
or developmental problems, diagnosed cerebral palsy or epilepsy, or moderate to severe
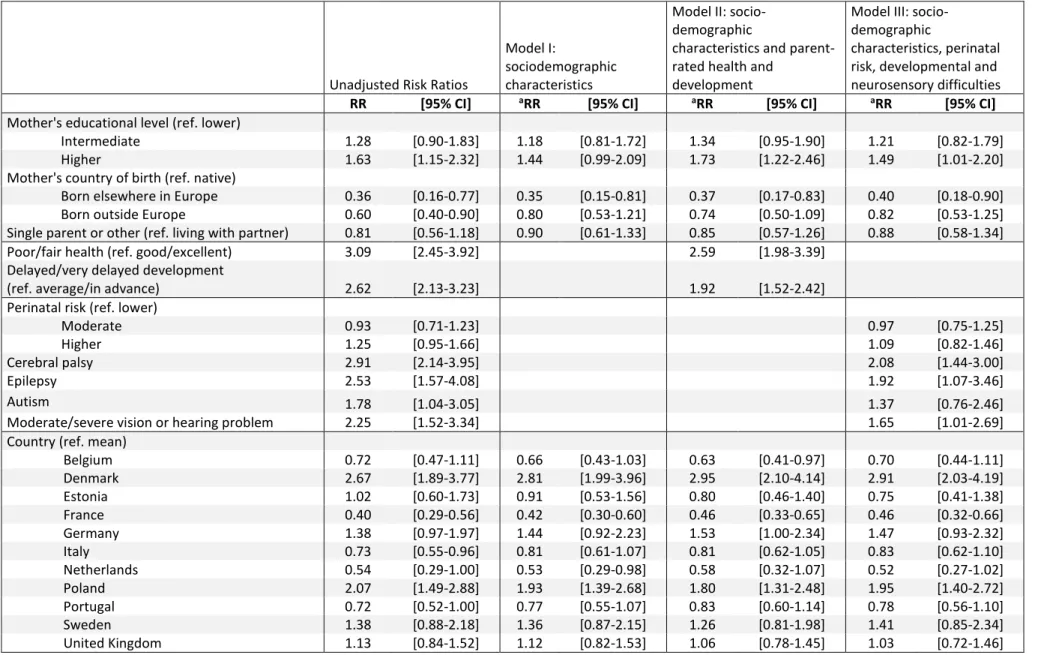
Higher maternal educational level, being native-born and child health and developmental
difficulties remained associated with poor/fair ratings in the adjusted analyses (Table 3).
Significant differences in risk ratios persisted across countries after adjustment, despite
slight changes in point estimates. Incorporating remaining covariates (mother’s age, parity,
multiple birth and asthma diagnosis, p-value>0.2) in our sensitivity analysis did not change
these associations (data not shown). Sensitivity analysis with only mothers as responders
showed slightly higher rates of dissatisfaction (15.0% instead of 14.2%), but did not change
the results from the main models (data not shown). Differences between weighted and
unweighted proportions of poor and fair ratings were minimal: 13.5% [95% CI 12.3-14.7]
versus 14.2% [95% CI 12.9-15.6] overall (see Supplemental Table S1 (online) for
unweighted proportions by country) and associations with other co-variables in unweighted
and weighted models were similar (Supplemental Table S2 (online)), but slightly increased the association between mother’s educational level and dissatisfaction as well as perinatal
health and dissatisfaction. Sensitivity analyses truncating weights at the 95th percentile
(n=52 at weight=4.24) did not affect results. See Supplemental Table S2 (online) for
models (Model III) with and without truncated weights, compared to unweighted models.
Parents provided 1105 (30%) unique free-text responses, of which 85 stated ‘no comment’
or ‘do not know’ and 49 that the child had not received post-discharge care. The remaining
971 responses were analyzed thematically. Some themes did not relate to improvements in
post-discharge healthcare, but focused on positive experiences with healthcare (n=232
suggestions) or care during the neonatal hospitalization (n=137 suggestions) and were
excluded. Four themes and 25 subthemes were related to healthcare improvements, as
post-discharge care; 25.7% (n=246) rated the care as poor or fair and 74.3% (n=710) as
good or excellent (not shown).
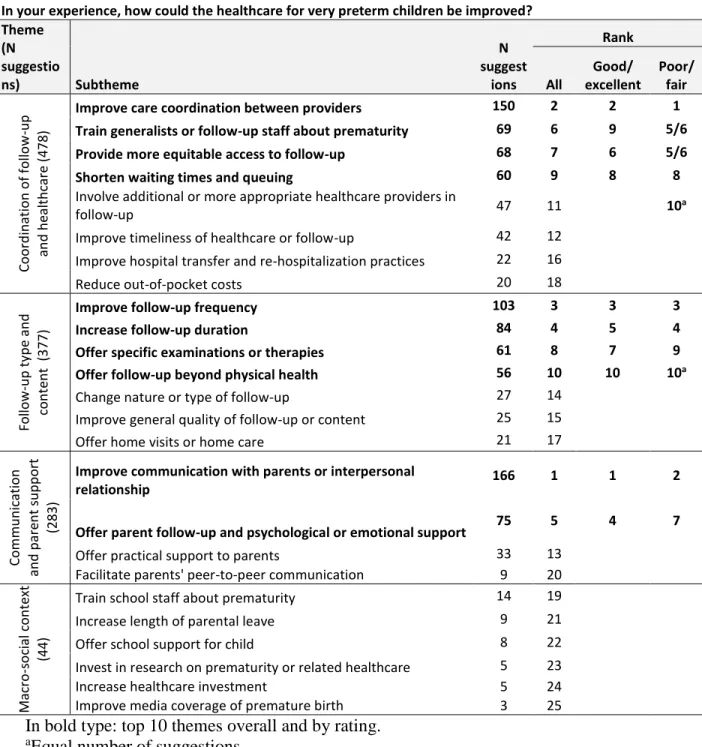
The most frequent theme was I. Coordination of follow-up and healthcare, with Improving
care coordination as the most common subtheme. Parents reported a lack of coordination,
having to take responsibility for the organization of healthcare and identification of the
appropriate healthcare providers for their child, which was described as an exhausting,
stressful, time consuming or difficult task. Some parents experienced having numerous
appointments with poor continuity of care and lack of communication between multiple
healthcare providers, or asked for a reference person to coordinate care or follow-up.
“Big disappointment that no one has overall responsibility for follow-up. Our daughter has many doctor visits at three different hospitals. Countless visits could have been avoided if someone had an overview of the situation.” – Parent, Sweden (care rating:
Poor)
Other reoccurring subthemes in this category included the need for further training of
generalists and nurses (especially health visitors and Child Healthcare Centre nurses) on
preterm birth, having more equitable access to follow-up and services, and reducing
waiting times on waiting lists, especially for visits to specialists, and queuing in the waiting
rooms.
“After finishing the follow-up at the neonatal unit, we find that both the Child Healthcare Centre nurse and the preschool lack knowledge of premature babies and their needs. Thus, more knowledge/education to Child Health Centre and preschool staff.” – Parent,
“Unfortunately, help for premature babies is only available in larger cities. We live in the countryside and have limited access to all specialists. A visit to a specialist is
associated with an additional trip, and I do not always have a transport and unfortunately there is still a very long waiting time for some specialists.” – Parent,
Poland (care rating: Good)
The second most frequent theme was II. Follow-up type and content. Two common
suggestions included having more frequent or longer follow-up. The reasons included
reassuring parents that the child was reaching important developmental milestones, to
know whether the child was ready for school and/or needed school support. A few parents
felt that follow-up was unnecessary when their child was doing well.
“There should be a follow-up when the children reach school age to see how they are developing and whether they are ready to go to school.” – Parent, Denmark (care rating:
Fair)
Improving follow-up with additional examinations or therapies, especially before school
start, and following up on other areas apart from physical health, such as emotional and
mental health, were two frequent subthemes in this category.
“Preterm children could have a check every year, especially hearing, vision and psychologist. There should definitely be a check before school.” – Parent, Estonia (care
“Follow-up on physical health was fine. Follow-up on mental health and "invisible" late effects were non-existent. We were all alone with those things and ended up seeking help
from a private consultant.” – Parent, Denmark (care rating: Poor)
Improving healthcare professionals’ communication with parents, in category III.
Communication and parent support, was the most frequent subtheme overall. Main issues
were lack of communication from healthcare providers and lack of information sharing
with parents regarding medical procedures, follow-up and medical services available, how
to care for a child born very preterm and what to expect regarding the child’s long-term
health or schooling. Some suggestions concerned interpersonal aspects, such as lack of
empathy or listening, or requesting a more humane or positive attitude from healthcare
providers.
“It was explained in the neonatal unit that in the future we may come across problems such as learning difficulties, vision, hearing, developmental delay. However, it was never explained if and what services would help overcome any
of these problems.” – Parent, UK (care rating: Poor)
Parents also frequently suggested psychological or emotional support for the parents
themselves as part of the long-term follow-up after discharge. They expressed a feeling of
being left alone to cope with the trauma of very preterm birth, and the burden of taking
care of their child after discharge, without sufficient psychological support for both parents.
“I, as a mother, would have wished for better support after discharge. After the hospital stay, you are left alone with your worries and fears”. – Parent, Germany (care rating:
“Making room for parents too, because also the motherhood was premature.” – Parent, Italy (care rating: Fair)
Subthemes were similar across countries (not shown), and similarly ranked for parents who
rated the healthcare as poor or fair and those who rated healthcare as good or excellent.
Discussion
Overall, 14.2% of the children in our study received healthcare that their parents rated as
poor or fair, with variation between 6.1% and 31.6% by country. However, dissatisfaction
was significantly higher for children with health or developmental problems; up to over
one-third when children had a diagnosis of cerebral palsy or epilepsy or when parents rated their children’s health as poor or fair. Dissatisfaction with post-discharge care was more
frequent among mothers with higher educational status. Thematic analysis of 971 parental
responses identified four themes and 25 subthemes about how healthcare could be
improved, which were largely similar across countries.
The strengths of this study include its population-based design, geographic diversity, large
sample size and the use of a standardized, pre-tested questionnaire. A strength, but also a
limitation of the study is the wide definition of post-discharge healthcare covering the
period between NICU discharge and five years of age. As follow-up programs and health
services vary across countries in terms of availability, content and duration, our
questionnaire intentionally referred to a large range of services over a long period of time.
aspects in their ratings (medical quality, screening, interventions etc.), unless parents
specified the service or time period in the free-text answers. The free-text question
intentionally leads parents towards more negative experiences, as it focused on aspects
requiring improvement in care. However, the long time period may lead parents to refer
care ratings either to more recent care, or care related to more difficult and stressful
experiences, which may have happened around NICU discharge and in early childhood
when medical follow-up is more intense. In the latter case, the ratings may be more negative
than if the question had covered a more proximate period. Unfortunately, we did not have
data on the characteristics of services received nor objective measures of the quality of
services, such as waiting times or service availability, to contrast with parental perceptions.
Another potential limitation relates to the multilingual nature of our sample, in particular
when interpreting the free-text responses. When translation is part of the research process,
it inevitably involves a degree of interpretation (28), and may increase the risk of
misinterpretation of answers (29). To minimize this risk, we used an iterative process for
the translation and interpretation using automatic translation, followed by coding of
keywords and finally a review of translation accuracy and interpretation by researchers in
each of the study countries. A final limitation was the potential for bias linked to
non-response, which was 45.5% for the overall sample and higher in some countries (19). Loss
to follow-up is a challenge in longitudinal cohort studies (30), especially those with
population-based designs, and can be related tocharacteristics that may affect healthcare
perceptions. We used inverse probability weights to adjust for attrition bias. Reassuringly,
results based on the unweighted and weighted analyses were similar, but slightly increased the association between mother’s educational level and dissatisfaction as well as perinatal
health and dissatisfaction. Previous studies in this cohort have shown that the association
between sociodemographic or perinatal factors and health-related outcomes may be
accentuated when using these weights (21), as increased loss to follow-up in socially
disadvantaged groups is taken into account.
The proportion of poor/fair ratings varied widely across countries. The study countries
differ on several structural aspects that may have contributed to these differences, but that
we were not able to measure, such as the organization of primary care (31), level of
integrated care in the case of multi-morbidity (31), patients’ ability to pay for out of
pocket-costs (32), and the state’s involvement in the healthcare system (33). Furthermore,
follow-up and subsequent care are likely to have been organized very differently across the
regions, including access to specialists (23), as no international standards for follow-up
existed at the time. Follow-up programs aim to facilitate care coordination and timely
intervention, and might in its absence have contributed to differences in overall satisfaction.
Our study was not designed to link parental perceptions to specific health system features
and this remains an area for further research. Differences in ratings could also be related
to factors unrelated to the healthcare system. Research on adult patients has proposed that
care satisfaction is to a large extent influenced by individual factors such as personality,
expectations about healthcare and health status (34). Patient expectations, in turn, have
been associated with several characteristics, including patient age and educational level
(34, 35), which could explain the association between parents’ educational status and
dissatisfaction in our study. Unknown broader societal factors (34) may explain the
parent sociodemographic factors. The subjectivity of the satisfaction measure in our study
may accentuate the impact of individual and social factors (36), which involve expectations
and for which there is no common base level (36), as well as different levels of “tolerance”
towards service quality, which may depend on the general standard of living in the country
(36). This may partly explain the differences in ratings for native, European and
non-European-born mothers. Finally, the inclination to express dissatisfaction or complaints
may also be cultural (37) and influence levels of dissatisfaction across countries, but there
is, to our knowledge, little evidence on the impact of culture on care perceptions across
Europe. The unexplained differences in parents’ perceptions may partly mean that care
satisfaction represents something different in each country (38).
The parents’ suggestions concerning how healthcare could be improved were
predominantly the same across countries. The suggestions were mainly organizational
(follow-up coordination, provider training, access to services and timeliness), but the most
frequently mentioned subtheme concerned interpersonal aspects (healthcare-provider
communication and relationship with parents). Similar themes have been found in other
studies (7, 9, 10, 16, 39, 40), suggesting that healthcare providers may be subject to similar
shortcomings regardless of follow-up content and healthcare context. Of note was that
many parents had suggestions for improving healthcare despite rating their care as good or
excellent, and these were largely similar to parents expressing dissatisfaction. This
apparently paradoxical result suggests that even parents who are satisfied with their care in
general experience difficulties with care coordination or have unsatisfactory interactions
Parents of children with health or developmental problems were less satisfied with
healthcare, but few suggestions centered on health outcomes, medical quality or technical
aspects of care. Other studies have found that dissatisfaction with healthcare services does
not necessarily reflect poor medical quality of care (7, 22), but rather poor communication,
especially when patients have major disabilities (41) or complex healthcare needs (8).
Additionally, poor organization of healthcare may become more apparent for parents
whose children require complex multidisciplinary care compared to those with less
complex health problems, not seeking healthcare to the same extent. It is also possible that
dissatisfaction with health services has an impact on the further use of follow-up and health
services, such as change of care provider, seeking care in the private sector, or
discontinuing follow-up. We do not have data on unmet service need, which is particularly
difficult to define in our European cohort because of differences in health care systems and
this remains an area for further investigation. Our results are consistent with those from
the Models of Child Health Appraised (MOCHA) study, which showed that European
countries are failing to manage complex healthcare needs in the general pediatric
population, with no policies for care coordination and care planning after discharge (42).
The lack of integrated healthcare systems for complex care manifests as a lack of
multidisciplinary care and inconsistent healthcare provision depending on where care is
sought, and may ultimately negatively affect quality of care and health outcomes (43). The
parents’ suggestions in our study coincide with policy improvements currently being
follow-up until school age (45) and parent support (46). Further improvements based on parents’ lived experiences should be considered in policy strategies.
Over one in ten children born very preterm received post-discharge care that their parents
rated as poor or fair, with the highest rates for children who are most reliant on health
services. Many parents provided suggestions for improving care, which centered on
common themes, despite the wide geographic heterogeneity in ratings. Parents constitute a
valuable resource for researchers and policy makers seeking to improve healthcare and for
References
1. Delnord, M., et al. Variations in very preterm birth rates in 30 high-income
countries: are valid international comparisons possible using routine data? BJOG
124:785-794 (2017).
2. Blencowe, H., et al. National, regional, and worldwide estimates of preterm birth
rates in the year 2010 with time trends since 1990 for selected countries: a
systematic analysis and implications. Lancet 379:2162-2172 (2012).
3. Saigal, S. & Doyle, L.W. An overview of mortality and sequelae of preterm birth
from infancy to adulthood. Lancet 371:261-269 (2008).
4. Synnes, A., et al. Determinants of developmental outcomes in a very preterm
Canadian cohort. Arch. Dis. Child Fetal Neonatal Ed. 102:F235-F234 (2017).
5. McManus, B.M., Richardson, Z., Schenkman, M., Murphy, N. & Morrato, E.H.
Timing and Intensity of Early Intervention Service Use and Outcomes Among a
Safety-Net Population of Children. JAMA Netw. Open 2:e187529 (2019).
6. Little, A.A., Kamholz, K., Corwin, B.K., Barrero-Castillero, A. & Wang, C.J.
Understanding Barriers to Early Intervention Services for Preterm Infants:
Lessons From Two States. Acad. Pediatr. 15:430-438 (2015).
7. Gustavsson, S., Gremyr, I. & Kenne Sarenmalm, E. Designing quality of
care--contributions from parents: Parents' experiences of care processes in paediatric
care and their contribution to improvements of the care process in collaboration
with healthcare professionals. J. Clin. Nurs. 25:742-751 (2016).
8. Junewicz, A. & Youngner, S.J. Patient-satisfaction surveys on a scale of 0 to 10:
9. Rucci, P., et al. Measuring parents' perspective on continuity of care in children
with special health care needs. Int. J. Integr. Care 15:e046 (2015).
10. Pritchard, M.A., Colditz, P.B., Beller, E.M. & Queensland Optimising Preterm
Infant Outcomes Group. Parental experiences and preferences which influence
subsequent use of post-discharge health services for children born very preterm. J.
Paediatr. Child Health 44:281-284 (2008).
11. Spittle, A., Orton, J., Anderson, P., Boyd, R. & Doyle, L.W. Early developmental
intervention programmes post-hospital discharge to prevent motor and cognitive
impairments in preterm infants. Cochrane Database Syst. Rev. 12:CD005495
(2012).
12. Benzies, K.M., Magill-Evans, J.E., Hayden, K.A. & Ballantyne, M. Key
components of early intervention programs for preterm infants and their parents: a
systematic review and meta-analysis. BMC Pregnancy Childbirth 13 Suppl 1:S10
(2013).
13. Spittle, A.J., Treyvaud, K., Lee, K.J., Anderson, P.J. & Doyle, L.W. The role of
social risk in an early preventative care programme for infants born very preterm:
a randomized controlled trial. Dev. Med. Child Neurol. 60:54-62 (2018).
14. Ballantyne, M., Benzies, K.M., Rosenbaum, P. & Lodha, A. Mothers' and health
care providers' perspectives of the barriers and facilitators to attendance at
Canadian neonatal follow-up programs. Child Care Health Dev. 41:722-733
(2015).
15. Callanan, C., et al. Children followed with difficulty: how do they differ? J.
16. Butt, M.L., Pinelli, J. & Hunsberger, M. Parents' perceptions of ambulatory
neonatal follow-up programs. Journal of Neonatal Nursing 16:126-137 (2010).
17. Hagen, I.H., Iversen, V.C., Nesset, E., Orner, R. & Svindseth, M.F. Parental
satisfaction with neonatal intensive care units: a quantitative cross-sectional study.
BMC health services research 19:37 (2019).
18. McIntyre, L.L. & Zemantic, P.K. Examining services for young children with
autism spectrum disorder: Parent satisfaction and predictors of service utilization.
Early childhood education journal 45:727-734 (2017).
19. Zeitlin, J., et al. Cohort profile: Effective Perinatal Intensive Care in Europe
(EPICE) very preterm birth cohort. Int. J. Epidemiol. 49:372-386 (2020).
20. Zeitlin, J., et al. Use of evidence based practices to improve survival without
severe morbidity for very preterm infants: results from the EPICE population
based cohort. BMJ 354:i2976 (2016).
21. Sentenac, M., et al. Maternal education and language development at 2 years
corrected age in children born very preterm: results from a European
population-based cohort study. J. Epidemiol. Community Health 74:346-353 (2020).
22. Monier, I., et al. Fetal and neonatal outcomes of preterm infants born before 32
weeks of gestation according to antenatal vs postnatal assessments of restricted
growth. Am. J. Obstet. Gynecol. 216:516 e511-516 e510 (2017).
23. Seppanen, A.V., et al. Specialist health care services use in a European cohort of
infants born very preterm. Dev. Med. Child Neurol. 61:832-839 (2019).
24. Cummings, P. Methods for estimating adjusted risk ratios. Stata Journal
25. Seaman, S.R., White, I.R., Copas, A.J. & Li, L. Combining multiple imputation
and inverse-probability weighting. Biometrics 68:129-137 (2012).
26. Bonnet, C., et al. Low breastfeeding continuation to 6 months for very preterm
infants: A European multiregional cohort study. Matern. Child Nutr.15:e12657
(2018).
27. Johnson, S., et al. Neurodevelopmental outcomes following late and moderate
prematurity: a population-based cohort study. Arch. Dis. Child Fetal Neonatal Ed.
100:F301-308 (2015).
28. Larkin, P.J., Dierckx de Casterle, B. & Schotsmans, P. Multilingual translation
issues in qualitative research: reflections on a metaphorical process. Qual. Health
Res. 17:468-476 (2007).
29. Esposito, N. From meaning to meaning: the influence of translation techniques on
non-English focus group research. Qual. Health Res. 11:568-579 (2001).
30. MacBean, V., Drysdale, S.B., Zivanovic, S., Peacock, J.L. & Greenough, A.
Participant retention in follow-up studies of prematurely born children. BMC
Public Health 19:1233 (2019).
31. European Commission. State of health in the EU: Companion report 2017.
(Publications Office of the European Union, Luxembourg, 2017). Available from:
https://ec.europa.eu/health/sites/health/files/state/docs/2017_companion_en.pdf
(Accessed 2 August 2020)
32. Stepurko, T., Pavlova, M. & Groot, W. Overall satisfaction of health care users
with the quality of and access to health care services: a cross-sectional study in six
33. Wendt, C., Kohl, J., Mischke, M. & Pfeifer, M. How Do Europeans Perceive
Their Healthcare System? Patterns of Satisfaction and Preference for State
Involvement in the Field of Healthcare. European Sociological Review
26:177-192 (2009).
34. Bleich, S.N., Ozaltin, E. & Murray, C.K. How does satisfaction with the
health-care system relate to patient experience? Bull. World Health Organ. 87:271-278
(2009).
35. Galle, A., Van Parys, A.S., Roelens, K. & Keygnaert, I. Expectations and
satisfaction with antenatal care among pregnant women with a focus on
vulnerable groups: a descriptive study in Ghent. BMC Womens Health 15:112
(2015).
36. de Silva, A. A framework for measuring responsiveness. GPE Discussion Paper
Series: No. 32 (World Health Organization, Geneva, 2000). Available from:
https://www.who.int/responsiveness/papers/paper32.pdf?ua=1 (Accessed 2
August 2020)
37. Kowalewski, M. Dissatisfied and Critical Citizens: the Political Effect of
Complaining. Society 56:453-460 (2019).
38. Papanicolas, I., Cylus, J. & Smith, P.C. An analysis of survey data from eleven
countries finds that 'satisfaction' with health system performance means many
things. Health Aff. (Millwood) 32:734-742 (2013).
39. Butt, M.L., et al. Development and evaluation of an instrument to measure
parental satisfaction with quality of care in neonatal follow-up. J. Dev. Behav.
40. Tran, V.-T., Riveros, C., Péan, C., Czarnobroda, A. & Ravaud, P. Patients’
perspective on how to improve the care of people with chronic conditions in
France: a citizen science study within the ComPaRe e-cohort. BMJ quality &
safety 28:875-886 (2019).
41. Chang, J.T., et al. Patients' global ratings of their health care are not associated
with the technical quality of their care. Ann. Intern. Med. 144:665-672 (2006).
42. Brenner, M., et al. Management and integration of care for children living with
complex care needs at the acute-community interface in Europe. Lancet Child
Adolesc. Health 2:822-831 (2018).
43. Brenner, M., et al. Children's complex care needs: a systematic concept analysis
of multidisciplinary language. Eur. J. Pediatr. 177:1641-1652 (2018).
44. EFCNI, van Kempen, A., van Steenbrugge, G., van Wassenaer-Leemhuis, A. &
Wolke, D. European Standards of Care for Newborn Health: Coordination and
integration of care after discharge home. (European Foundation for the Care of
Newborn Infants, Munich, 2018). Available from:
https://newborn-health-standards.org/wp-content/uploads/2019/04/TEG_Follow_up_complete.pdf
(Accessed 6 April 2020)
45. EFCNI, Jaekel, J., Johnson, S., Wolke, D. & van Wassenaer-Leemhuis, A.
European Standards of Care for Newborn Health: Meeting special needs at
school. (European Foundation for the Care of Newborn Infants, Munich, 2018).
Available from:
46. EFCNI, Houtzager, B.A., van Wassenaer-Leemhuis, A., Wolke, D., Virchez, M.
European Standards of Care for Newborn Health: Parental mental health.
(European Foundation for the Care of Newborn Infants, Munich, 2018). Available
from:
TABLES AND FIGURES
Table 1. Parents’ ratings of preterm birth-related healthcare by country, ordered by weighted proportion of poor or fair ratings.
How would you describe the healthcare your child has received related to his or her preterm birth, after being discharged from the neonatal unit?
Excellent Good Fair Poor Poor or fair
Country Na n %b n % b n % b n % b % b France 688 343 49.8 303 44.1 40 5.8 2 0.3 6.1 The Netherlands 138 40 30.7 85 60.2 10 7.1 3 2.1 9.2 Portugal 409 223 54.6 142 34.9 37 8.9 7 1.7 10.5 Italy 659 327 47.6 259 41.3 58 8.8 15 2.2 11.1 Belgium 231 82 36.0 120 52.0 26 10.8 3 1.2 12.0 Estonia 111 52 46.9 44 39.6 13 11.7 2 1.8 13.5 Sweden 125 51 42.5 49 39.0 18 13.2 7 5.3 18.5 UK 376 179 47.8 132 33.0 48 12.9 17 6.3 19.2 Germany 228 84 37.4 99 42.7 37 16.7 8 3.2 19.9 Poland 173 26 15.0 103 59.7 34 19.6 10 5.6 25.2 Denmark 144 45 32.6 52 35.8 37 24.4 10 7.2 31.6 Total 3282 1452 44.0 1388 41.8 358 11.2 84 3.0 14.2
aExcluding missing values and cases where parents reported ‘no care received’ bInverse probability weights have been used to adjust for non-response
Table 2. Poor or fair ratings by sociodemographic factors, child health and health service use.
Poor or fair ratings
N n %a pa
Family sociodemographic factors
Mother’s educational level 0.042
Lower secondary 535 53 10.5
Upper or post-secondary 1355 169 14.5
Higher education 1358 214 15.5
Mother’s country of birth 0.008
Native-born 2586 375 15.3
Born elsewhere in Europe 146 9 6.3
Born outside Europe 376 35 11.1
Family situation 0.199
Mother living with partner 2875 395 14.6
Single mother or other family situation 396 46 11.9
Mother's age at delivery, years 0.946
<24 365 45 14.7 25-34 1896 256 14.0 >35 1011 138 14.0 Parity at delivery Multiparous 1271 188 15.1 0.224 Nulliparous 1975 252 13.4 Multiple birth 0.728 Singleton 2315 324 14.4
Twins, triplets or quadruplets 967 118 13.8
Child’s perinatal health
Perinatal riskb 0.107
Lower 791 101 13.5
Moderate 1244 155 12.9
Higher 1164 179 16.2
Child’s health and development at 5
Parent rated child health <0.001
Good or excellent 2928 333 12.0
Poor or fair 329 104 32.3
Asthma diagnosis 0.244
No 2609 342 13.8
Yes 516 77 16.0
Parent rated child development <0.001
Average or in advance 2580 268 11.1
Delayed or very delayed 663 161 24.4
Cerebral palsy diagnosis <0.001
No 3080 380 12.7 Yes 186 58 34.4 Epilepsy diagnosis <0.001 No 3100 399 13.6 Yes 53 18 36.9 Autism diagnosis 0.060 No 3089 399 13.6 Yes 70 15 22.5
Vision or hearing problems 0.008
None to mild 3072 395 13.7
Moderate to severe 124 32 22.4
Data reported as number of children in each category (N), and number and proportion of children with poor or fair ratings (n, %).
aProportions are calculated using inverse probability weights
bLower: >29 weeks’ gestation, not small for gestational age, no severe
neonatal morbidities, and no congenital anomaly; Moderate: not classified as higher or lower risk; Higher: <28 weeks’ gestation or at least one
Table 3. Risk ratios of poor or fair ratings by sociodemographic characteristics and child health and development
Unadjusted Risk Ratios
Model I:
sociodemographic characteristics
Model II: socio-demographic
characteristics and parent-rated health and
development
Model III: socio-demographic
characteristics, perinatal risk, developmental and neurosensory difficulties
RR [95% CI] aRR [95% CI] aRR [95% CI] aRR [95% CI]
Mother's educational level (ref. lower)
Intermediate 1.28 [0.90-1.83] 1.18 [0.81-1.72] 1.34 [0.95-1.90] 1.21 [0.82-1.79]
Higher 1.63 [1.15-2.32] 1.44 [0.99-2.09] 1.73 [1.22-2.46] 1.49 [1.01-2.20]
Mother's country of birth (ref. native)
Born elsewhere in Europe 0.36 [0.16-0.77] 0.35 [0.15-0.81] 0.37 [0.17-0.83] 0.40 [0.18-0.90]
Born outside Europe 0.60 [0.40-0.90] 0.80 [0.53-1.21] 0.74 [0.50-1.09] 0.82 [0.53-1.25]
Single parent or other (ref. living with partner) 0.81 [0.56-1.18] 0.90 [0.61-1.33] 0.85 [0.57-1.26] 0.88 [0.58-1.34]
Poor/fair health (ref. good/excellent) 3.09 [2.45-3.92] 2.59 [1.98-3.39]
Delayed/very delayed development
(ref. average/in advance) 2.62 [2.13-3.23] 1.92 [1.52-2.42]
Perinatal risk (ref. lower)
Moderate 0.93 [0.71-1.23] 0.97 [0.75-1.25]
Higher 1.25 [0.95-1.66] 1.09 [0.82-1.46]
Cerebral palsy 2.91 [2.14-3.95] 2.08 [1.44-3.00]
Epilepsy 2.53 [1.57-4.08] 1.92 [1.07-3.46]
Autism 1.78 [1.04-3.05] 1.37 [0.76-2.46]
Moderate/severe vision or hearing problem 2.25 [1.52-3.34] 1.65 [1.01-2.69]
Country (ref. mean)
Belgium 0.72 [0.47-1.11] 0.66 [0.43-1.03] 0.63 [0.41-0.97] 0.70 [0.44-1.11] Denmark 2.67 [1.89-3.77] 2.81 [1.99-3.96] 2.95 [2.10-4.14] 2.91 [2.03-4.19] Estonia 1.02 [0.60-1.73] 0.91 [0.53-1.56] 0.80 [0.46-1.40] 0.75 [0.41-1.38] France 0.40 [0.29-0.56] 0.42 [0.30-0.60] 0.46 [0.33-0.65] 0.46 [0.32-0.66] Germany 1.38 [0.97-1.97] 1.44 [0.92-2.23] 1.53 [1.00-2.34] 1.47 [0.93-2.32] Italy 0.73 [0.55-0.96] 0.81 [0.61-1.07] 0.81 [0.62-1.05] 0.83 [0.62-1.10] Netherlands 0.54 [0.29-1.00] 0.53 [0.29-0.98] 0.58 [0.32-1.07] 0.52 [0.27-1.02] Poland 2.07 [1.49-2.88] 1.93 [1.39-2.68] 1.80 [1.31-2.48] 1.95 [1.40-2.72] Portugal 0.72 [0.52-1.00] 0.77 [0.55-1.07] 0.83 [0.60-1.14] 0.78 [0.56-1.10] Sweden 1.38 [0.88-2.18] 1.36 [0.87-2.15] 1.26 [0.81-1.98] 1.41 [0.85-2.34] United Kingdom 1.13 [0.84-1.52] 1.12 [0.82-1.53] 1.06 [0.78-1.45] 1.03 [0.72-1.46]
Table 4. Free-text themes and subthemes ordered by number of suggestions and with
ranking by healthcare rating
In bold type: top 10 themes overall and by rating.
aEqual number of suggestions
In your experience, how could the healthcare for very preterm children be improved? Theme (N suggestio ns) Subtheme N suggest ions Rank All Good/ excellent Poor/ fair Coo rd in at ion o f follo w -up an d h ealt h care (478 )
Improve care coordination between providers 150 2 2 1
Train generalists or follow-up staff about prematurity 69 6 9 5/6
Provide more equitable access to follow-up 68 7 6 5/6
Shorten waiting times and queuing 60 9 8 8
Involve additional or more appropriate healthcare providers in
follow-up 47 11 10a
Improve timeliness of healthcare or follow-up 42 12 Improve hospital transfer and re-hospitalization practices 22 16
Reduce out-of-pocket costs 20 18
Follow -u p t yp e a n d con ten t (377)
Improve follow-up frequency 103 3 3 3
Increase follow-up duration 84 4 5 4
Offer specific examinations or therapies 61 8 7 9
Offer follow-up beyond physical health 56 10 10 10a
Change nature or type of follow-up 27 14
Improve general quality of follow-up or content 25 15
Offer home visits or home care 21 17
Com m u n icatio n an d p ar en t su p p o rt (283)
Improve communication with parents or interpersonal
relationship 166 1 1 2
Offer parent follow-up and psychological or emotional support 75 5 4 7
Offer practical support to parents 33 13
Facilitate parents' peer-to-peer communication 9 20
Ma cro -s o cial co n text (44)
Train school staff about prematurity 14 19
Increase length of parental leave 9 21
Offer school support for child 8 22
Invest in research on prematurity or related healthcare 5 23
Increase healthcare investment 5 24
Supplemental Figure S1. Flowchart
aNon-responders include children for whom parents did not consent to follow-up, who
were lost to follow-up or for whom a questionnaire was not returned
bCalculated over children alive at five year All very preterm births
10329 Stillbirth or termination of pregnancy 2429 Live births 7900
Deceased before discharge
1108 Alive at discharge 6792 Deceased 31 Alive at 2 6761 Non-responders 2336 Responders at 2 4425 Deceased 2 Alive at 5 6759 Non-respondersa 3072 (45.5%)b Responders at 5 3687 (54.5%)b participants; 3635 (53.8%)b returned questionnaires
Supplemental Table S1. Parents’ ratings of preterm birth-related healthcare by country, ordered by unweighted proportion of poor or
fair ratings
aExcluding missing values and cases where parents reported ‘no care received’
How would you describe the healthcare your child has received related to his or her preterm birth, after being discharged from the neonatal unit?
Excellent Good Fair Poor Poor or fair
Country Na n % n % n % n % % France 688 343 49.9 303 44.0 40 5.8 2 0.3 6.1 The Netherlands 138 40 29.0 85 61.6 10 7.3 3 2.2 9.4 Portugal 409 223 54.5 142 34.7 37 9.1 7 1.7 10.8 Italy 659 327 49.6 259 39.3 58 8.8 15 2.3 11.1 Belgium 231 82 35.5 120 52.0 26 11.3 3 1.3 12.6 Estonia 111 52 46.9 44 39.6 13 11.7 2 1.8 13.5 UK 376 179 47.6 132 35.1 48 12.8 17 4.5 17.3 Germany 228 84 36.8 99 43.4 37 16.2 8 3.5 19.7 Sweden 125 51 40.8 49 39.2 18 14.4 7 5.6 20.0 Poland 173 26 15.0 103 59.5 34 19.7 10 5.8 25.4 Denmark 144 45 31.3 52 36.1 37 25.7 10 6.9 32.6 Total 3282 1452 44.2 1388 42.3 358 10.9 84 2.6 13.5
Supplemental Table S2. Risk ratios of poor or fair ratings by sociodemographic characteristics and child health and development (A)
without weights, (B) using inverse probability weights, and (C) inverse probability weights truncated at 95th percentile
Model III: RR for poor and fair ratings by socio-demographic characteristics, perinatal risk, developmental and neurosensory difficulties
A) Without weights B) Using inverse probability
weights
C) Using inverse probability
weights truncated at 95th percentile
aRR [95% CI] aRR [95% CI] aRR [95% CI]
Mother's educational level (ref. lower)
Intermediate 1.15 [0.81-1.64] 1.21 [0.82-1.79] 1.21 [0.82-1.79]
Higher 1.38 [0.97-1.96] 1.49 [1.01-2.20] 1.49 [1.01-2.20]
Mother's country of birth (ref. native)
Born elsewhere in Europe 0.44 [0.21-0.90] 0.40 [0.18-0.90] 0.41 [0.18-0.91]
Born outside Europe 0.87 [0.60-1.26] 0.82 [0.53-1.25] 0.82 [0.54-1.26]
Single parent or other (ref. living with partner) 0.92 [0.64-1.33] 0.88 [0.58-1.34] 0.88 [0.58-1.33]
Perinatal risk (ref. lower)
Moderate 0.95 [0.74-1.23] 0.97 [0.75-1.25] 0.97 [0.75-1.25]
Higher 1.02 [0.79-1.34] 1.09 [0.82-1.46] 1.09 [0.82-1.46]
Cerebral palsy 1.89 [1.35-2.64] 2.08 [1.44-3.00] 2.08 [1.45-3.00]
Epilepsy 1.85 [1.07-3.21] 1.92 [1.07-3.46] 1.91 [1.06-3.43]
Autism 1.32 [0.74-2.35] 1.37 [0.76-2.46] 1.36 [0.75-2.44]
Moderate/severe vision or hearing problem 1.37 [0.90-2.10] 1.65 [1.01-2.69] 1.66 [1.02-2.69]
Country (ref. mean)
Belgium 0.82 [0.54-1.25] 0.70 [0.44-1.11] 0.70 [0.44-1.11] Denmark 2.46 [1.83-3.31] 2.91 [2.03-4.19] 2.90 [2.02-4.16] Estonia 0.73 [0.42-1.25] 0.75 [0.41-1.38] 0.75 [0.41-1.38] France 0.47 [0.34-0.66] 0.46 [0.32-0.66] 0.46 [0.32-0.66] Germany 1.39 [0.94-2.07] 1.47 [0.93-2.32] 1.47 [0.93-2.31] Italy 0.83 [0.65-1.08] 0.83 [0.62-1.10] 0.83 [0.62-1.10] Netherlands 0.61 [0.32-1.15] 0.52 [0.27-1.02] 0.53 [0.27-1.02] Poland 1.71 [1.29-2.28] 1.95 [1.40-2.72] 1.94 [1.39-2.71] Portugal 0.79 [0.59-1.07] 0.78 [0.56-1.10] 0.78 [0.56-1.10] Sweden 1.40 [0.91-2.17] 1.41 [0.85-2.34] 1.40 [0.85-2.32] United Kingdom 1.08 [0.80-1.44] 1.03 [0.72-1.46] 1.04 [0.74-1.47]