HAL Id: hal-01318062
https://hal.archives-ouvertes.fr/hal-01318062
Submitted on 24 May 2016HAL is a multi-disciplinary open access
archive for the deposit and dissemination of sci-entific research documents, whether they are pub-lished or not. The documents may come from teaching and research institutions in France or abroad, or from public or private research centers.
L’archive ouverte pluridisciplinaire HAL, est destinée au dépôt et à la diffusion de documents scientifiques de niveau recherche, publiés ou non, émanant des établissements d’enseignement et de recherche français ou étrangers, des laboratoires publics ou privés.
Interactive contour delineation of organs at risk in
radiotherapy: Clinical evaluation on NSCLC patients
Jose Dolz, H.A. Kirisli, T. Fechter, S. Karnitzki, O. Oehlke, U. Nestle,
Maximilien Vermandel, L. Massoptier
To cite this version:
Jose Dolz, H.A. Kirisli, T. Fechter, S. Karnitzki, O. Oehlke, et al.. Interactive contour delineation of organs at risk in radiotherapy: Clinical evaluation on NSCLC patients. Journal of Medical Physics, Medknow Publications, 2016, �10.1118/1.4947484�. �hal-01318062�
Personal
Cop
y
of
the
Author
Interactive contour delineation of organs at risk in radiotherapy:
clinical evaluation on NSCLC patients
J. Dolz∗
AQUILAB, Loos-les-Lille, France. and
Univ. Lille, Inserm, CHU Lille, U1189 - ONCO-THAI - Image
5
Assisted Laser Therapy for Oncology, F-59000 Lille, France H.A. Kiri¸sli
AQUILAB, Loos-les-Lille, France.
T. Fechter, S. Karnitzki, O. Oehlke, and U. Nestle Department of Radiation Oncology,
10
University Medical Center, Freigburg, Germany. M. Vermandel
Inserm Onco Thai U1189, Universit´e Lille 2, CHRU Lille, Lille, France. L. Massoptier
AQUILAB, Loos-les-Lille, France
15
Personal
Cop
y
of
the
Author
Abstract
Purpose: Accurate delineation of organs at risk (OARs) on computed tomography (CT) image is required for radiation treatment planning (RTP). Manual delineation of OARs being time con-suming and prone to high inter-observer variability, many (semi-) automatic methods have been
20
proposed. However, most of them are specific to a particular OAR. Here, an interactive computer-assisted system able to segment various OARs required for thoracic radiation therapy is introduced.
Methods: Segmentation information (foreground and background seeds) is interactively added by the user in any of the three main orthogonal views of the CT volume and is subsequently prop-agated within the whole volume. The proposed method is based on the combination of watershed
25
transformation and graph-cuts algorithm, which is used as a powerful optimization technique to minimize the energy function. The OARs considered for thoracic radiation therapy are the lungs, spinal cord, trachea, proximal bronchus tree, heart and esophagus. The method was evaluated on multivendor CT datasets of 30 patients. Two radiation oncologists participated in the study and manual delineations from the original RTP were used as ground truth for evaluation.
30
Results: Delineation of the OARs obtained with the minimally interactive approach was approved to be usable for RTP in nearly 90% of the cases, excluding the esophagus, which segmentation was mostly rejected, thus leading to a gain of time ranging from 50% to 80% in RTP. Considering exclu-sively accepted cases, overall OARs, a Dice Similarity Coefficient higher than 0.7 and a Hausdorff distance below 10mm with respect to the ground truth were achieved. In addition, the
inter-35
observer analysis did not highlight any statistically significant difference, at the exception of the segmentation of the heart, in term of Hausdorff distance and volume difference.
Conclusions: An interactive, accurate, fast and easy-to-use computer-assisted system able to segment various OARs required for thoracic radiation therapy has been presented and clinically evaluated. The introduction of the proposed system in clinical routine may offer valuable new
40
option to radiation oncologists in performing RTP.
Keywords: radiotherapy; treatment planning; lung cancer; thoracic oncology; organs at risk segmentation; auto-contouring
Personal
Cop
y
of
the
Author
I. INTRODUCTIONLung cancer is the leading cause of cancer-related mortality in both men and women
45
worldwide, causing 1.56 million deaths annually [1]. Common treatments include surgery, chemotherapy and radiotherapy (RT). While surgery is the standard treatment for non-small-cell lung cancer (NSCLC), non-small-cell lung cancer (SCLC) usually responds better to chemotherapy and radiotherapy. However, when surgery is not an option in NSCLC cases due to issues with patient’s health or for patient refusing surgery, stereotactic body RT
50
(SBRT) becomes an alternative to treat very early stage lung cancers. Indeed, SBRT for early stage and medically inoperable NSCLC doubled overall survival rates, as compared to conventional radiation treatment [2].
SBRT involves the delivery of a single high dose radiation treatment or of a few frac-tionated lower dose radiation treatments. Clinical outcome of SBRT can potentially be
55
improved by maximizing target control while minimizing dose to surrounding tissue. Satis-fying the requirements of target dose distribution is essential. However, too large irradiated volume or too high dose to OARs must also be avoided. This requires knowledge on the shape and location of the tumor and involved organs at risk (OARs). Although CT imag-ing is the most widely used imagimag-ing modality for diagnosis, clinical studies and treatment
60
planning, the identification and outlining of organs at risk and target volumes in CT im-ages are among the most time-consuming steps carried out by human experts and prone to inter-observer variation [3, 4]. This variability can directly influence on the quality of the radiation treatment planning (RTP), and especially the dose distributed to the OARs [5]. Thereby, accurate delineation of the OARs is a key step in the RTP workflow.
65
Despite the extensive number of methods proposed during the last decades to support OARs segmentation [6–9], delineation still remains challenging. Particularly in some cancer cases, such as NSCLC, delineation still prevails fully manual in some OARs [10]. In fact, the constantly growing number of different objects of interest, the variations of their prop-erties in images and the use of different medical imaging modalities prevent from using a
70
general and unique solution [11]. Segmentation approaches substantially differ in terms of sophistication and amount of required user inputs. According to the extent of user interac-tion, segmentation techniques can be categorized into: manual, automatic or semi-automatic methods. Manual approaches allow users to manually outline structures using some
soft-Personal
Cop
y
of
the
Author
ware package. Although they might be more accurate than the other techniques, this task
75
is time-consuming and prone to observer variability. Contrary to manual approaches, fully automatic approaches require no user participation to perform the segmentation. These methods often employ some sort of prior knowledge from the anatomy to be segmented to achieve the segmentation. Prior information is typically provided as anatomical atlases [12] or statistical shape models [13]. Even though sophisticated automatic segmentation
algo-80
rithms have been developed, they often fail to achieve clinically acceptable results [9] and consequently few of them can fulfill the necessities of applications in terms of accuracy and efficiency.
The third category of segmentation methods -referred to as being semi-automatic or (semi-) interactive- are becoming more and more popular to solve most of the problems
85
inherent to fully automatic segmentation techniques. In these approaches, the user provides information on what has to be delineated; the rest of the image is subsequently automatically segmented.
Interactive approaches have already been proposed to segment medical images [14–17]. Hu et al [15] presented a method to segment the liver on CT images by combining interactive
90
expert user guidance through a probabilistic framework and a fast graph partition algorithm for volumetric image segmentation. The user indicated samples of object and background tissue by loosely drawing a few brush strokes on the image, which provided statistical input for a Conditional Random Field (CRF) based segmentation. In the work of Hu et al [16] an interactive contour delineation approach that used a CRF framework was proposed to
95
reduce the time and effort required from the users. After an initial segmentation on a CT slice, simple brush strokes for the target organ and non-target pixels had to be drawn. The approach automatically calculated statistics from this information to determine the parame-ters of an energy function containing both boundary and regional components. The method used a CRF graphical model to define the energy function to be minimized to obtain an
100
estimated optimal segmentation. More recently, Bernard et al. [17] presented a classifica-tion scheme that was able to segment up to 23 organs or objects on 2D slices of CT images of breast-cancer patients. A watershed filter converted the 2D CT slices into superpixels. Then, two kind of superpixel features were computed (i.e intrinsic and extrinsic), which were then fed into a classification model based on machine learning techniques.
105
Personal
Cop
y
of
the
Author
clinical practice, OARs delineation on medical images is still performed without or with very few machine assistance [9]. OARs are generally manually delineated by clinicians or Radiation Therapy Technologists (RTTs) in 2-dimensional (2D) slices using simple drawing tools. The delineation task is therefore time-consuming and tedious, particularly for multiple
110
OARs. Since availability of experts for delineation might be sometimes limited, contouring could represent a blocking step in the flowchart of the RTP. To the best of our knowledge, no single method allowing the segmentation of all required -and some recommended- OARs for thoracic radiation oncology has been presented yet. Consequently, the introduction of an interactive computer-aided system able to segment all necessary OARs may offer valuable
115
new options to RTTs and radiation oncologists in performing the OARs delineation task, and optimize RTP workflow.
The purpose of the current study is to present and evaluate an interactive framework for OARs segmentation in thoracic oncology. The proposed method is based on the combination of watershed transformation and graph-cuts algorithm, which is used as a powerful
optimiza-120
tion technique to minimize the energy function. The main contributions of this work are: (i) a single approach allowing the segmentation of all required- and some recommended- OARs for thoracic radiation therapy, (ii) a simple, intuitive and fast segmentation method, (iii) and an extensive evaluation of the proposed segmentation approach to assess its accuracy and robustness. This work is an extension of the work of Dolz et al. [18, 19]: additional
125
OARs considered for RTP in thoracic oncology are segmented, a larger number of patients is included in the evaluation, and a more extensive quantitative and qualitative evaluation is performed.
II. METHOD
The proposed interactive framework to segment OARs in CT images consists of two steps:
130
1) manual definition of input information by the user (details given in Section II C), and 2) subsequent automatic segmentation using input provided information. (Figure 1).
Personal
Cop
y
of
the
Author
Figure. 1. Workflow of the proposed framework to segment OARs.
A. Graph-cuts approach
Graph cuts (GC) based segmentation approaches have arisen as a powerful optimization framework to solve segmentation problems. The success of graph cut based minimization
135
algorithms in solving many low level vision problems has notably increased the popularity of such approaches. Even for formulations where its use does not guarantee to provide the optimal solutions, graph cuts can be used to find solutions that represent strong local
min-Personal
Cop
y
of
the
Author
ima of the energy. Thus, the image segmentation problem can be formulated in terms of minimizing a function, which is usually called the cost or energy function. This
minimiza-140
tion task is performed by using a standard minimum cut/maximum flow algorithm, where the minimum will be the best solution found for the defined problem [20]. As the work of Boykov et al. [20] has shown, graph cuts approach addresses segmentation in such global optimization framework and guarantees an optimal solution for a wide class of energy func-tions that can be, moreover, extended to N-Dimensional images. Generally, required input
145
information is interactively added by the user [20, 21]. Due to the performance and the minimal user interaction required, GC based techniques represent one of the state-of-the-art methods in semi-automatic segmentation approaches.
In GC approaches, a graph G = h V, ε i is constructed from the image information, where V represents the set of all nodes of the graph and ε is the set of all arcs or edges connecting
150
adjacent nodes. Commonly, either pixels or voxels are used as nodes of the graph, and the chosen connectivity criteria defines the way in which these nodes are connected in the graph [20]. However, the creation of the graph is not always straightforward. With the large images used nowadays in clinical routine, the high computational cost of applying graph cuts directly over the entire image can be detrimental to the level of interactivity experienced by
155
the user. Hence, if the graph vertices are placed at each image voxel, the number of nodes in the graphs exponentially increases with the image size; and consequently, the computation time to solve the problem dramatically increases. Therefore, pre-partitioning the image into small connected regions is a way to accelerate computations.
B. Problem formulation
160
1. Watershed Image Transformation
The watershed image transformation is motivated from a simple physical principle in geography: a drop of water falling over a topographic surface follows the greatest slope until reaching either a valley or another body of water [22]. In the watershed image transforma-tion, an image represents a topographic surface. On this surface the different altitude values
165
represent image gray levels, being the brightest pixels the highest altitudes, and the darkest pixels representing the lowest altitudes. Hence, when a set of similar pixels falls into the
Personal
Cop
y
of
the
Author
same valley, it forms what is known as basin, which is separated from other basins by the watershed lines. Each of these basins corresponds to the homogeneous segmented regions of the image.
170
Figure. 2. Result of applying the watershed transformation with set-up parameters that lead to over-segmentation(b) to a CT scan (a).
The watershed algorithm applies these ideas to gray-scale image processing in a way that it can be used to solve a variety of image segmentation problems. Its use has been already proposed as a region-based segmentation approach in the medical domain [23, 24].
2. Graph creation
Similar to Li et al [25], an unsupervised watershed transform of the morphological
gra-175
dient of the original CT image, which leads to an over-segmentation (Figure 2), is used to build a region adjacency graph. The watershed transformation allows obtaining a partition of an image comprising small and numerous homogeneous regions. Hence, this step will group pixels of similar intensities in uniform labels or regions, while preserving important contours during the segmentation. These homogeneous regions will be used as input for the
180
creation of the graph in a latter step (Figure 3).
The main motivations to choose the watershed pre-segmentation as input of the graph are that i) it improves the speed of the computation of the graph solution, while ii) it preserves the boundaries of the objects [25]. The segmentation problem is therefore formulated as a binary label problem, where the goal is to assign a unique label li ∈ 0,1 to each watershed
Personal
Cop
y
of
the
Author
Figure. 3. Taking as example a region of the watershed transformation shown in Fig.2 (left) the graph creation by using watershed regions as graph nodes is shown (right). Dark gray region represents a node of the graph, which is connected with its adjacent regions, in brighter gray.
region xi. In this context, 0 represents background while 1 means foreground. Accordingly, the resulted segmentation X is computed by minimizing an energy function of the type [20]:
E(X) =X i∈ν E1(xi) + λ X (i,j)∈ε E2(xi, xj) (1)
To construct the graph representing the energy E in (1), each watershed region xi is con-sidered as a graph node, in addition to the two terminal nodes representing the foreground
190
and the background. The regional term E1, also known as likelihood energy, represents the cost of assigning the watershed region xi to be either the background or the foreground. It is calculated by connecting each region xi to both terminal nodes with non-negative edge weights. These weights represent the likelihood of xi of belonging to either foreground or background. To compute the intensity models for each object, the mean intensity value,
195
Ix, of each watershed region introduced as foreground or background seeds is taken into consideration.
The second term in Equation (1), E2, comprises the boundary properties of the segmen-tation, and represents the penalty for a discontinuity between two adjacent regions xi and xj, which are connected to the neighborhood according to the chosen connectivity criteria.
200
This value is usually large when regions xi and xj have similar intensities and close to 0 otherwise. For convenience, pairs of neighboring regions are connected by weighted edges that are called n-links. The current implementation sets the boundary penalties between two neighbor regions, through a n-link, as follows:
Personal
Cop
y
of
the
Author
B{i,j} ∝ exp − (Ii− Ij)2 2σ2 ! · 1 dist (i, j) (2) 205where dist is the distance between adjacent regions (usually in number of pixels or voxels) and σ can be viewed as camera noise. Equation 2 highly penalizes for discontinuities between regions with similar mean intensities, i.e. kIi− Ijk < σ. Otherwise, when kIi− Ijk > σ, the boundary penality is small. As labels have no homogeneous and regular shapes, connectivity criteria simply follows adjacency connectivity. This means that as long as two regions are
210
adjacent, they are considered as neighbors. Additionally, the term dist(i,j) was set to 1 in this experiment. At last, the coefficient λ in Equation (1) weights the relative importance of the region properties term E1 versus the boundary properties term E2. A detailed explanation of how to compute all these terms is presented in the work of Dolz et al. [18].
C. SUMMER-prototype
215
The proposed prototype was developed as an independent plug-in on the MITK platform [26], version 2013.09.0. MITK platform is a medical imaging and interaction toolkit. It is implemented as a part of the SUMMER (Software for the Use of Multi-Modality images in External Radiotherapy) project prototype [27]. A preliminary evaluation on the performance of the proposed prototype has been already investigated [18, 19]. However, this previous work
220
did not include a relevant set of OARs involved in the RTP, and evaluation was conducted on a shorter dataset.
The workflow of the proposed framework to segment OARs is shown in Figure 1. As semi-automatic method, initialization requires some sort of participation from the user’s side. This interactive process takes the form of brushing voxels, constraining them either
225
to be part of the foreground or the background. These voxels can be either contained on a contiguous region or split into several separated spots. By employing these brush strokes, it is typically sufficient to roughly brush just a part of the foreground and some parts of the background (Fig. 4). Note that in this work, the term foreground refers to the OARs, whereas the term background invokes to the rest of non-interesting regions. Once the user is
230
satisfied with the information given to the prototype, the automatic process can be initiated. During this stage, the input image is initially pre-segmented by employing the watershed transformation (Section II B 1). To compute the watershed image transformation, a gradient
Personal
Cop
y
of
the
Author
anisotropic diffusion filter is applied on the input CT image. The idea of applying this filter is to smooth the original CT image and then perform some sort of edge calculation based on
235
gradients and curvatures. Image smoothing is achieved by employing an anisotropic diffusion that uses the classic Perona-Malik diffusion technique [28]. One of the benefits of using this diffusion method against other approaches is that it reduces image noise without removing significant parts of the image content, such as edges or lines. The resulted gradient of the anisotropic diffusion is then used as input of the watershed transformation. To control the
240
result of the watershed transformation, two parameters must be tuned: level and threshold. While level controls the depth of the watershed, threshold controls the lower thresholding of the input image. Since the goal of this step is to achieve an over-segmentation of the input image, level and threshold are set to 0.001% and 0.0001% of the maximum depth in the input image, respectively. The watershed implementation found in the ITK Software
245
[29] was employed in this step.
Next, watershed labels are used to create the graph (Section II B 2). At the end of the automatic process, graph cuts approach (Section II A) is applied over the graph to compute the segmentation. Once the segmentation is done, the user can inspect the result. If the segmentation is unsatisfactory, foreground and/or background seeds can be modified and
250
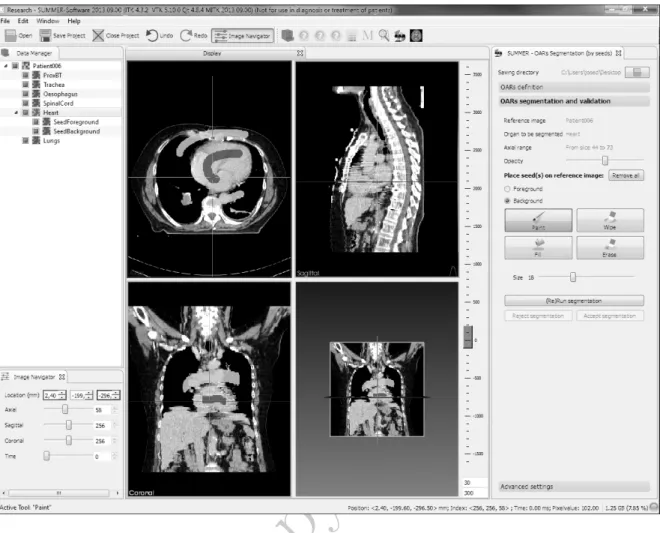
the algorithm will be run again. Modification of seeds implies adding and/or removing total or partially these seeds. Unlike most of the interactive solutions proposed to medical image segmentation, the presented prototype allows users to draw strokes in any of the three views, making the interactive task often easier and more comprehensive. Figure 4 shows a screenshot of the OARs SUMMER-MITK prototype.
255
III. MATERIALS
A. Organs at risks in thoracic radiation oncology
In thoracic radiation oncology the critical normal structures (Organs at Risk) that are at risk to receive a significant radiation dose are: spinal canal; lungs; trachea; proximal bronchus tree; heart and pericardium; and esophagus [30]. For the case of the trachea
260
segmentation, only the cavity segmentation was taken into account when comparing with our approach.
Personal
Cop
y
of
the
Author
Figure. 4. Screenshot of the SUMMER-MITK plug-in to segment OARs in radiotherapy. Dark gray brush strokes represent foreground -in this case, the heart- seeds, while bright gray strokes are the seeds belonging to the background. An interesting feature of this tool is that it allows to draw the seeds in any of the three planes.
B. Datasets
The proposed method was evaluated on a cohort of 30 (15 male, 15 female) patients aged [51-84] years old. Thirty patients with early stage NSCLC or pulmonary metastases
265
received SBRT and those with locally advanced NSCLC received conventionally fractionated radio(chemo)therapy (CFRT)(Table I). Segmentation was performed on the planning CT which was acquired for 6 patients with a Siemens Emotion CT scanner, for 21 patients with a Philips GEMINI TF Big Bore CT scanner and for 3 patients with a Philips Brilliance Big Bore CT scanner. Image resolution and voxel size for the different scanners are reported in
270
Personal
Cop
y
of
the
Author
Treatment SBRT CFRTEarly NSCLC Metastases Advanced NSCLC
Number of Patients 9 4 17 Stages cT-stage T1 T2 7 2 Tx T0 2 2 T1 T2 T3 T4 3 5 6 3 cN-stage N0 9 N0 4 N0 N1 N2 N3 0 3 10 4 cM-stage M0 M1 9 0 M0 M1 0 4 M0 M1 17 0 TABLE I. Pathologies of the included NSCLC patients.
Resolution (pixel) Voxel size (mm) [min-max]
x y z (Range) x y z Siemens Emotion 512 512 53-138 0.686-0.977 0.686-0.977 3-5 Philips GEMINI TF Big Bore 512 512 86-152 0.897-1.172 0.897-1.172 3 Philips Brilliance Big Bore 512 512 118-132 0.885-0.977 0.885-0.977 3
TABLE II. Scanners used and characteristics of images used in the current experiment.
Average contouring time in clinical routine was indicated to range from 40 minutes up to 70 minutes, in anatomically challenging cases. Total time is divided into the following steps: 5-10 minutes to manually delineate the heart; 5 minutes to inspect automatically pre-contoured lungs and if adjustments are required, this can eventually take 10 more
min-275
utes; manual segmentation of the trachea takes around 5 minutes; manual segmentation of proximal bronchus tree takes nearly to 10 minutes; 5 minutes to inspect automatically pre-contoured spinal canal and if adjustments are required, 10 additional minutes are often required; and the esophagus delineation takes, on average, between 10-15 minutes.
Personal
Cop
y
of
the
Author
IV. EXPERIMENTS 280 A. Evaluation experimentsThis study was conducted at the Department of Radiation Oncology, University Medical Center, Freiburg, Germany. Two physicians with experience in treatment planning were invited to participate in this evaluation.
Nowadays, in clinical routine, delineation is mostly done manually. This means that no or
285
few machine assistance is available to carry out this task. Due to this, physicians involved in the presented experiment were not familiar with the presented prototype and a short training on how the tool must be used was therefore given before to start the experiment. In addition, to constrain the number of iterations the users could carry out, a maximum of five seeds modifications were allowed. During the seeds modification process the user was
290
able to add, modify or suppress an unlimited number of seeds, although the trend was to add only few of them (Figure 4). Each time seeds were modified and the tool was run again is referred to as one iteration. If the obtained results were satisfactory before the maximum number of iterations, the segmentation was considered as accepted. On the other hand, if the users reached the maximum number of iterations with no success on the contours, the
295
segmentation was simply annotated as rejected.
B. Evaluation measures
Qualitative evaluation and acceptability. Participants subjectively evaluated the accuracy of the semi-automatic contours. After running the algorithm, they inspected the contours and decided whether they were satisfactory or further modifications were needed. If they
300
were satisfied with the result, the contour was accepted. If the maximum number of iterations was reached prior to the obtention of acceptable segmentation results, the contour was then rejected. For the accepted contours, the number of iterations used to achieve that segmentation was recorded.
Quantative evaluation. The semi-automatic segmentations are compared to manual
seg-305
mentations outlined by an expert radiologist which are used in clinical routine for RTPs. Three common metrics are computed: Dice similarity coefficient (DSC) [31], Hausdorff dis-tances(HD) [32] and average volume differences.
Personal
Cop
y
of
the
Author
The DSC(X,Y) is defined as the ratio of twice the intersection over the sum of the two segmented results, X and Y :
310
DSC = 2 | VexpertT Vauto| | Vexpert | + | Vauto|
(3) where Vexpertis the expert delineation, and Vautois the result segmentation of the proposed approach. The DSC measure varies between [0-1], where 1 indicates perfect overlapping and 0 represents not overlapping at all. To measure volume differences between manual and automatic contours with the ground truth, the following formula is used
315
∆V (%) = Vauto− Vexpert Vexpert
∗ 100 (4)
where Vexpert represents the expert or reference delineation, and Vauto is the outcome of the proposed segmentation approach.
Statistical volumetric measures, such as DSC, can give a good estimate of expert agree-ment; however, it is insensitive to the exact position of errors in the segmentation.
Eval-320
uation of the accuracy of the boundary from contour delineation is particularly important to RTP, as it affects the reliability of the treatment plan in limiting dose to normal tissues. To measure how far the two surfaces are from each other, HD is used. In particular, HD computes the distance between the set non-zero pixels of two input images, X and Y, using the following formula:
325
H(X, Y ) = max(h(X, Y ), h(Y, X)) (5)
where
h(X, Y ) = maxx∈Xminy∈Y k x − y k (6)
X and Y represent respectively the set of non-zero pixels in the first and second input images.
V. RESULTS
330
A. Qualitative
The quality of the contours of the OARs (excluding the esophagus) generated with our semi-automatic approach was satisfactory, i.e. sufficiently accurate to be clinically usable
Personal
Cop
y
of
the
Author
Figure. 5. Acceptance rate of the semi-automatic contours generated by the proposed prototype are shown on the left. On the right, mean number of iterations per organ for the clinically accepted contours are displayed. ∗ Since the segmentation of the esophagus was completely unsuccessful, its rejection rates were not taken into account.
for RTP, in more than 75% for each OAR and each observer(Figure 5, left). On average, they represented the 89.7% of all the contours generated and analyzed at exception of the
335
esophagus. Regarding the number of iterations needed to achieve satisfactory results, mean value between 1.2 and 2.2 were reported (Figure 5, right). The heart represented the most difficult structure to segment (2.52 iterations, observer 1), while the lung, the spinal canal, the trachea segmentations were the easiest to perform (1-1.2 iterations, observer 2), on aver-age. Considering the number of iterations for the esophagus segmentation is not applicable
340
since results were unsatisfactory in all the patients.
It is important to note that in the analysis made from the two previous figures, the esoph-agus segmentation information has not been taken into account. The reason is because the automatic segmentation for this structure failed most of the time. Merging, therefore, this information with the performance of the rest of the organs is meaningless. As a
conse-345
quence, results for the esophagus have not been further analyzed due to low acceptance rates. However, its failure will be analyzed in the discussion part.
Personal
Cop
y
of
the
Author
B. QuantitativeIt is generally accepted in medical image segmentation that a DSC value greater than 0.7 is recognized as good agreement [33]. More than 90 % of the semi-automatic contours
350
for all the OARs met this requirement on the accepted reported cases, with exception of the esophagus. Figure 6 shows the Dice coefficients for the semi-automatic contours of the five OARs under examination. Mean DSC values for observer 1 were 0.86 [0.80-0.94] for the heart, 0.97 [0.94-0.98] for lungs, 0.72 [0.65-0.88] for proximal bronchus tree, 0.82 [0.68-0.90] for spinal canal, 0.88 [0.76-0.98] for the trachea. For observer 2 the following DSC values
355
were reported: 0.91 [0.83-0.94] for the heart, 0.97 [0.94-0.98] for lungs, 0.74 [0.69-0.89] for proximal bronchus tree, 0.85 [0.82-0.90]for spinal canal, 0.85 [0.78-0.96] for the trachea.
Heart Lungs Prox BT Spinal canal Trachea 0 0.1 0.2 0.3 0.4 0.5 0.6 0.7 0.8 0.9 1
DSC with respect to the manual contours
Dice Similarity Coefficients Obs 1 ALL Contours Obs 1 Accepted Contours Obs 2 ALL Contours Obs 2 Accepted Contours
Figure. 6. Dice Score coefficients of all the semi-automatic OARs segmentations with respect to the manual standard contours. Dice score coefficients for both all and only accepted segmentations are shown.
Personal
Cop
y
of
the
Author
Figure. 7. Hausdorff distances of the accepted semi-automatic OARs segmentations (left) and percentage of volume differences with respect to the manual standard contours.
Although DSC values reported were often satisfactory, maximum Hausdorff distances of semi-automatic contours were sometimes quite high (Fig 7, left). In particular for the heart, a mean HD of 15.7 mm and 12.3 mm has been reported for each observer. These high HD
360
distances were most often due to the segmentation failure of the inferior part of the heart, where the boundary between the heart and the liver is often fuzzy, e.g. in situations of low-contrast between organs. Figure 8 presents three cases of heart segmentation, accepted as usable for the RTP by the experts. In situations where some -even low- contrast exists between the inferior part of the heart and the liver (Fig. 8a), contours obtained using
365
our interactive approach were close to the ones from the ground truth, resulting therefore in low HD values. However, in situations where no contrast thus no visible boundaries - exists (Fig. 8b and Fig. 8c), contours obtained using our interactive approach were more distant from the reference ones, leading to a high values of HD. For lungs, prox BT and the spinal canal segmentations, results reported mean HD values in the range of 5-10
370
mm. On the other hand, semi-automatic segmentation of the trachea provided mean HD values close to 3 mm. Volume distributions of the accepted semi-automatic contours for each of the organs investigated are plotted in figure 7, right. First thing we note is that mean values of the distribution for each of the organs fall in the range of -20% to 20% with respect to manual contours, which may be considered a priori as acceptable. Average
375
[-Personal
Cop
y
of
the
Author
14.96,27.56], -8.75 [-28.47,13.16] and 2.60 [-11.87,35.94] for the heart, the lungs, the proximal bronchus tree, the spinal canal and the trachea. In the same order, mean volume differences of 2.32 [-10.94,35.78], -1.94 [-7.21,2.74], 10.50 [-28.51,33.09], -2.22 [-19.93,16.02] and -0.80 [-14.31,20.30] were reported for observer 2.
380
Figure. 8. Visual examples of several heart segmentation cases accepted as usable for the RTP. Bright gray contour represents the manual reference standard and dark gray contour is the gener-ated by the semi-automatic tool.
In order to evaluate the robustness of the proposed system, as well as to investigate whether spending more time on the interaction side improves the segmentation, a within patient ANOVA analysis between the two observers was performed for all the computed metrics. To conduct this analysis all the semi-automatic segmentations were taken into account, independently of whether they were accepted or not. Outcomes from the statistical
385
analysis are presented in Table III. It is shown that with exception of the Hausdorff distances and volume differences for the case of heart segmentation (p<0.05), the analyzed metrics did not show significant statistical differences between observers 1 and 2 across the different groups.
Personal
Cop
y
of
the
Author
p-valuesDSC Hausdorff Distances Volume Differences
Heart 0.2334 0.0451 0.0018
Lungs 0.4605 0.7045 0.7583
Prox BT 0.1198 0.5112 0.3078
Spinal canal 0.1630 0.5389 0.2643
Trachea 0.4804 0.6125 0.9384
TABLE III. Statistical analysis between the semi-automatic contours generated by the two ob-servers.
Heart Lungs Prox BT Spinal canal Trachea 0 50 100 150 200 250 300 350 Time (seconds)
Whole segmentation times
Manual user interaction observer 1 Automatic processing step observer 1 Manual user interaction observer 2 Automatic processing step observer 2
Figure. 9. Mean segmentation times of the semi-automatic contours reported in this evaluation for each of the OARs. The whole time is split into manual (light part) and automatic (dark part) times. Manual time comprises the time spent to add/modify input seeds whilst automatic time is the total time employed by the algorithm to achieve the segmentation (one or multiple iterations).
Mean segmentation times are shown in Figure 9. The whole segmentation process was
390
performed in each patient by observer 1 in 12 minutes and 55 seconds, on average. Observer 2, however, employed a mean time of 19 minutes and 3 seconds to perform the same task. This time includes both the automatic segmentation process and the interactive process in which the user participates (Figure 1). On the other hand, the manual interactive process time refers to the time the user really performed some actions during the segmentation
395
Personal
Cop
y
of
the
Author
In terms of users’ interaction, mean participation time per patient was reported to be of 7 minutes and 51 seconds, and 14 minutes and 32 seconds, for observer 1 and 2, respectively. Manual interaction on heart was the longest task among the OARs with accepted segmen-tations on both observers, in terms of user’s participation, according to Figure 9. Contrary,
400
segmentations of spinal canal did not require such an effort. It is important to notice differ-ences on the user participation between both observers. Manual participation from observer 2 was in all the cases nearly double than in observer 1. However, taking into account the statistical analysis (Table III), no statistical differences between observers was reported and only marginal improvements were achieved by observer 2, as indicated by figures 6 and 7.
405
According to manual segmentation times detailed in Section III B, the task is usually performed for all the OARs (at the exception of the esophagus) in a range from 30 to 55 minutes. The use of the proposed approach represented a gain of time between 64-73% with respect to the manual segmentation, as average. This gain was relatively larger for the trachea and proximal bronchus tree segmentations, where the semi-automatic approach
410
achieved the task around 75% faster than the manual process. If pre-segmented clinical contours for spinal canal and lungs are accepted, our method improves the segmentation time by nearly 50% (See Section III B, paragraph 2 to see typical segmentation times in RTP). However, if adjustments are required from the pre-clinical contours we can say that our method achieves the segmentation task in roughly 20% and 30% of the time that would
415
have been employed in clinical routine for spinal canal and lungs, respectively.
VI. DISCUSSION
A prototype for minimally interactive segmentation of the OARs in RTP, using a hybrid approach combining watershed and graph cuts, has been presented and evaluated. Mini-mization of user interaction required by semi-automatic segmentation methods plays a key
420
role in the workflow of RTP. Our prototype minimizes such interaction by allowing users to coarsely indicate inner and outer regions at few locations in the volume instead of precisely tracing lines close to the object boundaries in a large number of locations throughout the volume. Although the evaluation has been done on NSCLC patients, the use of this tool can be extended to thoracic radiotherapy in general.
425
Personal
Cop
y
of
the
Author
often fail to achieve clinically acceptable results. Additionally, although several works have contributed with approaches to segment different of these critical structures, they are often organ dependent and therefore limited to work in merely one or very few structures, which makes them usable only in certain situations. The results of our evaluation demonstrate that
430
our prototype, however, is able to successfully segment a set of OARs typically included in the RTP of thoracic oncology, at the exception of the esophagus. Although segmenting the inferior part of the heart was not always quantitatively successful using the proposed approach, in most of the cases the generated contours were judged as being satisfactory by the experts, and therefore considered as qualitatively successful. The proposed approach
435
successfully allowed the delineation of organs having low-contrast with surrounding tissues, such as part of the spinal canal, as presented in Figure 10. We can thereby say that, up to our knowledge, this is the first work which evaluates the performance of an approach to segment all OARs required for RTP of thoracic oncology, particularly NSCLC.
Figure. 10. Axial slice of a CT volume, presenting low-contrast (left), making the delineation of the spinal canal challenging. Ground truth delineation (white) and generated interactive delineation (black) are presented (right).
Nevertheless, segmentation of the esophagus on CT images is still a challenging task,
440
mainly due to its low contrast and versatile appearance. While it may appear sometimes solid, it can also occasionally be filled with air bubbles, remains of oral contrast agent or both. Furthermore, its walls consist of muscle tissue, which has low contrast in CT,
Personal
Cop
y
of
the
Author
particularly if the esophagus is empty. All this makes that it can easily be confused with vessels, muscles, or lymph nodes. Up to now, prior work on this topic is limited and all of the
445
proposed methods require a significant amount of user input, as well as prior information. For example, in Kurugol et al ’s method [34], relative spatial location of esophagus centers with respect to neighboring structures was learned during a training phase. In addition to this information, a combination of the level-set function with a prior shape was used to locate the esophagus in all the slices. Contrary to methods using prior knowledge, the
450
proposed approach creates the organs models based on intensity properties and uses no prior information. However, as explained above, the esophagus shares a wide range of intensity values with its neighbor structures. Thus, although the presented tool has shown to work in situations where very similar texture values are shared by the organ and the background, in cases where no visible boundaries are present it might fail, like in the segmentation of the
455
esophagus.
Automatic segmentation results have been validated by physicians, and almost 90% of these contours were approved for being usable in RTP. With exception of the esophagus, all the OARs presented high acceptance rate (Figure 6) with most DSC values above 0.7. Although there have been some approaches that outperform the presented system when
seg-460
menting single OARs, results from evaluation show that our approach is able to successfully segment several OARs.
Results demonstrate that the presented prototype might be introduced in clinical routine with the final goal of assisting RTTs and radiation oncologists in the OARs delineation process. Although automatically generated contours must be approved, and sometimes
465
modified, by experts prior to be used in clinical practice, in a high percentage of cases semi-automatic contours generated by our approach were accepted with no manual adjustment. Taking into consideration a single OAR, for instance the spinal canal, manual contouring typically requires between 5-15 minutes, while interactive segmentation (by observer 1) required less than 2 minutes, therefore leading to an improvement of 60%-80% in this case.
470
More generally, and according to the results, for the set of OARs analyzed this led to a gain of time that ranged from 50% up to nearly 80% as compared to the manual time, for single OAR delineation.
Last, as the performance of the segmentation approach - and particularly in very low-contrast areas - is dependent on the input seeds provided by the user, some performance
Personal
Cop
y
of
the
Author
differences between observers were noticed in this study. In fact, in this study and as indicated in Section IV.A, solely a brief training was provided to the users prior to take part in the evaluation. Therefore, due to their lack of knowledge on how to efficiently position the input seeds, additional iteration(s) made in the interactive process, i.e. modification of seeds, did not particularly improve their segmentation performance, nor did it improve over time
480
while analyzing more cases. It should therefore be noted that providing additional training to the user might allow a more efficient use of the interactive computer-assisted system. These findings are supported by the work of Ramkumar et al. [35], in which dependencies between user interaction and segmentation performance of the proposed interactive approach, by use of two different interactions input (seeds vs. coarse contours) are investigated. Authors
485
highlight that, besides the performance of the algorithm, the quality of the segmentation also depends on the user and the human computer interaction process. Furthermore, they disclosed that the interactive segmentation method employing seeds as input is more efficient, less cognitively demanding, and requires less effort, in comparison with the other analyzed method. We thus refer the reader to that work for further information regarding the usability
490
of the proposed interactive computer-assisted system.
VII. CONCLUSION
This work presented a prototype for interactive segmentation of the organs at risk in the radiation treatment planning of NSCLC. The proposed interactive tool has been clinically evaluated on a group of 30 patients. User interaction to achieve OARs segmentation has been
495
minimized by allowing users to coarsely indicate inner and outer regions in few locations in the volume. Results reported an acceptance rate of nearly 90% of all the generated contours, at the exception of the esophagus. Results demonstrated that, ideally, the introduction of such interactive prototype in clinical routine might represent a valuable tool for radiation oncologists and therapists to achieve the OARs delineation task in thoracic oncology.
500
Acknowledgments. This project has received funding from the European Unions Sev-enth Framework Programme for research, technological development and demonstration
Personal
Cop
y
of
the
Author
under grant agreement no PITN-GA-2011-290148.
[1] B.W. Stewart and C.P. Wild, “World cancer report 2014. international agency for research on cancer,” World Health Organization (2014).
505
[2] Y. Nagata, M. Hiraoka, T. Shibata, H. Onishi, M. Kokubo, K. Karasawa, Y. Shioyama, R. Onimaru, T. Kozuka, and S. Ishikura, “Stereotactic body radiation therapy for t1n0m0 non-small cell lung cancer: First report for inoperable population of a phase ii trial by japan clinical oncology group (jcog 0403),” International Journal of Radiation Oncology* Biology* Physics 84, S46– (2012).
510
[3] L. Lu, L. Cuttino, I. Barani, S. Song, M. Fatyga, M. Murphy, P. Keall, J. Siebers, and J. Williamson, “Su-ff-j-85: Inter-observer variation in the planning of head/neck radiother-apy,” Medical Physics 33, 2040–2040 (2006).
[4] C.L. Brouwer, R.J.H.M. Steenbakkers, E. van den Heuvel, J.C. Duppen, A. Navran, H.P. Bijl, O. Chouvalova, F.R. Burlage, H. Meertens, J.A. Langendijk, and A.A. van’t Veld, “3d
515
variation in delineation of head and neck organs at risk,” Radiation Oncology 7, 32 (2012). [5] B.E. Nelms, W.A. Tom´e, G. Robinson, and J. Wheeler, “Variations in the contouring of
organs at risk: test case from a patient with oropharyngeal cancer,” International Journal of Radiation Oncology* Biology* Physics 82, 368–378 (2012).
[6] W. De Gersem, F. Claus, C. De Wagter, and W. De Neve, “An anatomy-based beam
seg-520
mentation tool for intensity-modulated radiation therapy and its application to head-and-neck cancer,” International Journal of Radiation Oncology* Biology* Physics 51, 849–859 (2001). [7] J. Dowling, J. Lambert, J. Parker, J. Fripp, J.W. Denham, C. Wratten, A. Capp, C. Tang, P. Bourgeat, O. Salvado, and P.B. Greer, “Sci-sat am(1): Planning-05: Feasibility of atlas-based organ segmentation and electron density mapping for mri-atlas-based prostate radiation
ther-525
apy planning,” Medical Physics 37, 3907–3907 (2010).
[8] S. Ghose, A. Oliver, R. Mart´ı, X. Llad´o, J.C. Vilanova, J. Freixenet, J. Mitra, D. Sidib´e, and F. Meriaudeau, “A survey of prostate segmentation methodologies in ultrasound, magnetic res-onance and computed tomography images,” Computer methods and programs in biomedicine 108, 262–287 (2012).
530
Personal
Cop
y
of
the
Author
volumes: are we going in the right direction?” The British journal of radiology 86, 20110718– 20110718 (2013).
[10] L.J. Yin, X.B. Yu, Y.G. Ren, G.H. Gu, T.G. Ding, and Z. Lu, “Utilization of pet-ct in target volume delineation for three-dimensional conformal radiotherapy in patients with non-small
535
cell lung cancer and atelectasis,” Multidiscip Respir Med 8, 21 (2013).
[11] A.S. El-Baz, R. Acharya, A.F. Laine, and J.S. Suri, Multi modality state-of-the-art medical image segmentation and registration methodologies, Vol. 2 (Springer, 2011).
[12] M. Cabezas, A. Oliver, X. Llad´o, J. Freixenet, and M.B. Cuadra, “A review of atlas-based segmentation for magnetic resonance brain images,” Computer methods and programs in
540
biomedicine 104, e158–e177 (2011).
[13] T. Heimann and H.P. Meinzer, “Statistical shape models for 3d medical image segmentation: a review,” Medical image analysis 13, 543–563 (2009).
[14] S.D. Olabarriaga and A.W.M. Smeulders, “Interaction in the segmentation of medical images: A survey,” Medical image analysis 5, 127–142 (2001).
545
[15] Y. Hu, M. Grossberg, and G. Mageras, “Th-d-332-02: Semi-automatic medical image segmen-tation with adaptive local statistics in conditional random field framework,” Medical Physics 35, 2990–2991 (2008).
[16] Y.C. Hu, M.D. Grossberg, A. Wu, N. Riaz, C. Perez, and G.S. Mageras, “Interactive semiau-tomatic contour delineation using statistical conditional random fields framework,” Medical
550
physics 39, 4547–4558 (2012).
[17] G. Bernard, M. Verleysen, and J. Lee, “Su-c-18a-03: Automatic organ at risk delineation with machine learning techniques,” Medical Physics 41, 101–101 (2014).
[18] J. Dolz, H.A. Kirisli, R. Viard, and L. Massoptier, “Combining watershed and graph cuts methods to segment organs at risk in radiotherapy,” in SPIE Medical Imaging (International
555
Society for Optics and Photonics, 2014) pp. 90343Z–90343Z.
[19] J. Dolz, H.A. Kirisli, R. Viard, and L. Massoptier, “Interactive approach to segment organs at risk in radiotherapy treatment planning,” in SPIE Medical Imaging (International Society for Optics and Photonics, 2014) pp. 90343S–90343S.
[20] Yuri Boykov and Gareth Funka-Lea, “Graph cuts and efficient nd image segmentation,”
In-560
ternational journal of computer vision 70, 109–131 (2006).
segmen-Personal
Cop
y
of
the
Author
tation of objects in nd images,” in Computer Vision, 2001. ICCV 2001. Proceedings. Eighth IEEE International Conference on, Vol. 1 (IEEE, 2001) pp. 105–112.
[22] S. Beucher and F. Meyer, “The morphological approach to segmentation: the watershed
trans-565
formation,” Optical Engineering-New York-Marcel Dekker Incorporated 34, 433–433 (1992). [23] W.F. Kuo, C.Y. Lin, and Y.N. Sun, “Brain mr images segmentation using statistical
ra-tio: Mapping between watershed and competitive hopfield clustering network algorithms,” Computer methods and programs in biomedicine 91, 191–198 (2008).
[24] F. L´opez-Mir, V. Naranjo, J. Angulo, M. Alca˜niz, and L. Luna, “Liver segmentation in mri:
570
A fully automatic method based on stochastic partitions,” Computer methods and programs in biomedicine 114, 11–28 (2014).
[25] Y. Li, J. Sun, C.K. Tang, and H.Y. Shum, “Lazy snapping,” in ACM Transactions on Graphics (ToG), Vol. 23 (ACM, 2004) pp. 303–308.
[26] I. Wolf, M. Vetter, I. Wegner, T. B¨ottger, M. Nolden, M. Sch¨obinger, M. Hastenteufel,
575
T. Kunert, and H.P. Meinzer, “The medical imaging interaction toolkit,” Medical image analysis 9, 594–604 (2005).
[27] SUMMER. Software for the Use of Multi-Modality images in External Radiotherapy., retrieved on 15/04/2015 from http://summer-project.eu/.
[28] P. Perona and J. Malik, “Scale-space and edge detection using anisotropic diffusion,” Pattern
580
Analysis and Machine Intelligence, IEEE Transactions on 12, 629–639 (1990).
[29] T.S. Yoo, M.J. Ackerman, W.E. Lorensen, W. Schroeder, V. Chalana, S. Aylward, D. Metaxas, and R. Whitaker, “Engineering and algorithm design for an image processing api: a technical report on itk-the insight toolkit,” Studies in health technology and informatics , 586–592 (2002).
585
[30] F.M. Kong, L. Quint, M. Machtay, and J. Bradley, “Atlas for organs at risk (oars) in thoracic radiation therapy,” (2013).
[31] L.R. Dice, “Measures of the amount of ecologic association between species,” Ecology 26, 297–302 (1945).
[32] D.P. Huttenlocher, G.A. Klanderman, and W.J. Rucklidge, “Comparing images using the
590
hausdorff distance,” Pattern Analysis and Machine Intelligence, IEEE Transactions on 15, 850–863 (1993).
Personal
Cop
y
of
the
Author
K. Bzdusek, and G. Rodrigues, “An evaluation of an automated 4d-ct contour propagation tool to define an internal gross tumour volume for lung cancer radiotherapy,” Radiotherapy
595
and Oncology 101, 322–328 (2011).
[34] S. Kurugol, G. Sharp, J. Dy, and D. Brooks, “Su-ff-i-86: Esophagus segmentation in thoracic ct images for radiotherapy planning,” Medical Physics 36, 2454–2454 (2009).
[35] A. Ramkumar, J. Dolz, H.A. Kirisli, S. Adebahr, T. Schimek-Jasch, U. Nestle, L. Massoptier, E. Varga, P.J. Stappers, W.J. Niessen, and Y. Song, “User interaction in semi-automatic
600
segmentation of organs at risk: a case study in radiotherapy,” Journal of digital imaging , 1–14 (2015).