HAL Id: hal-00703871
https://hal.archives-ouvertes.fr/hal-00703871
Submitted on 3 Jun 2021
HAL is a multi-disciplinary open access
archive for the deposit and dissemination of
sci-entific research documents, whether they are
pub-lished or not. The documents may come from
teaching and research institutions in France or
abroad, or from public or private research centers.
L’archive ouverte pluridisciplinaire HAL, est
destinée au dépôt et à la diffusion de documents
scientifiques de niveau recherche, publiés ou non,
émanant des établissements d’enseignement et de
recherche français ou étrangers, des laboratoires
publics ou privés.
Micro-Brillouin spectroscopy mapping of the residual
density field induced by Vickers indentation in a
soda-lime silicate glass
Trung Hieu Tran, Sebastien Clement, Remy Vialla, Damien Vandembroucq,
Benoit Ruffle
To cite this version:
Trung Hieu Tran, Sebastien Clement, Remy Vialla, Damien Vandembroucq, Benoit Ruffle.
Micro-Brillouin spectroscopy mapping of the residual density field induced by Vickers indentation in a
soda-lime silicate glass. Applied Physics Letters, American Institute of Physics, 2012, 100 (23), pp.231901.
�10.1063/1.4725488�. �hal-00703871�
arXiv:1203.3046v2 [cond-mat.mtrl-sci] 21 May 2012
Micro-Brillouin spectroscopy mapping of the residual density field induced by
Vickers indentation in a soda-lime silicate glass
H. Tran,1, 2
S. Cl´ement,1, 2
R. Vialla,1, 2
D. Vandembroucq,3, 4
and B. Ruffl´e1, 2,a)
1)Universit´e Montpellier 2, Laboratoire Charles Coulomb UMR 5221, F-34095,Montpellier,
France
2)CNRS, Laboratoire Charles Coulomb UMR 5221, F-34095, Montpellier, France
3)Laboratoire de Physique et M´ecanique des Milieux H´et´erog`ene, PMMH UMR 7636 CNRS/ESPCI/Paris 6/Paris 7,
10 rue Vauquelin, F-75231 Paris cedex 05, France
4)Laboratoire Surface du Verre et Interfaces, Unit´e Mixte de Recherche CNRS/Saint-Gobain, 39 Quai Lucien Lefranc,
F-93303 Aubervillers, France
High-resolution Brillouin scattering is used to achieve 3-dimensional maps of the longitudinal acoustic mode frequency shift in soda-lime silicate glasses subject to Vickers indentations. Assuming that residual stress-induced effects are simply proportional to density changes, residual densification fields are obtained. The density gradient is nearly isotropic, confirming earlier optical observations made on a similar glass. The results show that Brillouin micro-spectroscopy opens the way to a fully quantitative comparison of experimental data with predictions of mechanical models for the identification of a constitutive law.
Although mainly brittle, glasses can experience plastic deformation under high enough pressure or stress concen-tration (e.g. in the vicinity of a crack tip or below a sharp indenter). Not only plastic flow but also significant per-manent densification are observed at small scale (from a few percents for soda-lime silicates to about twenty per-cents for amorphous silica). These phenomena and their important consequences for the mechanical strength have early been recognized1–4, but for reasons which are both
theoretical and practical, the plastic behavior of glasses has long remained ill-understood. Indeed, the absence of a crystalline lattice does not allow using dislocations to explain plasticity. From the experimental side, the micrometer scale of the plastic zone makes difficult the measurements of deformations.
Recent theoretical, numerical, and technical develop-ments, however, led to significant advances. From the modeling side, the description of plastic deformation of glassy materials as resulting from a series of local rear-rangements of the amorphous structure5,6has induced an
intense numerical effort to simulate plastic flow at differ-ent time and length scales, see e.g. Rodney, Tanguy, and Vandembroucq7 for a recent review).
From the experimental side, the development in the field of instrumented nano-indentation8 has allowed to
quantitatively probe the micro-ductile behavior of oxide glasses9. The data gathered during such experiments are
unfortunately far too limited to unambiguously charac-terize the mechanical response of the glass. Indeed, nano-indentation load-penetration curves reflect only the inte-grated response over the entire indented area. It is thus highly desirable to develop innovative micro-mechanics experiments which aim to image for example the local strain state of the glass surface after an indentation test.
a)Electronic mail: Benoit.Ruffle@univ-montp2.fr
The comparison between such experimental data and fi-nite element calculations is then a much more severe cri-terion for the constitutive law validation.
It was recently shown that spatially resolved opti-cal spectroscopies can provide such information. Two-dimensional (2D) maps of the residual indentation-induced densification on a silica-sample surface were first obtained by Raman micro-spectroscopy using the D2
line shift of the Raman spectrum of silica as a density marker10. This Raman band originates from the
breath-ing of the three-membered rbreath-ings11specific to silica. The rich set of data provided by the densification maps was then used to validate a new constitutive law describing the plastic deformation of silica at the micron scale12.
More recently, Perriot et al.13 characterized the
resid-ual densified area of a Vickers indent on a soda-lime silicate glass surface, using Cr3+ luminescence
micro-spectroscopy. The 2D density map revealed nearly circu-lar iso-density contours, in sharp contrast with the star-shaped iso-density lines observed on silica10. Finite
el-ement calculations using the elastic-plastic constitutive equations developed for silica showed that the overall density gradient was well reproduced. On the other hand, the model clearly failed to describe the convex iso-density patterns found in the case of soda-lime silicate glass13.
To identify a more general constitutive law, it seems useful to investigate other spectroscopies which could ex-plore a wider range of glass compositions. To that ef-fect, we propose to use high resolution Brillouin micro-spectroscopy. 3-dimensional (3D) maps of the Brillouin frequency shifts in the area beneath a Vickers micro-indent were obtained in a soda-lime silicate glass, demon-strating the potential of the technique.
Brillouin light scattering (BLS) is defined as inelas-tic scattering of light in a medium by thermally excited acoustical phonons. BLS is widely used in material sci-ence for measuring the bulk elastic properties (acoustic velocities) of small transparent samples. For pure
back-2 32 33 34 35 36 0.0 0.5 1.0 1.5 32 33 34 35 36 Frequency Shift (GHz) 1 0 3 C o u n t s = 2.514 g/cm 3 B = 34.31 GHz (a) = 2.672 g/cm 3 B = 34.96 GHz (b)
FIG. 1. (Color online) Brillouin spectra of the longitudinal acoustic modes at room temperature in the backscattering geometry for a pristine soda-lime silicate glass (a), and af-ter a room-temperature hydrostatic compression at 20 GPa during 1 h (b). The dashed lines indicate the elastic peaks periodically transmitted.
ward Brillouin scattering in an isotropic medium, the measured Brillouin frequency shift δνB is related to the
refractive index n, the longitudinal sound velocity vL,
and the incident vacuum wavelength λ0, δνB= 2nvL/λ0.
vLis determined by the elastic properties and the density
ρ of the medium, vL=pM/ρ where M is the
longitudi-nal elastic modulus. Generally, all these parameters are not independent and a quantitative determination of the moduli by BLS requires the knowledge of both n and ρ. High-resolution Brillouin spectra were recorded with a tandem spectrometer described elsewhere14. It consists
of a four-pass planar Fabry-Perot (FP) interferometer in tandem with a spherical one, both controlled by laser light modulated at high frequency15. The plane FP
op-erates as a bandpass filter centered on the Brillouin line, reducing considerably the spurious elastic signal. The re-solving unit is a scanned spherical FP of 25 mm spacing, i.e. with a free spectral range of about 3 GHz. This high-contrast/high resolution spectrometer is equipped with a microscope that permits experiments on small-size sam-ples and Brillouin micro-cartographies with an improved spatial resolution.
Light from a single mode Ar+laser operating at 514.5
nm is focused with a ×100 Plan Apo SL Mitutoyo ob-jective of numerical aperture 0.55 on the sample sur-face. The latter is mounted on a computer-controlled XY piezoelectric stage. The scattered light is collected in the backscattering geometry. From these parameters, a lateral resolution of 1.2 µm is estimated. By monitor-ing the strength of the Brillouin line across the sample surface, an axial resolution of about 6 µm is obtained, in good agreement with the expected value. The laser power impinging on the sample is about 150 mW and a typical spectrum is recorded in 720 s. The sample was cut from a large plate of a standard window glass (Planilux, Saint Gobain Co., France), resulting in a parallelepiped of ap-proximately 30×30×4 mm3. Three series of five Vickers
indents with loads of 0.5, 1 and 2 kg were prepared on the glass surface with an instrumented micro-indentation set-up.
As discussed above, the residual density field after in-dentation is expected to be a major signature of the
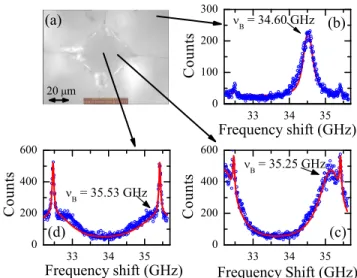
plas-33 34 35 0 100 200 300 33 34 35 0 200 400 600 33 34 35 0 200 400 600 B = 34.60 GHz C o u n t s Frequency shift (GHz) (b) B = 35.25 GHz C o u n t s Frequency Shift (GHz) (c) B = 35.53 GHz C o u n t s Frequency shift (GHz) (d) (a) 20 m
FIG. 2. (Color online) a) Top-view photograph of a 2-kg Vick-ers indent on a soda-lime silicate glass surface. b-d) Brillouin spectra taken at 5 µm beneath the surface, for a pristine sam-ple volume far from the indented area, along the edge of the Vickers indenter at 12 µm from the center and at the center, respectively.
tic behavior of the glass. In view of a quantitative me-chanical analysis of the BLS measurement, the calibra-tion of the Brillouin frequency-shift variacalibra-tion with glass density is a crucial step. Not only the elastic modulus, but also the refractive index16 exhibits a direct
depen-dence on density. A possibility is to measure densified samples recovered from high pressure experiments which could serve as references. Densified samples of the same standard window glass were recently obtained using a multi-anvil high-pressure cell by Ji et al.17. After
an-nealing for 2 h at the glass-transition temperature, small cylinders were maintained at high pressure and at room temperature for 1 h, and then slowly decompressed. For a maximum applied pressure of 20 GPa, the process re-sulted in a densification of 6.3%, ρ = 2.672 g.cm−3, as
compared to a pristine cylinder, ρ = 2.514 g.cm−3. The
relative density change is indeed believed to saturate around 6% for this glass composition17. Both samples
have been characterized by BLS to determine the elastic moduli18. The high-resolution Brillouin spectra of the
longitudinal acoustic modes in the backscattering geom-etry for the pristine and densified samples are shown in Fig. 1. The densification induces a well-defined increase of the Brillouin frequency shift, from 34.31 GHz for the pristine glass to 34.96 GHz for the densified one. Such a variation is well above the accuracy of the spectrometer which is better than 0.01 GHz. It clearly emphasizes the ability of BLS to monitor the densification in this glass composition.
Fig. 2a represents a top-view photograph of a 2-kg Vickers indented soda-lime silicate glass. Fig. 2b shows a Brillouin spectrum measured 5 µm below the surface at a sufficiently large distance from the indent to ensure
that the pristine glass is probed. The Brillouin linewidth is comparable to the one observed in Fig. 1a, thus indi-cating a homogeneous scattering volume. However, the measured Brillouin frequency shift is 34.60 GHz at vari-ance with the 34.31 GHz observed on the pristine sample of Ji et al.17. A slight difference in the commercial glass
composition between lots might exist but it could hardly explain a variation of nearly 1%. It is more likely that the Brillouin frequency shift change is simply due to the annealing treatment applied to the samples provided by Ji et al.17.
The Brillouin spectra obtained along the edge of the Vickers indenter at 12 µm from the center and at its cen-ter are shown in Figs. 2c and 2d, respectively. The ex-perimental Brillouin linewidths are much broader in the stressed area. Indentation is indeed a highly inhomoge-neous loading which modifies the glass beneath the sur-face to an inhomogeneous medium. Following the trend observed in Fig. 1, the measured Brillouin frequency shifts increase when the focal point is moved towards the center of the indent, where the maximum densification is expected. However, the magnitude of the measured vari-ation, 0.93 GHz, is significantly larger than the 0.65 GHz increase associated to a 6.3% densification derived from Fig. 1. This clearly shows that permanent densification can only account for part of the increase in the Brillouin frequency shift.
A natural explanation for that observation lies in the presence of residual (hydrostatic as well as deviatoric) stresses in the indented area. Non-linear elastic effects associated with stresses indeed modify the local sound velocities probed by Brillouin spectroscopy via the third-order elastic constants19. A fully quantitative analysis
would imply computing the Brillouin frequency shifts in-duced by the indentation residual densification and stress fields and to compare it with the experimental BLS spa-tially resolved data. While such an analysis clearly goes beyond the scope of the present Letter, we stress that spatially resolved BLS spectroscopy appears as a very promising tool for a quantitative identification of a plas-tic constitutive law of oxide glasses.
It is, however, reasonable to assume that residual stress induced effects are simply proportional to densification. As a consequence, we consider in the following that a densification of 6.3% is reflected by a linear increase of 0.93 GHz in the Brillouin frequency shift for that glass. Using this density gauge, the Brillouin frequency shifts measured throughout the indent can be converted to a local residual densification of the glass.
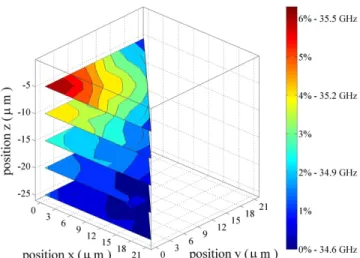
2D maps, parallel to the pristine surface, were obtained by collecting 20 spectra covering one-eighth of the indent with a 3-µm spacing. 3D maps were made up by vary-ing the focal point with a 5-µm spacvary-ing until the pristine glass was fully recovered. A representative 3D densifica-tion map of a 2-kg Vickers indent is shown in Fig. 3, using the Brillouin frequency shift of the longitudinal acous-tic modes as a density gauge. The most densified area is found beneath the tip of the indenter and the
plas-FIG. 3. (Color online) 3D mapping of the residual density field beneath a plastic impression left by a 2-kg Vickers inden-tation on a soda-lime silicate glass surface. The color scale in-dicates the residual densification in percent and the measured Brillouin frequency shifts, linearly related. x and y axes are along the diagonals of the indent and (0,0) defines its center.
z axis is normal to the pristine surface. The map represents
a x = y symmetrized quarter-view of the total indented area for visualization purpose but only a one-eight elementary unit of symmetry has been measured.
tic zone extends to about 25 µm from the glass surface. The density gradient is nearly isotropic, confirming ear-lier optical observations made on a similar glass20.
Iso-density contours at the surface show a spherical pattern, similar to those obtained using Cr3+luminescence
micro-spectroscopy13 and Raman micro-spectroscopy21, hence
validating the approach. We verified that the pattern was similar to those observed on other 2-kg Vickers in-dents. Densification maps were also obtained throughout 1-kg and 0.5-kg Vickers indents, revealing smaller circu-lar densification gradients as expected.
In conclusion, BLS was used to obtain a first obser-vation of the local densification induced by a Vickers test in the whole indented volume. It stresses the po-tential of Brillouin micro-spectroscopy to provide such detailed informations at the micron scale. As Brillouin spectroscopy is sensitive to residual stresses as well, it could be a promising tool to complement other spectro-scopies, thus providing much richer data to be compared with constitutive model calculations. A second interest of BLS in the study of the elastic-plastic response of glasses lies is its applicability to a wide range of glass composi-tions. The density gauge does not rely on the existence of an optical mode specific to the glass structure or on the presence in the glass composition of transition or rare-earth ions. Hence, Brillouin micro-spectroscopy could be used to characterize the small scale mechanical response of amorphous solids in a continuous range of glass com-positions exhibiting different plastic behaviors.
4 time needed to extract Brillouin frequency shifts. It
severely hampers the spatial resolution of the densifi-cation map when keeping the total measurement time within reasonable limit. This issue should be eased by the recent development of a fast-acquisition Brillouin spec-trograph based on a CCD and an original optical ar-rangement22.
ACKNOWLEDGMENTS
The authors would like to thank E. Barthel for enlight-ful discussions. This work was partially funded by the Agence Nationale pour la Recherche (Grant No. ANR-05-BLAN-0367-04, PlastiGlass) and R´egion Languedoc-Roussillon (Omega Platform).
1E. W. Taylor, Nature 163, 323 (1949).
2D. M. Marsh, Proc. R. Soc. Lond. A-Math. Phys. Sci. 279, 420
(1964).
3F. M. Ernsberger, J. Am. Ceram. Soc. 51, 545 (1968). 4K. W. Peter, J. of Non-Cryst. Solids 5, 103 (1970). 5A. S. Argon, Acta Metall. 27, 47 (1979).
6M. L. Falk and J. S. Langer, Phys. Rev. E 57, 7192 (1998).
7D. Rodney, A. Tanguy, and D. Vandembroucq, Model. Simul.
Mater. Sci. Eng. 19, 083001 (2011).
8W. C. Oliver and G. M. Pharr, J. Mater. Res. 7, 1564 (1992). 9A. B. Shorey, K. Xin, K.-H. Chen, and J. C. Lambropoulos, in
Inorganic Optical Materials, SPIE, Vol. 3424, edited by A. J. M. III (1998) pp. 72–81.
10A. Perriot, D. Vandembroucq, E. Barthel, V. Martinez, L.
Gros-valet, C. Martinet, and B. Champagnon, J. Am. Ceram. Soc. 89, 596 (2006).
11F. L. Galeener, Solid State Commun. 44, 1037 (1982).
12G. Kermouche, E. Barthel, D. Vandembroucq, and P. Dubujet,
Acta Mater. 56, 3222 (2008).
13A. Perriot, E. Barthel, G. Kermouche, G. Querel, and D.
Van-dembroucq, Philos. Mag. 91, 1245 (2011).
14R. Vacher, S. Ayrinhac, M. Foret, B. Ruffl´e, and E. Courtens,
Phys. Rev. B 74, 012203 (2006).
15H. Sussner and R. Vacher, Appl. Optics 18, 3815 (1979). 16D. Dandekar, J. Appl. Phys. 84, 6614 (1998).
17H. Ji, V. Keryvin, T. Rouxel, and T. Hammouda, Scr. Mater.
55, 1159 (2006).
18T. Rouxel, H. Ji, J. P. Guin, F. Augereau, and B. Ruffl´e, J.
Appl. Phys. 107, 094903 (2010).
19D. Cavaill´e, C. Levelut, R. Vialla, R. Vacher, and E. Le Bourhis,
J. Non-Cryst. Solids 260, 235 (1999).
20J. T. Hagan and S. van der Zwaag, J. Non-Cryst. Solids 64, 249
(1984).
21T. Deschamps, C. Martinet, J. L. Bruneel, and B. Champagnon,
J. Phys.-Condens. Matter 23, 035402 (2011).
22R. Vialla, B. Ruffl´e, G. Guimbreti`ere, and R. Vacher, Rev. Sci.
![[PDF] Bootstrap tutorial francais pdf | Cours Bootstrap](data:image/gif;base64,R0lGODlhAQABAIAAAP///wAAACH5BAEAAAAALAAAAAABAAEAAAICRAEAOw==)