ASSESSMENT METHODS. PART I: VISUAL ASSESSMENT OF SLIDES
MATTHIAS DOBBERTIN1∗, CHRISTIAN HUG1and NOBUYA MIZOUE2 1WSL, Swiss Federal Institute for Forest, Snow and Landscape Research, Birmensdorf,
Switzerland;2Division of Forest Science, Miyazaki University, Miyazaki, Japan (∗author for correspondence, e-mail: [email protected])
(Received 24 April 2003; accepted 15 September 2003)
Abstract. In this study we used photographs of tree crowns to test whether the assessment methods
for tree defoliation in Switzerland have changed over time. We randomly selected 24 series of slides of Norway spruce with field assessments made between 1986 and 1995. The slides were randomly arranged and assessed by three experts without prior knowledge of the year when the slide was taken or the tree number. Defoliation was assessed using the Swiss reference photo guide. Although the correlations between the field assessments and slide assessments were high (Spearman’s rank correlation coefficient ranged between 0.79 and 0.83), we found significant differences between field and slide assessments (4.3 to 9% underprediction by the slide assessors) and between the slide assessments. However, no significant trends in field assessment methods could be detected. When the mean differences between field and slide assessments were subtracted, in some years, field assessors consistently underpredicted (1990, 1992) or overpredicted defoliation (1987, 1991). Defoliation ten-ded to be overpredicted in slides taken against the light, and underpredicted for trees with more than 25% crown overlap. We conclude that slide series can be used to detect changes in assessment methods. However, potential observer bias calls for more objective methods of assessment.
Keywords: assessment methods, slides, time trends, tree defoliation
1. Introduction
In the 1980s the fear that there would be a large-scale forest decline in Europe led to the establishment of national, and later international, forest health inventories in Europe and in North America (Burkman and Hertel, 1992; Hall, 1995; Müller-Edzards et al., 1997). In addition to the identification in those inventories of known pests and diseases, indicators of tree vitality are also assessed. ‘Crown transpar-ency’ (U.S.A. and Canada) or ‘crown defoliation’ (Europe) were the chosen key parameters to be used in these inventories. So far no alternative key indicator that can readily be assessed in large-scale inventories has been proposed. The major draw-back of these key parameters is that they are visually estimated by observers and are therefore prone to assessment error (Köhl, 1991; Strand, 1996; Dobbertin et al., 1997; Solberg and Strand, 1999; Wulff, 2002). Until now, no exact crown transparency measure has been developed, although some automated procedures have been proposed and are currently being evaluated (Strand, 1990; Mizoue, 2002; Mizoue and Dobbertin, 2003). Instead, defoliation or transparency
Environmental Monitoring and Assessment 98: 295–306, 2004.
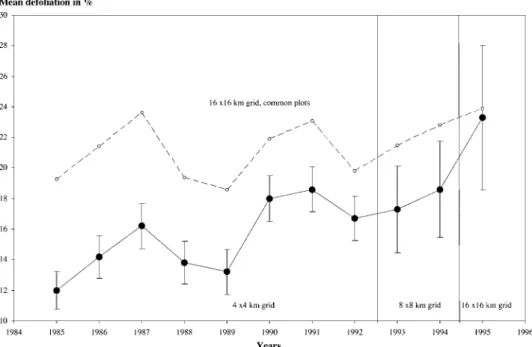
Figure 1. Mean defoliation scores with standard error for Norway spruce in Switzerland between
1985 and 1995. From 1985 until 1992 assessment was made on a 4× 4 km grid, in 1993 and 1994 on a 8× 8 km grid and in 1995 on a 16 × 16 km grid (with additional satellite plots on the 8 × 8 and 16× 16 km grids).al Additional mean defoliation scores are plotted on the common 16 × 16 km grid without the satellite plots.
is visually assessed by observers (commonly in classes of 5%). As changes in tree crown conditions are of major concern, it is important to know whether any observed changes are actual changes in tree condition or are simply due to changes in the assessment methods.
In Switzerland crown defoliation was first assessed in 1984 (BFL/EAFV, 1985). Since 1985 assessment has been carried out on a systematic grid of permanent sample plots as part of the Swiss Forest Health Inventory (SFHI). Between 1985 and 1995, a steady increase in observed defoliation was noted for most species (Brang, 1998; Figure 1). The reasons for this increase are still not known. It is possible that these changes are at least partially due to a shift in assessment method. Such changes in the assessments may be due either to a wanted or an unwanted change in methods (Redfern, 1997; Landmann et al., 1999; Lorenz et al., 1999) or to variability of the observer teams (Köhl, 1991; Innes et al., 1994; Dobbertin and Ghosh, 1998; Solberg, 1999).
In this study we used a time series of slides of Norway spruce taken between 1986 and 1995. The photographed trees had also been assessed for crown defolia-tion in the field. To test for evidence of a shift in assessment methods we compared the actual field assessments with assessments made from the slides by three experts.
We tested to see if there was a correlation between the assessments made with slides and those made in the field. We further tested whether there was a time trend in the differences between the three assessments and the field assessments and whether the differences in individual years were significant. We also evaluated if the light conditions in the slides and the visibility of the tree crowns effected the outcome.
2. Data and Methods
In 1986 and 1987 in Switzerland so called ‘photo parcours’ were installed at vari-ous locations. At each location open-grown trees of the main tree species in Switzer-land that were clearly visible were numbered. Each tree was photographed annually by a professional photographer. The position of the photographer, which was also identical to that of the field observers, remained the same each year. Photographs were taken until 1995, when this service was discontinued due to financial con-straints. All the trees were annually assessed for defoliation by field observers using the standard assessment methods. Although the assessing and photographing were done in the summer months July or August, they were not necessarily done at the same time. Thus, weather and light conditions in the slides may not be identical to the actual conditions at the time of the field assessments.
We restricted our study to Norway spruce, which is the most common tree species in Switzerland (LFI, 1988). Norway spruce also showed, as mentioned in the introduction, a marked increase in crown defoliation between 1985 and 1995 (Brang, 1998; Figure 1). It should be noted that this increase is less pronounced when only the common sample plots on the centre plots of the 16× 16 km grid are considered (Figure 1).
In 1986 not all trees had yet been selected for the photo parcours. We only used trees with at least 9 slides taken between 1986 and 1995. In 1995 not all the sites could be photographed due to poor weather conditions during that summer. As we could not analyse all the available slides of Norway spruce, we randomly selected 24 time series of trees from four locations comprising 221 assessments of defoliation. Three of the slide series included 2 trees per slide and one three trees per slide. All trees had been individually assessed in the field with the exception of a missing field assessment value for one tree in 1990.
The slides were randomly arranged and independently assessed by three trained assessors. Neither the year when the slide was taken, nor the tree number were made known to the assessors. Two assessors were trainers in the years 1996 to 1999, and one assessor was a member of a field team with 8 yr experience. We evaluated the differences between the slide and field assessments to see if these were related to the quality of the slide or the visibility of the trees in the slide. For this purpose, we ranked the slides first according to the visibility of the tree crowns using three classes: whole crown visible, only light crown visible (for Norway
TABLE I
Spearman’s rank correlation coefficient and p-value of significance between the three slide and the field defoliation scores over all years, and minimum and maximum coefficients in a given year
All trees p-value Minimum Maximum (n = 220) in a year in a year 1. Slide assessor 0.83 <0.0001 0.74 0.93 2. Slide assessor 0.79 <0.0001 0.62 0.88 3. Slide assessor 0.79 <0.0001 0.65 0.90
spruce in Switzerland this means commonly the upper two thirds of the crown (Burger, 1939), and only tip of the tree visible (less or equal than the upper third of the crown)). We also graded the light conditions: photo taken with the light behind, light from the side or with overcast conditions, or photos taken against the light or overexposed (Hanisch and Kilz, 1991). Finally, the degree of overlap of the tree crown with neighbouring trees were also recorded; no overlap, about 25% overlap of crown radius on one or both sides, or at least 50% overlap on one or both sides (Mizoue, 2002).
3. Statistical Methods
We were interested in investigating whether a time trend in field observations exists and whether they deviated significantly in certain years. We used mostly non-parametric tests in our study. The correlation between the slide and field assess-ments was computed using Spearman’s rank correlation coefficient. We analysed the differences for all trees to see if these deviated from 0 using Wilcoxon’s rank sign test (Bradley, 1968). If a significant difference was found, we used a corrected difference score as the difference between the two assessments plus the average difference. The corrected difference scores for each individual year were again tested for a significant deviation from 0 using Wilcoxon’s rank sign test. The overall trends for all assessments were analysed for each observer and the field assessments separately using a simple linear regression and comparing the estimates of the slope parameters. The effects of differences in slide quality and crown visibility were tested using Wilcoxon’s rank sum test (Bradley, 1968).
TABLE II
Differences between the three slide and the field defoliation scores, standard deviation of the differences and Wilcoxon’s sign rank statistic (n = 220)
Mean SD Wilcoxon’s sign rank test difference (%) (%) (Pr≥ |S|)
1. Slide assessor 7.54 9.00 <0.0001 2. Slide assessor 8.98 9.74 <0.0001 3. Slide assessor 4.27 10.86 <0.0001
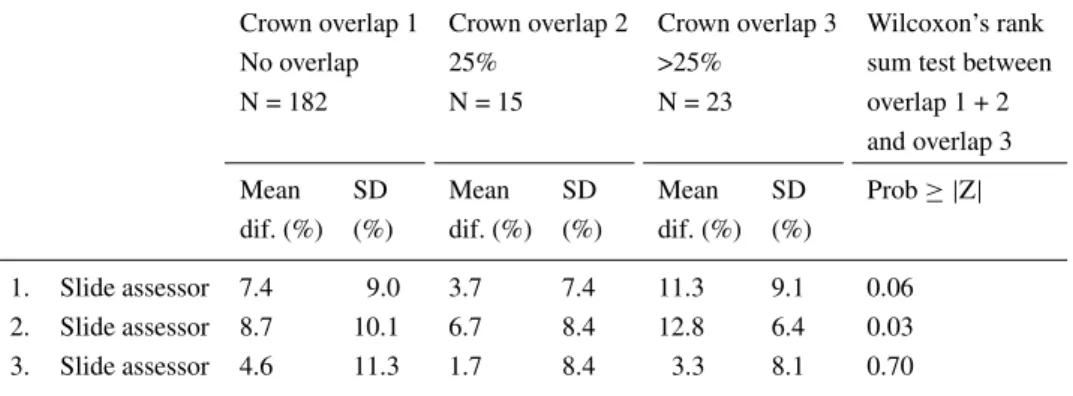
TABLE III
Differences between the three slide and the field defoliation scores and their standard deviations according to crown overlap class. Wilcoxon’s rank sum test statistic comparing overlap 1 and 2 with overlap 3
Crown overlap 1 Crown overlap 2 Crown overlap 3 Wilcoxon’s rank No overlap 25% >25% sum test between N = 182 N = 15 N = 23 overlap 1 + 2
and overlap 3 Mean SD Mean SD Mean SD Prob≥ |Z| dif. (%) (%) dif. (%) (%) dif. (%) (%)
1. Slide assessor 7.4 9.0 3.7 7.4 11.3 9.1 0.06 2. Slide assessor 8.7 10.1 6.7 8.4 12.8 6.4 0.03 3. Slide assessor 4.6 11.3 1.7 8.4 3.3 8.1 0.70
4. Results
For the investigated years, Spearman’s rank correlation coefficients between all pairs of the four assessments were highly significant (see Table I for the correlation between slide assessments and field assessments using all trees). The correlation coefficients in a given year ranged between 0.62 and 0.93 excluding the year 1995 with only 11 trees in the data set.
When compared with the field teams the slide assessors significantly under-predicted the defoliation by between 4.3 and 9% (Table II). Significant differences were found between the slide assessors.
Independent of the visibility and light conditions, all trees were assessed with a lower defoliation score by the slide assessors than in the field assessments (Tables III to V). While we found no consistent differences between trees with no overlap and trees with 25% overlap on one or both sides, two slide assessors seemed to
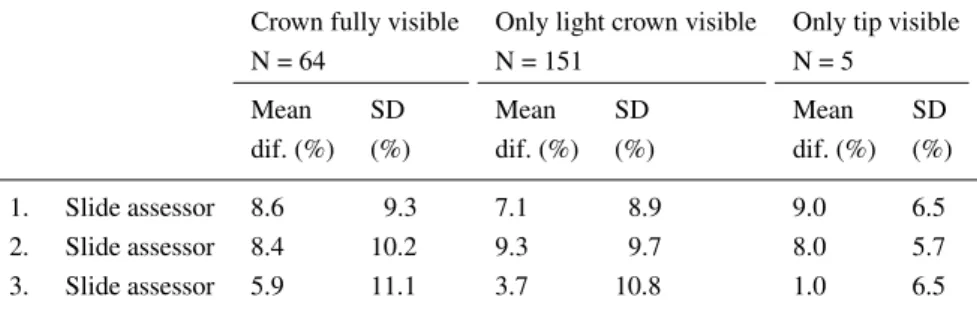
TABLE IV
Differences between the three slide and the field defoliation scores and their standard deviations according to crown visibility class
Crown fully visible Only light crown visible Only tip visible
N = 64 N = 151 N = 5
Mean SD Mean SD Mean SD
dif. (%) (%) dif. (%) (%) dif. (%) (%) 1. Slide assessor 8.6 9.3 7.1 8.9 9.0 6.5 2. Slide assessor 8.4 10.2 9.3 9.7 8.0 5.7 3. Slide assessor 5.9 11.1 3.7 10.8 1.0 6.5
TABLE V
Differences between the three slide and the field defoliation scores and their standard deviations according to light condition class. Wilcoxon’s rank sum test statistic comparing slides taken against the light with all other light conditions
With the light Light from the Against the light Wilcoxon’s rank side or overcast sum test between N = 114 N = 84 N = 22 against the light
and other light conditions Mean SD Mean SD Mean SD Prob≥ |Z| dif. (%) (%) dif. (%) (%) dif. (%) (%)
1. Slide assessor 7.2 8.9 8.5 8.4 5.9 11.6 0.51 2. Slide assessor 9.6 9.6 9.4 8.2 4.3 14.3 0.07 3. Slide assessor 5.2 10.5 3.9 10.3 0.7 14.0 0.05
assess trees with more than 25% crown overlap with an even lower defoliation score (Table III). With the exception of five trees, in all the slides at least the light crown was visible. No differences were found between the assessments of trees with a completely visible crown and trees with only the light crown visible (Table IV). Trees photographed against the light tended to be assessed with a higher defoliation score by the slide assessors than trees photographed with the light or under overcast conditions (Table V).
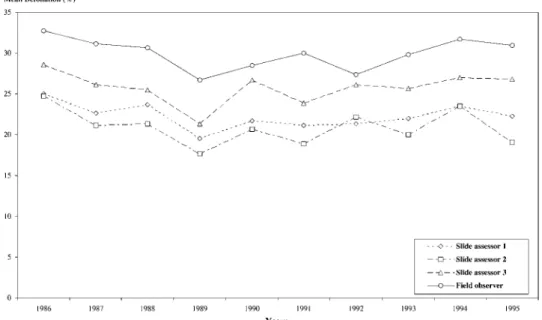
The mean defoliation scores of the photo parcours trees neither increased over time for the field assessments nor for the slide assessments (Figure 2), unlike in the SFHI. The regression analysis of the three corrected difference scores showed no
Figure 2. Development of mean defoliation scores of three slide assessors and one field assessment
between 1986 and 1995 of 24 photographed Norway spruces (in 1986 only 18 trees were assessed, in 1990 only 23 trees and in 1995 only 11 trees).
Figure 3. Mean adjusted differences in defoliation scores between three slide assessors and the field
assessments between 1986 and 1995 of 24 photographed Norway spruces (in 1986 only 18 trees were assessed, in 1990 only 23 trees and in 1995 only 11 trees).
significant trend over time (Figure 3). The slope parameters were not significantly different from zero (p-values were 0.98 for assessor 1, 0.97 for assessor 2 and 0.68 for assessor 3). Consistently lower corrected difference scores were found for the field assessments in 1990 and 1992, whereas they were higher in 1987 and 1991. However, due to the small number of trees per year, no significant differences were found using Wilcoxon’s sign rank test statistics.
5. Discussion
The extent of defoliation assessed from the slides was significantly lower than in the field assessments. Significant differences were also found between the slide assessors. There are several possible explanations for this. First, the slide obser-vers are also prone to observer variation and the three negative deviations may be caused by chance (Mizoue and Dobbertin, 2003). Second, it may be possible that the current assessment standard has significantly shifted to assigning lower scores. Third, slide assessments may be systematically biased towards lower defoliation scores. The third hypothesis is supported by a study of 150 slides of Norway spruce used to calibrate the trainers to the same standard (Mizoue, 1999). These slides had been assessed by six experts in 1992 and, together with the slides of other species, are used as an absolute reference to calibrate the trainers. Mizoue has developed a semi-automatic program for digital analysis of photos (CROCO, see also Mizoue, 2002; Dobbertin et al., 2004) to obtain defoliation scores (Mizoue and Dobbertin, 2003). He used the Swiss reference photos (Müller and Stierlin, 1990) to calibrate his programme. The reference scores of these photographed trees were assessed in the field and not from photographs. Comparing the standard assessments of Norway spruces by the six experts in 1992 with assessments using CROCO, Mizoue (1999) found that the slide assessments were significantly lower, indicating that slide assessments tend to underestimate defoliation in comparison to field assessments.
In our study we found that the assessment scores for trees overlapped by neigh-bouring trees or with trees behind them were underestimated by two slide assessors in comparison to the field estimate. The reason for this is that in the slides mainly transparency can be assessed, while in the field binoculars are used and the three-dimensionality of the trees is taken into account for an estimate of defoliation. Any overlapping of tree crowns hence leads to an overall underestimation of defoliation in slide assessments when compared to the field assessments. Mizoue (2002) found, for his semi-automatic program CROCO that more than 50% crown overlap on both sides of the tree crown severely influenced the score.
Systematic differences between slide assessors can be partially explained by the autocorrelation of assessments. Gertner and Köhl (1995) showed that autocorrel-ation of errors exists and that it will influence the computed prediction accuracy. If an observer starts slightly higher with his first assessment, he will also tend to
assess the rest of the trees higher. However, as the trees were arranged in random order these autocorrelations should be negligible in individual years. Actual field assessments, on the other hand, may show an autocorrelation of errors in a year at a given location. We tried to minimise this effect by randomly selecting trees from four different locations.
When considering all the slides the correlation of assessed defoliation between slide assessments and field assessments was high. Spearmann’s rank correlation varied between 0.79 and 0.83. Neither the assessment by the field teams nor the slide assessments showed an increasing trend in defoliation. However, there was also no increasing trend in difference between slide assessments and field assess-ments for all slide assessors. In other words, there was no evidence of a shift in field assessment methods. The Norway spruce assessed for the photographic time series and sampled for this study did not show the same trend as that observed on the systematic plots of the SFHI (Brang, 1998). It should be noted that the photo parcours were arbitrarily chosen and although they can be used to test for a change in methodology they are not representative for the condition of the Swiss forests. In addition, the change in grid size since 1993 may have led to an overestimation of the actual increase in defoliation for Norway spruce in Switzerland. The less pronounced increase in defoliation on the common 16× 16 km grid plots seems to support this (Figure 1). However, due to the small sample size the random error increased substantially and a trend analysis on this grid for a certain species is not feasible. In addition, the general increase in defoliation for Norway spruce until 1995 agrees with the observations made by Flückiger and Braun (1999) on long-term observation sites in Switzerland.
After subtracting the mean difference between the slide and field assessments, we found differences of between –3 and + 3% in some years. The differences were not, however, significant in any year, probably due to the low number of observations. The years 1987 and 1991 showed a consistent overprediction and the years 1990 and 1992 a consistent underprediction of the field assessments as compared to the three slide assessments. The suspected shift in methods fol-lowing the incorporation of the variable ‘total defoliation’ in 1990 could not be substantiated for our data (Innes et al., 1994). We conclude that in some years an over- or underprediction by the field teams may have occurred, but this needs to be substantiated with a larger set of data. Two studies found significant dif-ferences between field teams and control teams in the SFHI in the years 1990, 1991 and 1992 (Köhl, 1991; Ghosh et al., 1995). Ghosh et al. found that, in all inventories from 1989 to 1992, at least one field team had significantly deviated from one of the control teams. With the exception of 1990 these differences were below 2% defoliation. However, as control teams may have also been the cause of the deviation, it was not possible to determine how these observer errors may have effected the overall scores. Other studies have also shown that assessments of field teams may vary substantially (Strand, 1996; Solberg, 1999; Solberg and Strand, 1999; Wulff, 2002) and depend on experience and the training received.
The assessment of slides tended to underpredict trees with more than 25% crown overlap and overpredict trees photographed against the light. As discussed earlier, crowns overlapped by other crowns appear less transparent and will lead to lower slide scores. For photographs taken against the light defoliation may appear to be more extensive than it really is as more light is penetrating the crown. The problem of these conditions in defoliation assessment is well-known (Hanisch and Kilz, 1991) and has usually been taken into account in assessment manuals (USDA Forest Service, 1998; Dobbertin et al., 1999).
Our study has shown that slides taken from reference trees can be used to test whether the assessment methods for defoliation have changed. We found no evidence of a general shift in assessment methods for Norway spruce using a ran-domly selected subset of slides. In some years over- or under-estimations may have occurred, but more observations are needed to test for whether these patterns are significant. Although these differences were usually below 2%, when interpreting small difference between years caution has to be taken. As individual field teams may differ in a given year, the assessors of the photographic calibration trees must be reported, as well as how they fared in relation to the teams used as controls in the field assessments. Unless information about these is provided, it will not be possible to adjust these assessments or draw conclusions about the quality of the results in a given year.
In addition, the assessment of the slides by experts is prone to the same observer variability as the field assessments. Therefore, with each additional inventory the whole time series of slides need to be reassessed. It will only be possible to solve this problem if an objective assessment method for the assessment of the slides could be found. The semi-automatic program CROCO (Mizoue, 2002) can be used for such a purpose and is evaluated in a second study (Dobbertin et al., 2004). However, in any assessment using slides, the slides must meet a certain standard of quality. In particular, photographs taken against the light or overexposure have to be prevented at all costs as the defoliation will be overestimated in these cases. In addition, the proportion of overlap of the assessed crowns should not exceed 25% on one or both sides, otherwise the extent of defoliation in the slide will be under-predicted.
Acknowledgements
The Swiss Forest Health Inventory is part of the Swiss Forest Investigation Pro-gramme conducted by the Swiss Federal Institute of Forest, Snow and Landscape Research in co-operation with the Swiss Federal Forest Administration. We also thank R. Siegrist for assessing the slides, the various field assessors that have as-sessed the trees since 1986, and in particular, P. Sulser, H. Keusen, and P. Scherer for taking the slides.
References
BFL/EAFV: 1985, Ergebnisse der Sanasilva-Waldschadeninventur 1985, BLF/EAFV, Bern und Birmensdorf, pp. 47.
Bradley, J. V.: 1968, Distribution-free Statistical Tests, Prentice-Hall, Inc., Englewood Cliffs, New Jersey, pp. 388.
Brang, P. (ed.): 1998, Sanasilva-Bericht 1997. Zustand und Gefährdung des Schweizer Waldes –
Eine Zwischenbilanz nach 15 Jahren Waldschadenforschung, Berichte. Eidg. Forschungsanstalt
für Wald, Schnee und Landschaft, Birmensdorf, 345, pp. 102.
Burger, H.: 1939, ‘Baumkrone und Zuwachs in zwei hiebsreifen Fichtenbeständen’, Mitt. Schweiz.
Anst. f. d. forstl. Vers. Wesen. 21, 5–58.
Burkman, W. G. and Hertel, G. D.: 1992, ‘Forest Health Monitoring – A national program to detect, evaluate, and understand change’, J. For. 90(9), 27–28.
Dobbertin, M., Hug, C. and Schwyzer, A.: 1999, Aufnahmeanleitung für die Sanasilva-Inventur, Version 6.3, intern. document, pp 53.
Dobbertin, M., Hug, C. and Mizoue, N.: 2004, ‘Using slides to test for changes in crown condi-tion assessment methods. Part II: Applicacondi-tion of the image analysis system CROCO’, Environ.
Monitor. Assess. (submitted)
Dobbertin, M. and Ghosh, S.: 1998, ‘Vergleich zwischen zwei Beobachtern bei der Inventur 1997’, in P. Brang (ed.), Sanasilva-Bericht 1997. Zustand und Gefährdung des Schweizer Waldes – Eine
Zwischenbilanz nach 15 Jahren Waldschadenforschung, Berichte, Eidg. Forschungsanstalt für
Wald, Schnee und Landschaft, Nr. 345, pp. 84–85.
Dobbertin, M., Landmann, G., Pierrat, J. C. and Müller-Edzards, C.: 1997, ‘Quality of Crown Condi-tion Data’, in C. Müller-Edzards, W. De Vries, and J. W. Erisman, (eds), Ten Years of Monitoring
Forest Condition in Europe. Studies on Temporal Development, Spatial Distribution and Im-pacts of Natural and Anthropogenic Stress Factors. Technical Background Report’, Geneva and
Brussels, United Nations Economic Commission for Europe/European Commission, pp. 7–22. Flückiger, W. and Braun, S.: 1999, Wie geht es unserem Wald? Untersuchungen in
Walddauer-beobachtungsflächen von 1984 bis 1998, Institut für angewandte Pflanzenbiologie, Schönenbuch.
Gertner, G. and Köhl, M.: 1995, ‘Correlated observer errors and their effects on survey estimates of needle-leaf loss’, For. Sci. 41(4), 758–776.
Ghosh, S., Innes, J. L. and Hoffmann, C.: 1995, ‘Observer variation as a source of error in assessments of crown condition through time’, Forest Sci. 41(2), 235–254.
Hall, J. P.: 1995, ‘Forest health monitoring in Canada: How healthy is the boreal forest?’, Water, Air,
Soil Pollut. 82(1–2), 77–85.
Hanisch, B. and Kilz, E.: 1990, Waldschäden erkennen (Fichte und Kiefer). Monitoring of Forest
Damage (Spruce and Pine). Reconnaître les dommages forestiers (épicéa et pin), Ulmer,
Stuttgart/Helm, London, pp. 334.
Innes, J. L., Böhm, J. P., Bucher, J. B., Dobbertin, M., Jansen, E., Kull, P., Rigling, A., Walthert, L. and Zimmermann, S.: 1994, Sanasilva-Bericht 1993. Der Zustand des Schweizer Waldes, Berichte der Eidgenössichen Forschungsanstalt für Wald, Schnee und Landschaft 339, pp. 60. Köhl, M.: 1991, ‘Waldschadensinventuren: Mögliche Ursachen der Variation der
Nadel/Blattverlustschätzung zwischen Beobachtern und Folgerungen für Kontrollaufnahmen’,
Allg. Forst-Jagdtztg. 162(11/12), 210–221.
Landmann, G., Pierrat, J.-C. and Nageleisen, L.-M.: 1999, ‘1995–1997: Période de réajustement à la hausse de la notation de l’état des cimes des arbres forestiers en France’, in Département de la Santé des Forêts (eds), La santé des forêts (France) en 1998, Paris, Ministère de l’Agriculture et de la Pêche (DERF-Département de la Santé des Forêts), pp. 63–66.
Lorenz, M., Müller-Edzards, C., Becher, G., Fischer, R. and Dibbern, B.: 1999, ‘Forest Condition in Europe. Results of the 1998 Crown Condition Survey 1999’, Technical Report, Brussels, Geneva, EC-UN/ECE, p. 84 + ann. pp.
USDA Forest Service: 1998, Forest Health Monitoring 1998 Field Methods Guide, USDA Forest Service, National Forest Health Monitoring Program, Research Triangle Park, NC 27709. Mizoue, N.: 1999, ‘Development of Image Analysis System for Crown Condition Assessment in
Forest Health Monitoring, CROCO’, Dissertation, Kyushu University, pp. 89.
Mizoue, N.: 2002, ‘CROCO: Semi-automatic image analysis system for crown condition assessment in forest health monitoring’, J. For. Plann. 8, 17–24.
Mizoue, N. and Dobbertin, M.: 2003, ‘Detecting differences in crown transparency assessments between countries using the image analysis system CROCO’, Environ. Monitor. Assess. 89, 179–195.
Müller, E. and Stierlin, H. R.: 1990, Sanasilva Kronenbilder mit Nadel- und
Blattverlustprozen-ten, Eidgenössiche Forschungsanstalt für Wald, Schnee und Landschaft, 2. überarbeitete und
erweiterte Auflage, pp. 129.
Müller-Edzards, C., De Vries, W. and Erisman, J. W. (eds): 1997, ‘Ten Years of Monitoring Forest Condition in Europe. Studies on Temporal Development, Spatial Distribution and Impacts of Natural and Anthropogenic Stress Factors’, Technical Background Report, Geneva and Brussels, United Nations Economic Commission for Europe/European Commission, pp. 385.
Redfern, D. B.: 1997, ‘National Report. United Kingdom’, in C. Müller-Edzards, J. W. Erisman and W. De Vries, (eds), Ten Years of Monitoring Forest Condition in Europe. Studies on Temporal
Development, Spatial Distribution and Impacts of Natural and Anthropogenic Stress Factors. Technical Background Report, Geneva and Brussels, United Nations Economic Commission for
Europe/European Commission, pp. 174–177.
Solberg, S.: 1999, ‘Forest Health Monitoring: Evaluation of Methods, Trends and Causes Based on a Norwegian Nationwide Set of Monitoring Plots’, Dr. Agric. Thesis, Agricultural University of Norway. ISBN 82-7169-897-4.
Solberg, S. and Strand, L.: 1999, ‘Crown density assessments, control surveys and reproducibility’,
Environ. Monitor. Assess. 56, 75–86.
Strand, G.-H.: 1996, ‘Detection of observer bias in ongoing forest health monitoring programmes’,
Can. J. For. Res. 26, 1692–1696.
Strand, L.: 1990, ‘Crown density and fractal dimension’, Communications of the Norwegian Forest Research Institute 43.6 Norwegian For. Res. Inst., Oslo-Aas.
Wulff, S.: 2002, ‘The accuracy of forest damage assessments – Experiences from Sweden’, Environ.