ORIGINAL ARTICLE
Diagnostic study and meta-analysis of C-reactive protein
as a predictor of postoperative inflammatory complications
after gastroesophageal cancer surgery
Rene Warschkow&Ignazio Tarantino&
Kristjan Ukegjini&Ulrich Beutner&Sascha A. Müller&
Bruno M. Schmied&Thomas Steffen
Received: 12 October 2011 / Accepted: 26 February 2012 / Published online: 8 March 2012 # Springer-Verlag 2012
Abstract
Purpose This study assessed the diagnostic accuracy of C-reactive protein (CRP) after gastroesophageal cancer resec-tion for postoperative inflammatory complicaresec-tions (PIC). Methods The clinical data and CRP values of patients oper-ated on for gastroesophageal cancer surgery between 1997 and 2009 were retrospectively analyzed. The results of this study were compared with published data using a meta-analytic approach for diagnostic outcomes.
Results Of 210 patients included in the study, 59 developed PIC (28.1 %; 95 % CI: 22.5–34.5 %). On the postoperative day (POD) 4 and 7, CRP had the best diagnostic accuracy for PIC (AUC 0.77; 95 % CI, 0.64–0.91, AUC 0.81; 95 % CI, 0.71–0.91). Using a cut-off value of 141 mg/L (95 % CI, 131–278 mg/L) for CRP on POD 4, the sensitivity was 0.78 (95 % CI, 0.55–0.91), the specificity was 0.70 (95 % CI,
0.53–0.83) and the NPV was 0.89 (95 % CI, 0.77–0.95). The
in-hospital mortality rate was 3.3 % (95 % CI, 1.5–6.9 %). In a diagnostic meta-analysis that included two additional studies, CRP had a significant predictive value after POD 3.
Conclusion There is limited evidence for the diagnostic accuracy of CRP levels for PIC after gastroesophageal can-cer surgery. CRP levels on POD 4 might be useful to rule out PIC, but its diagnostic accuracy is moderate at best. For clinical routine use CRP levels are clearly not sufficient to
predict PIC and have to be interpreted in the context of the whole clinical picture.
Keywords Diagnostic study . C-reactive protein . Postoperative inflammatory complications . Gastroesophageal cancer
Introduction
Fast track surgery is slowly gaining acceptance into clinical practice; however, there are still concerns about the safety, in particular about postoperative complications after the early discharge of the patients. Especially for operations with a high postoperative complication rate, like gastro-esophageal cancer surgery, this is still an issue despite a recent study with excellent results after fast-track surgery of gastric cancer [1]. Reports about morbidity and mortality after gastroesophageal cancer surgery vary significantly in the literature, with particularly higher complication rates after esophagectomy [2–4].
A laboratory value predicting, or in the case of fast track surgery reliably excluding, postoperative inflammatory com-plications (PIC) would be extremely helpful. Furthermore, even for patients with conventional perioperative manage-ment, early diagnosis of PIC would allow timely therapy of potentially septic patients and thus would improve their
sur-vival [5–8]. C-reactive protein (CRP), a widely used
labora-tory value for an acute inflammalabora-tory response [9], would be a potential candidate for such a marker. Several studies indicat-ed that CRP can be usindicat-ed to prindicat-edict postoperative inflammatory complications [10–12]. However, some of these studies suffer from small study sizes and lack an adequate reporting of diagnostic results.
R. Warschkow (*)
:
I. Tarantino:
K. Ukegjini:
U. Beutner:
S. A. Müller:
B. M. Schmied:
T. SteffenDepartment of Surgery, Kantonsspital St. Gallen, 9007 St. Gallen, Switzerland
e-mail: [email protected] R. Warschkow
Institute of Medical Biometry and Informatics, University of Heidelberg,
Thus, the aim of this retrospective study was to analyze the diagnostic accuracy of CRP to detect PIC after gastro-esophageal cancer surgery in an unselected patient cohort. In addition, we pooled our data with published data for a meta-analysis of diagnostic outcome data.
Patients and methods
For this retrospective study, all patients operated on for gas-troesophageal cancer resection between January 1997 and December 2009 were identified from the institutional data-base. All patients routinely received preoperative antibiotic prophylaxis (500 mg metronidazole i.v. and 2000 mg cefa-mandole i.v. 60 min before the surgery) and anticoagulation with a low molecular weight heparin, according to the hospital guidelines. Some of the patients received selective digestive
tract decontamination (SDD) [13,14]: a solution of
polymyx-in (100 mg), tobramycpolymyx-in (80 mg), vancomycpolymyx-in (125 mg), and nystatin (500 mg) was administered orally four times a day from the morning of the day before surgery to the seventh postoperative day. Between postoperative day 5 (POD 5) and POD 7, radiological exams were routinely performed with an orally administered water-soluble contrast agent.
Data collection and definitions
The data were gathered retrospectively from the medical records. Mortality was defined as any death occurring during postoperative hospitalization. Anastomotic leakage was de-fined as an extravasation of the endoluminally administered water-soluble contrast agent on radiography or computed tomography or if proven during reoperation. Wound infec-tions and intra-abdominal abscesses that were not related to anastomotic leakages, according to the diagnosis from the medical records or the operation protocols, were recorded. The presence of pneumonia was recorded when it was men-tioned explicitly as a diagnosis in the medical records or as a radiological finding. Urinary infections, central line infec-tions, Clostridium difficile colitides, and any other forms of infections were recorded when explicitly mentioned in the medical file, independent of the treatment. Postoperative mor-bidity was rated according to the classification by Dindo et al. [15]. Neoadjuvant therapy was performed according to the decision of the interdisciplinary tumor board. Tumors of the gastroesophageal junction were classified according to Sie-wert [16]. Type I and II tumors were considered as esophageal cancers and type III tumors as gastric cancers.
CRP measurement
The CRP concentrations were measured with an automated analytical system (Unicel DxC 800, Beckman Coulter, reference
range <8 mg/L). Until August 2005, the measuring range was 3 to 300 mg/L, afterwards, the range was 1 to 500 mg/L. Therefore, CRP values exceeding 300 mg/L were reduced to 300 mg/L, and values under 3 mg/L were set to 3 mg/L. Meta-analysis
The authors searched the National Library of Medicine (Medline) and Cochrane Library databases in March 2011 for any studies that assessed the diagnostic accuracy of CRP for any PIC following gastroesophageal cancer surgery. The reference lists of each study were searched for additional publications. Data analysis established the number of patients with and without infectious complications and the number of patients who exceeded a distinct cut-off value, which resulted in a two-by-two-table for test outcome and clinical outcome. These data were not provided explicitly in the included studies and were therefore estimated from sensitivity and specificity.
Statistical analysis and authorization
The statistical analysis was performed using R (http://www. r-project.org). Two-sided p values of less than 0.05 were considered to be statistically significant. Continuous data are expressed as the mean±standard deviation or median and interquartile range (IQR), as indicated. The chi-square
test was used to compare proportions, and the Mann
–Whit-ney test was used to compare continuous data. Generalized estimation equation models were applied for multivariate analysis of CRP levels (mean ranks) with stratification for PIC. The diagnostic accuracy was determined by the area under the curve (AUC) of the receiver operating character-istic (ROC) curve [17]. The AUCs were computed using the nonparametric trapezoidal method and their 0.95 confidence limits (95 % CI), according to DeLong et al. [18]. The optimal cut-off values were determined by maximizing the Youden's index (0sensitivity+specificity−1). Nonparametric 95 % CIs for the cut-off values were computed with boot-strapping using the percentile method (5,000 estimates) [19]. Multivariate ROC analysis was performed with binormal ROC-generalized linear regression models with tie correction [20].
Meta-analyses of sensitivity and specificity were performed using the random effects model of DerSimonian and Laird [21]. Cochran's Q statistic was applied for the analysis of statistical heterogeneity. For each study, a diagnostic odds ratio (DOR) was calculated. The DOR is the ratio of the odds of a positive result in a patient with PIC compared to a patient
without PIC: (sensitivity/(1−sensitivity))/((1−specificity)/
specificity). It is a measure of the overall diagnostic accuracy and is less affected by the selected threshold and the prevalence than specificity or sensitivity alone [22].
The study was approved by the Swiss Federal Expert Commission for Physician Confidentiality and the state ethics
review board. It was registered underwww.clinicaltrials.gov/
ct2/show/NCT01249534.
Results
Exclusion criteria, baseline, and outcome
A total of 221 patients operated on for gastroesophageal cancer with a clinical follow-up of at least 30 days were identified from the database. Eleven patients were excluded
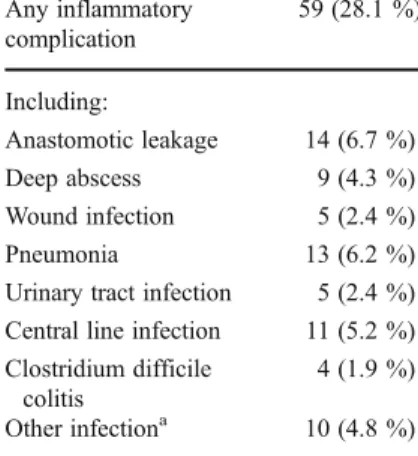
Table 1 Distribution of inflammatory complica-tions (N0210)
a
Cholecystitis, pancrea-titis, urogenital, and cerebral infections Any inflammatory complication 59 (28.1 %) Including: Anastomotic leakage 14 (6.7 %) Deep abscess 9 (4.3 %) Wound infection 5 (2.4 %) Pneumonia 13 (6.2 %) Urinary tract infection 5 (2.4 %) Central line infection 11 (5.2 %) Clostridium difficile
colitis
4 (1.9 %) Other infectiona 10 (4.8 %)
Table 2 Baseline characteristics, main operation type, and clinical outcomes
Total Inflammatory complications p N0210 Yes (N059) No (N0151)
Age (years) 63.3±12.2 63.6±12.9 63.2±12.0 0.505a
Body mass index (kg/m2) 24.6±4.3 25.0±4.1 24.4±4.4 0.327a
Gender Male 135 (64.3 %) 40 (67.8 %) 95 (62.9 %) 0.507b Female 75 (35.7 %) 19 (32.2 %) 56 (37.1 %) ASA stage I 8 (3.8 %) 4 (6.8 %) 4 (2.6 %) 0.742a, c II 132 (62.9 %) 33 (55.9 %) 99 (65.6 %) III 65 (31.0 %) 21 (35.6 %) 44 (29.1 %) IV 1 (0.5 %) 0 (0.0 %) 1 (0.7 %) Missing data 4 (1.9 %) 1 (1.7 %) 3 (2.0 %)
Tumor site Gastric 152 (72.4 %) 38 (64.4 %) 114 (75.5 %) 0.106b Esophageal 58 (27.6 %) 21 (35.6 %) 37 (24.5 %)
Neoadjuvant therapy N (%) 72 (34.3 %) 16 (27.1 %) 56 (37.1 %) 0.171b Selective decontamination
of the digestive tract
N (%) 177 (84.3 %) 39 (66.1 %) 138 (91.4 %) <0.001b Main operation Total gastrectomy 98 (46.7 %) 26 (44.1 %) 72 (47.7 %) 0.934b
Transhiatal extended gastrectomy 49 (23.3 %) 13 (22.0 %) 36 (23.8 %) Subtotal gastrectomy 21 (10.0 %) 6 (10.2 %) 15 (9.9 %) Merendino procedure 15 (7.1 %) 6 (10.2 %) 9 (6.0 %) Transmediastinal esophagectomy 11 (5.2 %) 3 (5.1 %) 8 (5.3 %) Transthoracic esophagectomy 16 (7.6 %) 5 (8.5 %) 11 (7.3 %) Dindo classification of postoperative complications Grade I 4 (1.9 %) 0 (0.0 %) 4 (2.6 %) <0.001a Grade II 153 (72.9 %) 25 (42.4 %) 128 (84.8 %) Grade IIIa 13 (6.2 %) 7 (11.9 %) 6 (4.0 %) Grade IIIb 20 (9.5 %) 13 (22.0 %) 7 (4.6 %) Grade IVa 12 (5.7 %) 8 (13.6 %) 4 (2.6 %) Grade IVb 1 (0.5 %) 1 (1.7 %) 0 (0.0 %) Grade V 6 (2.9 %) 5 (8.5 %) 1 (0.7 %) Hospitalization (days) 27.5±15.3 37.9±21.1 23.4±9.8 <0.001a Mortality N (%) 7 (3.3 %) 5 (8.5 %) 2 (1.3 %) 0.009b aMann–Whitney test b Chi-square test c
because no CRP values were available. Thus, 210 patients were included in the study.
Inflammatory complications occurred in 59 of the 210 patients (28.1 %; 95 % CI, 22.5–34.5 %). An anastomotic
leakage occurred in fourteen patients (6.7 %; 95 % CI, 3.9–
11.0 %), diagnosed at a median of 7.0 days post-surgery (IQR, 4.0–11.3 days). Thirteen patients developed
pneumo-nia (6.2 %; 95 % CI, 3.6–10.4 %). The distribution of the
inflammatory complications is summarized in Table1. Seven
patients died during hospitalization (in-hospital mortality,
3.3 %, 95 % CI, 1.5–6.9 %).
Table2 compares the baseline, treatment, and outcome
data of the patients with and without inflammatory compli-cations. The patients with inflammatory complications re-ceived selective digestive tract decontamination less often and had a significantly longer hospital stay and a signifi-cantly increased postoperative morbidity and mortality. As a tendency, inflammatory complications occurred more often in patients with esophageal cancer.
Postoperative course of CRP levels
On average, 2.5 CRP values were available for each patient
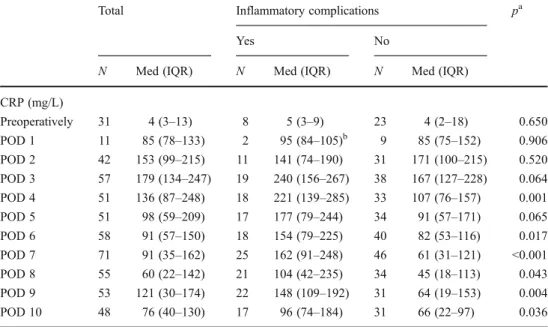
until POD 10. Table3lists the median CRP levels of patients
with and without inflammatory complications. Patients with-out inflammatory complications had the highest CRP values on POD 2 and values decreased thereafter continuously until POD 8. Patients with inflammatory complications reached their peak CRP values one day later (POD 3) but also had a continuous decrease afterwards until POD 8. From POD 3 to POD 10, CRP values of patients with inflammatory compli-cations were clearly higher than the values from patients without inflammatory complications. This difference was
statistically significant for all days except for POD 3 and 5
(p00.064 and p00.065). Multivariate analysis of the CRP
level of patients with PIC showed that tumor site (p00.541),
neoadjuvant therapy (p00.450) and SDD (p00.097, tendency
for lower CRP levels) have no significant influence. Similarly,
for patients without PIC, neoadjuvant therapy (p00.121) and
SDD (p00.106) had no statistically significant influence,
0.0 0.2 0.4 0.6 0.8 1.0 0.0 0.2 0.4 0.6 0.8 1.0
False positive rate (1−Specificity)
True positive rate (Sensitivity)
POD 4 (N=51, AUC=0.77) POD 5 (N=51, AUC=0.66) POD 6 (N=58, AUC=0.70) POD 7 (N=71, AUC=0.81)
Fig. 1 Empirical ROC plots for the diagnostic accuracy of the CRP level for the detection of inflammatory complications. For the postop-erative days 4–7, the sensitivity was plotted over the false positive rate (1−specificity). The greater the area under the curve (AUC), the better the diagnostic accuracy. A marker without predictive value (results by pure chance) would follow the diagonal (gray dotted line) and thus would have an AUC of 0.5. A perfect marker (sensitivity01 and specificity01 for at least one cut-off value) would have an AUC of 1 Table 3 Postoperative course
of the CRP levels
aMann–Whitney test b
Median (range)
Total Inflammatory complications pa
Yes No
N Med (IQR) N Med (IQR) N Med (IQR) CRP (mg/L) Preoperatively 31 4 (3–13) 8 5 (3–9) 23 4 (2–18) 0.650 POD 1 11 85 (78–133) 2 95 (84–105)b 9 85 (75–152) 0.906 POD 2 42 153 (99–215) 11 141 (74–190) 31 171 (100–215) 0.520 POD 3 57 179 (134–247) 19 240 (156–267) 38 167 (127–228) 0.064 POD 4 51 136 (87–248) 18 221 (139–285) 33 107 (76–157) 0.001 POD 5 51 98 (59–209) 17 177 (79–244) 34 91 (57–171) 0.065 POD 6 58 91 (57–150) 18 154 (79–225) 40 82 (53–116) 0.017 POD 7 71 91 (35–162) 25 162 (91–248) 46 61 (31–121) <0.001 POD 8 55 60 (22–142) 21 104 (42–235) 34 45 (18–113) 0.043 POD 9 53 121 (30–174) 22 148 (109–192) 31 64 (19–153) 0.004 POD 10 48 76 (40–130) 17 96 (74–184) 31 66 (22–97) 0.036
although there was a tendency to lower CRP levels. However, the tumor site had a significant influence (p00.002), with increased CRP levels for esophageal cancer.
Diagnostic accuracy of CRP
Based on the area under the ROC curve, CRP had the best diagnostic accuracy on POD 7 (AUC 0.81, 95 % CI, 0.71– 0.91) followed by POD 4 (AUC 0.77, 95 % CI, 0.64–0.91)
(Fig.1). The diagnostic outcome data of CRP for PIC are
summarized in Table 4. The statistically optimal cut-off
value for the CRP level on POD 4 was 141 mg/L, based on data from 51 patients. For this cut-off, the sensitivity is 78 % (14 of 18 patients with complications had a CRP value above the cut-off) and the specificity is 70 % (23 of 33 patients without complications had a CRP value below the
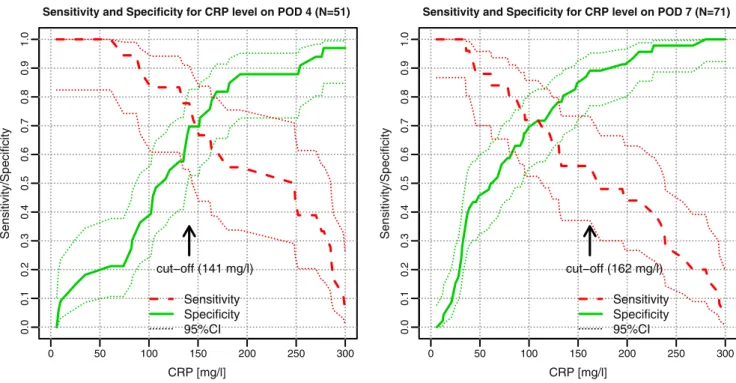
cut-off). Figure2 shows the dependence of sensitivity and
specificity on the cut-off value for POD 4 and 7. Using the
cut-off value of 141 mg/L (95 % CI, 131–278 mg/L) for
POD 4 and after adjusting for the overall prevalence of 28.1 %, the positive predictive value (PPV) was 0.50 (95 %
CI, 0.37–0.63), and the negative predictive value (NPV) was
0.89 (95 % CI, 0.77–0.95). When adjusting for the 25.0 % prevalence of PIC in patients with gastric cancer, the PPV was 0.46 and the NPV was 0.91 in contrast to a PPV of 0.60 and a NPV of 0.85 when adjusting for the 36.2 % prevalence of PIC in patients with esophageal cancer. In multivariate ROC anal-ysis, the diagnostic accuracy of CRP based on the area under the ROC curve was not influenced by tumor site, neoadjuvant therapy, or SDD (p>0.05 for POD 2 to POD 10).
Meta-analysis
Three studies could be identified by a literature search for diagnostic accuracy of CRP after gastroesophageal cancer surgery [10–12]. One study had to be excluded since no diagnostic outcome data were provided [12]. The quality of reporting of the remaining two studies was not optimal; espe-cially the number of true/false negative and positive patients was not provided. Deitmar et al. retrospectively assessed 558 patients with esophageal cancer who underwent an Ivor–Lew-is esophagectomy. Anastomotic leakages occurred in 50 patients (8.9 %). The CRP levels in these 50 patients were compared to 50 randomly chosen patients without this com-plication [10]. Dutta et al. retrospectively analyzed the CRP levels in 136 patients who had undergone esophagogastric cancer resection (about half with gastric cancer). Fifty-four (40 %) patients developed PIC and 17 patients (12.5 %) developed an anastomotic leakage [11]. A meta-analysis for sensitivity and specificity was performed pooling the data
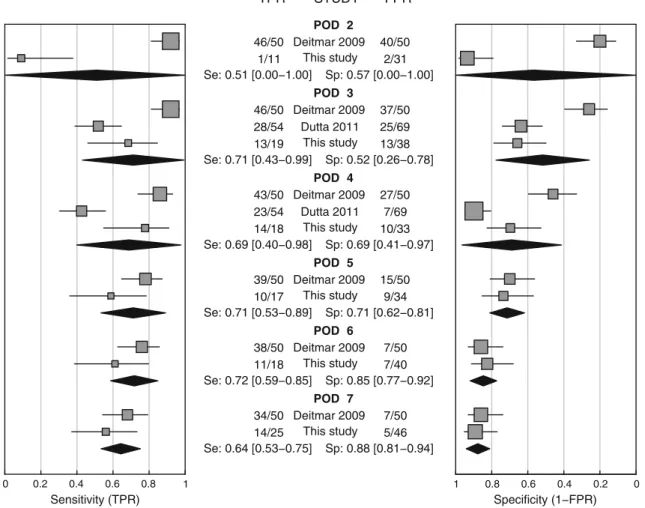
from the studies mentioned above (Table 5) and our data
(Fig.3). The highest sensitivity was found on POD 6 (0.72;
95 % CI, 0.59–0.85), and the highest specificity occurred on Table
4 Diagnostic accuracy of the CRP levels from POD 2 to POD 10 N Prev Cut-off (mg/L) (95 % CI) Sensitivity (95 % CI) Specificity (95 % CI) AUC (95 % CI) pAUC PPV (95 % CI) NPV (95 % CI) TP FN TN FP POD 2 42 0.26 279 (19 –284) 0.09 (0.02 –0.38) 0.94 (0.79 –0.98) 0.57 (0.35 –0.79) 0.520 0.36 (0.23 –0.51) 0.72 (0.57 –0.84) 1 10 29 2 POD 3 57 0.33 201 (175 –264) 0.68 (0.46 –0.85) 0.66 (0.50 –0.79) 0.65 (0.50 –0.81) 0.064 0.44 (0.32 –0.57) 0.84 (0.72 –0.92) 13 6 25 13 POD 4 51 0.35 141 (131 –278) 0.78 (0.55 –0.91) 0.70 (0.53 –0.83) 0.77 (0.64 –0.91) 0.001 0.50 (0.37 –0.63) 0.89 (0.77 –0.95) 14 4 23 10 POD 5 51 0.33 151 (70 –271) 0.59 (0.36 –0.78) 0.74 (0.57 –0.85) 0.66 (0.49 –0.83) 0.065 0.46 (0.34 –0.60) 0.82 (0.69 –0.90) 10 7 25 9 POD 6 58 0.31 140 (83 –195) 0.61 (0.39 –0.80) 0.83 (0.68 –0.91) 0.70 (0.54 –0.86) 0.017 0.58 (0.45 –0.70) 0.84 (0.73 –0.92) 1 1 7 33 7 POD 7 71 0.35 162 (35 –227) 0.56 (0.37 –0.73) 0.89 (0.77 –0.95) 0.81 (0.71 –0.91) <0.001 0.67 (0.55 –0.77) 0.84 (0.73 –0.91) 14 1 1 41 5 POD 8 55 0.38 154 (22 –256) 0.43 (0.24 –0.63) 0.88 (0.73 –0.95) 0.66 (0.52 –0.81) 0.043 0.59 (0.46 –0.71) 0.80 (0.67 –0.88) 9 12 30 4 POD 9 53 0.42 98 (78 –144) 0.86 (0.67 –0.95) 0.61 (0.44 –0.76) 0.73 (0.59 –0.87) 0.004 0.47 (0.34 –0.60) 0.92 (0.81 –0.97) 19 3 19 12 POD 10 48 0.35 73 (42 –182) 0.82 (0.59 –0.94) 0.55 (0.38 –0.71) 0.69 (0.52 –0.85) 0.036 0.42 (0.29 –0.56) 0.89 (0.76 –0.95) 14 3 17 14 Analysis of receiver-operating characteristic (ROC) curves for inflammatory complications N number of patients, Pr ev prevalence of inflammatory complications, cut-of f value for maximized Y ouden's index, AUC area under the ROC curve, pAUC p value of the AUC, PPV positive predictive value, NPV negative predictive value, PPV and NPV are adjusted for the prevalence of 28.1 % in the entire study population, TP true positive, FN false negative, TN true negative, and FP false positive cases Cuf f-of f values, sensitivity , specificity , AUC, PPV , and NPV are provided with 95 % confidence intervals
POD 7 (0.88; 95 % CI, 0.81–0.94). Cochran's Q statistic indicated considerable statistical heterogeneity for sensitivity and specificity on PODs 2, 3, and 4 (p<0.001). Finally, a meta-analysis using the diagnostic odds ratio was performed
(Fig.4). Except for POD 2 (95 % CI includes 1), the
diagnos-tic value of CRP was statisdiagnos-tically significant.
Discussion
This study identified the CRP level as a low to moderately performing marker for PIC from PODs 4 to 7. CRP levels before POD 4 did not have a relevant diagnostic value. A
meta-analysis including two further studies confirmed CRP levels as a marker for PIC on POD 4. POD 4 is the best time point for CRP measurement to monitor the postoperative course after gastroesophageal cancer resection.
The observed morbidity and mortality in the present
study is comparable with those in other reports [3, 23].
Despite conflicting reports about its efficacy, we observed a significantly decreased rate of septic complications after enteral decontamination but no change in the diagnostic
accuracy of CRP [1, 14, 23]. The length of hospital stay
(LOS) in our study was longer than in other reports, prob-ably due to the reimbursement policy in Switzerland favor-ing long hospital stays. Nevertheless, the overall prolonged CRP [mg/l] Sensitivity/Specificity 0 50 100 150 200 250 300 0 50 100 150 200 250 300 0.0 0.1 0.2 0.3 0.4 0.5 0.6 0.7 0.8 0.9 1.0 0.0 0.1 0.2 0.3 0.4 0.5 0.6 0.7 0.8 0.9 1.0 Sensitivity Specificity 95%CI cut−off (141 mg/l)
Sensitivity and Specificity for CRP level on POD 4 (N=51)
CRP [mg/l] Sensitivity/Specificity Sensitivity Specificity 95%CI cut−off (162 mg/l)
Sensitivity and Specificity for CRP level on POD 7 (N=71)
Fig. 2 Sensitivity and specificity of CRP on POD 4 and POD 7. Sensitivity (dashed red line) and specificity (green line) are plotted over all possible cut-off points. The highest Youden's index could be achieved with cut-off values of 141 mg/L for POD 4 (arrow) and 162 mg/L for POD 7
Table 5 Data extracted for meta-analysis
Study POD Data extraction AUC Cut-off [mg/L] nPIC nNo PIC Sensitivity Specificity
Deitmar et al. 2009 [10] 2 Graphically 0.56 135 50 50 0.92 0.20 3 Graphically 0.59 135 50 50 0.92 0.26 4 Graphically 0.66 135 50 50 0.86 0.46 5 Graphically 0.74 135 50 50 0.78 0.70 6 Graphically 0.81 135 50 50 0.76 0.86 7 Graphically 0.77 135 50 50 0.68 0.86 Dutta et al. 2011 [11] 3 Table 0.58 180 54A) 69 0.52 0.64
4 Table 0.66 180 54A) 69 0.43 0.90 a
Thirteen patients with noninfectious complications excluded PIC postoperative inflammatory complications
LOS may be considered advantageous because the detection rate for PIC may be higher.
The present study and meta-analysis identified CRP levels on POD 4 as the earliest time for a relevant diagnostic accu-racy. Although a higher diagnostic accuracy was found at later time points, the early detection of PIC on POD 4 is clinically important for the initiation of an early goal directed therapy to
improve the patients' outcomes [2, 5–8]. Furthermore, the
higher diagnostic accuracy after POD 4 in the present study and the meta-analysis must be interpreted as caused by already present PIC rather than their prediction. This hypothesis is supported by Deitmar et al. [10] who demonstrated that ele-vated CRP levels precede anastomotic leakage after gastro-esophageal surgery by 3 days. When accounting for the median occurrence of leaks at POD 7 in the present study, the diagnostic value of CRP on POD 4 is well explained. As a consequence and when accounting for the clinical context, CRP measurements should be undertaken at POD 4 for a detection of impendent complications. Elevated CRP levels on this day should be followed by further diagnostic measures like thoracic X-rays, upper gastrointestinal series, or CT scans.
In case of a positive finding an early goal-directed therapy of potentially septic patients can performed, ultimately improv-ing the patients' survival [5–8].
CRP is clearly not an optimal marker in particular since it is difficult to distinguish between patients with PIC and patients with a normal acute systemic inflammatory response caused by the operation trauma. The normal acute inflammatory response after surgery causes elevated CRP levels peaking on POD 2 followed by a decrease with a half-life of 19 h [24] as we observed in the control cohort without inflammatory complications. Furthermore, CRP levels vary considerably among patients without inflammatory complications. Thus, the optimal time point of measuring CRP is very important. Still, the diagnostic value of CRP levels was moderate at best. Besides the optimal time for CRP measurement, the correct choice of the threshold is also of great importance. Our cut-off of 141 mg/L CRP on POD 4 corresponds well with the cut-off of Deitmar et al. (135 mg/L) [10]. Dutta et al. [11] reported a considerably higher value of 180 mg/L. All reported cut-off values were in the same range and additionally quite similar to the one (145 mg/L) reported POD 2 Deitmar 2009 This study Se: 0.51 [0.00−1.00] Sp: 0.57 [0.00−1.00] POD 3 Deitmar 2009 Dutta 2011 This study Se: 0.71 [0.43−0.99] Sp: 0.52 [0.26−0.78] POD 4 Deitmar 2009 Dutta 2011 This study Se: 0.69 [0.40−0.98] Sp: 0.69 [0.41−0.97] POD 5 Deitmar 2009 This study Se: 0.71 [0.53−0.89] Sp: 0.71 [0.62−0.81] POD 6 Deitmar 2009 This study Se: 0.72 [0.59−0.85] Sp: 0.85 [0.77−0.92] POD 7 Deitmar 2009 This study Se: 0.64 [0.53−0.75] Sp: 0.88 [0.81−0.94] 46/50 1/11 46/50 28/54 13/19 43/50 23/54 14/18 39/50 10/17 38/50 11/18 34/50 14/25 Sensitivity (TPR) 40/50 2/31 37/50 25/69 13/38 27/50 7/69 10/33 15/50 9/34 7/50 7/40 7/50 5/46 Specificity (1−FPR) 0 0.2 0.4 0.6 0.8 1 1 0.8 0.6 0.4 0.2 0 TPR STUDY FPR
Fig. 3 Forest plot of the sensitivity and specificity of CRP levels from PODs 2 to 7. TPR true positive rate (0sensitivity), FPR false positive rate (01−specificity). Please note inverse scale of the right plot. Se
sensitivity, Sp specificity of the pooled data with 95 % confidence interval in brackets based on a random effects model
in a recent study about CRP levels after colorectal cancer resection [25]. However, as a result of heterogeneity, low sample size, and low diagnostic accuracy in our study, the confidence intervals of our cut-off values were rather large (131–278 mg/L on POD 4), thus our cut-off values can therefore not be transferred to clinical routine.
Since the selection of the cut-off value has a strong influence on sensitivity and specificity, it is difficult to compare these two values in a meta-analysis. We thus also used the diagnostic odds ratio for a meta-analysis, which is less influenced by the choice of the threshold [22]. All studies used for the meta-analysis chose the threshold by statistical optimization proce-dures. This approach is a compromise usually resulting in comparable sensitivity and specificity values. However, the cut-off value can also be chosen by the clinical demands.
The uncertainty of the correct cut-off value simply reflects the low to moderate diagnostic value of CRP levels.
There-fore, CRP cannot be used as a“black-and-white” decision
criterion that performs sufficiently well to correctly predict PIC in clinical practice. Interpretation of CRP levels must be considered in the context of the whole clinical picture. If in doubt, further diagnostic measures should be added to the clinical examination. Since the prevalence of PIC is higher after esophageal than after gastric cancer resection, elevated
CRP levels have to be interpreted accordingly. The postoper-ative decision-making process in patients with elevated CRP levels must account for a higher likelihood of PIC after resec-tion of esophageal cancer compared to gastric cancer.
In the last two decades, other acute phase proteins, par-ticularly procalcitonin (PCT), were extensively investigated as markers for systemic infections [26]. One study of 40 patients after esophageal cancer resection reported PCT as a nearly perfect marker for postoperative infectious complica-tions (AUCs of 0.97) [27]. Another study reported a signif-icantly higher diagnostic value of PCT compared to CRP (AUCs of 0.82 versus 0.68) after cardiac surgery [28]. However, in contrast to initially encouraging results, a recent meta-analysis revealed only a low to moderate diagnostic value of PCT to discriminate patients with sepsis from patients with systemic inflammatory response syndrome [29]. Therefore, it is still questionable that PCT performs much better than CRP in the prediction of PIC. Recently, promising diagnostic values for the cytokine interleukin 6 to predict of PIC after gastric cancer
resection and other major operations were reported [30,31].
Our study has certain limitations. Although morbidity and mortality rates after esophageal and gastric cancer resection differ significantly [2–4], we pooled patients receiving either of these treatments. This pooling may have biased the diagnostic
1 10 20 30 40
Diagnostic odds ratio (DOR)
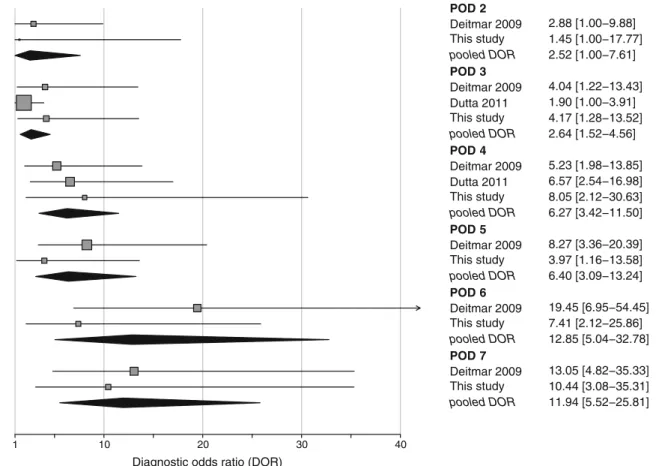
POD 2 Deitmar 2009 2.88 [1.00−9.88] This study 1.45 [1.00−17.77] pooled DOR 2.52 [1.00−7.61] POD 3 Deitmar 2009 4.04 [1.22−13.43] Dutta 2011 1.90 [1.00−3.91] This study 4.17 [1.28−13.52] pooled DOR 2.64 [1.52−4.56] POD 4 Deitmar 2009 5.23 [1.98−13.85] Dutta 2011 6.57 [2.54−16.98] This study 8.05 [2.12−30.63] pooled DOR 6.27 [3.42−11.50] POD 5 Deitmar 2009 8.27 [3.36−20.39] This study 3.97 [1.16−13.58] pooled DOR 6.40 [3.09−13.24] POD 6 Deitmar 2009 19.45 [6.95−54.45] This study 7.41 [2.12−25.86] pooled DOR 12.85 [5.04−32.78] POD 7 Deitmar 2009 13.05 [4.82−35.33] This study 10.44 [3.08−35.31] pooled DOR 11.94 [5.52−25.81]
Fig. 4 Forest plot of diagnostic odds ratios for CRP from PODs 2 to 7. Diagnostic odds ratios (DOR) for CRP from PODs 2 to 7 with pooled (random effects) estimates. Squares represent individual studies and
are provided with 95 % Cis. Diamonds represent the pooled diagnostic odds ratio. The size of the squares is proportional to the weight of the study
values beside a heterogeneous patient cohort with low case numbers, even though multivariate ROC analysis did not indi-cate such a bias. Data were retrieved from a single center cohort over a rather long time of more than 10 years. Hence, incom-plete or biased documentation particularly of the earlier cases cannot be excluded which would result in an underestimation of the inflammatory complications. Except for anastomotic leakage, the time point of initial diagnosis of inflammatory complications was not assessed. We cannot exclude the possi-bility of other forms of bias affecting the selection of patients or the diagnostic performance of CRP. In addition, the meta-analysis suffered from low sample size, low quality of report-ing, and considerable clinical and statistical heterogeneity most likely due to the rather differing proportion of patients with gastric cancer in these studies (0–72 %).
Conclusion
CRP levels on POD 4 have a low to moderate diagnostic performance to predict inflammatory complications. Elevated CRP levels on POD 4 can also be caused by the normal postoperative inflammatory response, thus the interpretation of the CRP levels must be seen in the context of the entire clinical situation.
Sources of financial support or funding None.
Conflicts of interest None.
References
1. Wang D, Kong Y, Zhong B, Zhou X, Zhou Y (2010) Fast-track surgery improves postoperative recovery in patients with gastric cancer: a randomized comparison with conventional postoperative care. J Gastrointest Surg 14:620–627
2. Etoh T, Inomata M, Shiraishi N, Kitano S (2010) Revisional surgery after gastrectomy for gastric cancer: review of the litera-ture. Surg Laparosc Endosc Percutan Tech 20:332–337
3. Farran L, Llop J, Sans M, Kreisler E, Miro M, Galan M, Rafecas A (2008) Efficacy of enteral decontamination in the prevention of anastomotic dehiscence and pulmonary infection in esophagogas-tric surgery. Dis Esophagus 21:159–164
4. Rudiger SJ, Feith M, Werner M, Stein HJ (2000) Adenocarcinoma of the esophagogastric junction: results of surgical therapy based on anatomical/topographic classification in 1,002 consecutive patients. Ann Surg 232:353–361
5. Rivers E, Nguyen B, Havstad S, Ressler J, Muzzin A, Knoblich B, Peterson E, Tomlanovich M (2001) Early goal-directed therapy in the treatment of severe sepsis and septic shock. N Engl J Med 345:1368–1377
6. Puskarich MA, Marchick MR, Kline JA, Steuerwald MT, Jones AE (2009) One year mortality of patients treated with an emergen-cy department based early goal directed therapy protocol for severe
sepsis and septic shock: a before and after study. Crit Care 13: R167
7. Rivers EP (2010) Point: adherence to early goal-directed therapy: does it really matter? Yes. After a decade, the scientific proof speaks for itself. Chest 138:476–480
8. Moller MH, Shah K, Bendix J, Jensen AG, Zimmermann-Nielsen E, Adamsen S, Moller AM (2009) Risk factors in patients surgi-cally treated for peptic ulcer perforation. Scand J Gastroenterol 44 (145–52):2
9. Simon L, Gauvin F, Amre DK, Saint-Louis P, Lacroix J (2004) Serum procalcitonin and C-reactive protein levels as markers of bacterial infection: a systematic review and meta-analysis. Clin Infect Dis 39:206–217
10. Deitmar S, Anthoni C, Palmes D, Haier J, Senninger N, Bruwer M (2009) Are leukocytes and CRP early indicators for anastomotic leakage after esophageal resection? Zentralbl Chir 134:83–89
11. Dutta S, Fullarton GM, Forshaw MJ, Horgan PG, McMillan DC (2011) Persistent elevation of C-reactive protein following esoph-agogastric cancer resection as a predictor of postoperative surgical site infectious complications. World J Surg 35:1017–1025 12. Montagnana M, Minicozzi AM, Salvagno GL, Danese E, Cordiano
C, De Manzoni G, Guidi GC, Lippi G (2009) Postoperative vari-ation of C-reactive protein and procalcitonin in patients with gas-trointestinal cancer. Clin Lab 55:187–192
13. Tetteroo GW, Wagenvoort JH, Castelein A, Tilanus HW, Ince C, Bruining HA (1990) Selective decontamination to reduce gram-negative colonisation and infections after oesophageal resection. Lancet 335:704–707
14. Naf F, Warschkow R, Kolb W, Zund M, Lange J, Steffen T (2010) Selective decontamination of the gastrointestinal tract in patients undergoing esophageal resection. BMC Surg 10:36
15. Dindo D, Demartines N, Clavien PA (2004) Classification of surgical complications: a new proposal with evaluation in a cohort of 6336 patients and results of a survey. Ann Surg 240:205–213 16. Siewert JR, Stein HJ (1998) Classification of adenocarcinoma of
the oesophagogastric junction. Br J Surg 85:1457–1459
17. Hanley JA, McNeil BJ (1982) The meaning and use of the area under a receiver operating characteristic (ROC) curve. Radiology 143:29–36
18. DeLong ER, DeLong DM, Clarke-Pearson DL (1988) Comparing the areas under two or more correlated receiver operating charac-teristic curves: a nonparametric approach. Biometrics 44:837–845 19. DiCiccio TJ, Efron B (1996) Bootstrap confidence intervals. Stat
Sci 11:189–212
20. Janes H, Pepe MS (2008) Adjusting for covariates in studies of diagnostic, screening, or prognostic markers: an old concept in a new setting. Am J Epidemiol 168:89–97
21. DerSimonian R, Laird N (1986) Meta-analysis in clinical trials. Control Clin Trials 7:177–188
22. Glas AS, Lijmer JG, Prins MH, Bonsel GJ, Bossuyt PM (2003) The diagnostic odds ratio: a single indicator of test performance. J Clin Epidemiol 56:1129–1135
23. Schardey HM, Joosten U, Finke U, Staubach KH, Schauer R, Heiss A, Kooistra A, Rau HG, Nibler R, Ludeling S, Unertl K, Ruckdeschel G, Exner H, Schildberg FW (1997) The prevention of anastomotic leakage after total gastrectomy with local decontamination. A pro-spective, randomized, double-blind, placebo-controlled multicenter trial. Ann Surg 225:172–180
24. Pepys MB, Hirschfield GM (2003) C-reactive protein: a critical update. J Clin Invest 111:1805–1812
25. Mackay GJ, Molloy RG, O'Dwyer PJ (2011) C-reactive protein as a predictor of postoperative infective complications following elective colorectal resection. Colorectal Dis 13:583–587 26. Sponholz C, Sakr Y, Reinhart K, Brunkhorst F (2006) Diagnostic
cardiac surgery: a systematic review of the literature. Crit Care 10: R145
27. Ito S, Sato N, Kojika M, Yaegashi Y, Suzuki Y, Suzuki K, Endo S (2005) Serum procalcitonin levels are elevated in esophageal can-cer patients with postoperative infectious complications. Eur Surg Res 37:22–28
28. Aouifi A, Piriou V, Bastien O, Blanc P, Bouvier H, Evans R, Celard M, Vandenesch F, Rousson R, Lehot JJ (2000) Usefulness of procalcitonin for diagnosis of infection in cardiac surgical patients. Crit Care Med 28:3171–3176
29. Tang BM, Eslick GD, Craig JC, McLean AS (2007) Accuracy of procalcitonin for sepsis diagnosis in critically ill patients:
systematic review and meta-analysis. Lancet Infect Dis 7:210– 217
30. Szczepanik AM, Scislo L, Scully T, Walewska E, Siedlar M, Kolodziejczyk P, Lenart M, Rutkowska M, Galas A, Czupryna A, Kulig J (2011) IL-6 serum levels predict postoperative morbidity in gastric cancer patients. Gastric Cancer 14:266– 273
31. Mokart D, Merlin M, Sannini A, Brun JP, Delpero JR, Houvenaeghel G, Moutardier V, Blache JL (2005) Procalcitonin, interleukin 6 and systemic inflammatory response syndrome (SIRS): early markers of postoperative sepsis after major surgery. Br J Anaesth 94:767–773