Article
Temporal Patterns of Alcohol Consumption and
Alcohol-Related Road Accidents in Young Swiss
Men: Seasonal, Weekday and Public Holiday
Effects
Simon Foster
1,*, Gerhard Gmel
2,3,4,5, Natalia Estévez
1, Caroline Bähler
1,
and Meichun Mohler-Kuo
11
Epidemiology, Biostatistics and Prevention Institute, University of Zurich, Zurich, Switzerland,
2Alcohol Treatment
Centre, Lausanne University Hospital CHUV, Lausanne, Switzerland,
3Addiction Switzerland, Lausanne,
Switzerland,
4Centre for Addiction and Mental Health, Toronto, Ontario, Canada, and
5University of the West of
England, Frenchay Campus, Coldharbour Lane, Bristol, UK
*Corresponding author: Epidemiology, Biostatistics and Prevention Institute, University of Zurich, Hirschengraben 84, 8001 Zurich, Switzerland. Tel.: +41-44-634-4622; Fax: +41-44-634-4986; E-mail: simon.foster@uzh.ch
Received 8 July 2014; Revised 11 March 2015; Accepted 30 March 2015
Abstract
Aims: To assess seasonal, weekday, and public holiday effects on alcohol-related road accidents and
drinking diaries among young Swiss men.
Methods: Federal road accident data (35,485 accidents) from Switzerland and drinking diary data
from a large cohort of young Swiss men (11,930 subjects) were analysed for temporal effects by
calendar week, weekday and public holiday (Christmas, New Years, National Day). Alcohol-related
accidents were analysed using rate ratios for observed versus expected numbers of accidents and
proportions of alcohol-related accidents relative to the total number. Drinking diaries were analysed
for the proportion of drinkers, median number of drinks consumed, and the 90th percentile
’s number
of drinks consumed.
Results: Several parallel peaks were identi
fied in alcohol-related accidents and drinking diaries.
These included increases on Fridays and Saturdays, with Saturday drinking extending until early
Sunday morning, an increase during the summer on workdays but not weekends, an increase at
the end of the year, and increases on public holidays and the evening before.
Conclusions: Our results suggest speci
fic time-windows that are associated with increases in
drink-ing and alcohol-related harm. Established prevention measures should be enforced durdrink-ing these
time-windows to reduce associated peaks.
INTRODUCTION
Alcohol is one of the top contributors to the global burden of disease, especially in adolescents and young adults (Rehm et al., 2003,2009, 2010;Toumbourou et al., 2007;Lim et al., 2012). Important features of alcohol consumption and related harm are the temporal patterns with which they occur. Failing to recognize these temporal patterns im-pedes prevention, because special high-risk occasions are missed and
prevention is limited to overall consumption. Whereas targeting overall consumption is necessary and useful (Grube and Stewart, 2004), an intervention strategy that targets overall consumption and high-risk occasions is likely to be more effective (Neighbors et al., 2007).
So far, three types of temporal pattern have been identified. Seasonal patterns have been found in several populations including Scottish adults, the population of Finland and adults in Iowa, with
doi: 10.1093/alcalc/agv037 Advance Access Publication Date: 22 April 2015 Article
summer-time peaks in drinking and related harm (Fitzgerald and Mulford, 1986;Uitenbroek, 1996;Puljula et al., 2007) and a peak in December (Uitenbroek, 1996). In a Spanish population, an increase in September and October was found (Del Rio et al., 2002). Besides seasonality, there is a rather universal weekday pattern, with alcohol intake and alcohol-related harm peaking on Fridays and Saturdays, a pattern identified in various populations including the US population, US college students, the Udmurt Republic, Russia, the Swiss popula-tion, and the Finnish population (Arfken, 1988;Pridemore, 2004; Gmel et al., 2005;Makela et al., 2005;Puljula et al., 2007;Heeb et al., 2008;Finlay et al., 2012). The pattern was often found across age groups and both sexes, though the magnitude of the increase on weekends differed between subpopulations. Finally, public holidays, including Christmas, New Year and national holidays, also were asso-ciated with increases in alcohol intake and related harm (Farmer and Williams, 2005;Makela et al., 2005).
In the present study, we examined the noted temporal patterns in alcohol consumption and alcohol-related road accidents among young men in Switzerland. Young adults are a well-known high-risk population in terms of heavy episodic alcohol consumption and road fatalities, with young men being particularly at risk (Kuntsche et al., 2004;OECD and ECMT, 2006;Toumbourou et al., 2007;Kuntsche and Gmel, 2013;IRTAD, 2014;International Center for Alcohol Pol-icies, 2015). In fact, alcohol use and road accidents have been found to be the leading causes of death in adolescents and young adults in the Western world (OECD and ECMT, 2006;Toumbourou et al., 2007; WHO Regional Office for Europe, 2013). Compared with OECD and European countries, Switzerland can be considered fairly average in terms of the share of alcohol use and accidents in the mortality among young people, the excess of young people’s road fatality risk, and of overall road fatalities per billion vehicle kilometres (OECD and ECMT, 2006;ERSO, 2012;Marmet et al., 2013; IRTAD, 2014, WHO Regional Office for Europe, 2015;WHO 2014).
The current study extends previous studies by incorporating all three types of temporal pattern within one study in a special high-risk group that has not been considered in previous research. In particular, we combined the weekday and seasonal analysis by evaluating sea-sonal patterns separately for workweeks and weekends, allowing us to assess whether the weekday pattern varies over the year. Finally, we combined accident registry data and drinking survey data to assess the convergence between these independent data sources, as such a convergence in temporal patterns provides additional validity for the results and shows to what degree drinking and alcohol-related road accidents are correlated. We expected tofind the usual weekday pat-tern with peaks on weekends, seasonal peaks during the summer and at year’s end, and increases in alcohol consumption and related accidents during public holiday periods.
METHODS
Study design
The study combined independent data from (1) official road accident police reports; and (2) individual survey data on alcohol consumption. (1) Road accident data
Accident data, which included all accidents recorded by Swiss police, were obtained for the years 2009 through 2011 from the Swiss Federal Roads Office (Bundesamt für Strassen ASTRA). Accidents where at least one driver or pedestrian was a man between 17 and 25 years of age were extracted (35,485 accidents). Accidents were defined as
‘involving alcohol’ if the involved male driver or pedestrian was indi-cated to have been alcoholized in the police record (4421 accidents). We redefined ‘a day’ as running from 6:00 a.m. to 6:00 a.m. instead of 00:00 a.m. to 00:00 a.m. in order to attribute early-morning accidents to the preceding evening. Earlier studies have suggested 4:00 a.m. as a cut-off (Gruenewald and Johnson, 2010), but preliminary analyses suggested that this cut-off misses a substantial fraction of alcohol-related accidents.
(2) Survey data on alcohol consumption
Data on individual alcohol consumption were obtained from the ‘Cohort Study on Substance Use Risk Factors in Switzerland’ (C-SURF, approved by the Ethics Committee for Clinical Research of Lausanne University Medical School, Protocol No. 15/07). This study took advantage of the requirement for all Swiss men to present to the army at roughly 19 years old to determine their eligibility for military service. Because there is no pre-selection to army recruiting, a represen-tative sample of the Swiss male population in this age group was eli-gible. As detailed elsewhere (Dermota et al., 2013), conscripts were enrolled on a weekly basis between August 2010 and July 2011.
A short 10-min self-completed questionnaire containing questions on demographics, alcohol and other substance use was administered to all conscripts during their routine check-up. Individuals were told they could discontinue the questionnaire at any time. Of a total of 14,393 young men who presented to the recruitment centres during the study-recruitment period, 1829 (12.7%) were never seen by the re-search staff because they either were sick (not chronically ill) or not in-formed about the study by military staff. Of the 12,564 inin-formed conscripts, 11,930 (95.0%) completed the short questionnaire. The participants’ mean age was 19.95 ± 1.24 and 62% were younger than 20. Slightly more than half (51.1%) came from the French-speaking part of Switzerland, and nearly 60% lived in a rural area. Most respon-dents were still in some educational programmes, with roughly 63% reporting primary school as their highest achieved level of education.
The short questionnaire contained a drinking diary, in which participants were asked to indicate the number of standard drinks they had consumed over the preceding 7 days. They were provided with a row for each weekday (Monday to Sunday) and with pictures of standard drinks for various beverage types, each containing ∼10–12 g of alcohol. Three weeks were inserted using the C-SURF study’s baseline survey data to achieve a complete calendar year (weeks of 2010-12-20, 2011-08-01, 2011-08-08).
Statistical analyses
Three major national holidays were analysed: Christmas, New Year’s Day and National Day (August 1). For each holiday period, we calcu-lated rate ratios (O/E) for the holiday, the evening before, and the 3 days following by dividing the observed by the expected number of alcohol-related accidents (Makela et al., 2005). The expected number was calculated by dividing the total number of alcohol-related acci-dents reported over the study period by the number of days in the study period, multiplied by the number of times that a particular day occurred within that study period (Makela et al., 2005). We also calculated the proportions of alcohol-related relative to the total number of accidents. Finally, for each day we calculated the pro-portion of drinkers in the drinking diary, and the median number of drinks and the 90th percentile number of drinks within drinkers to as-sess the amount of drinking separately for average and heavy drinking. For analysing weekday patterns, we calculated analogue rate ratios and proportions for alcohol-related accidents, as well as the diary
measures for each weekday. For seasonal analyses, we calculated rate ratios and proportions of accidents separately for the workweek (Mondays–Thursdays) and weekend (Fridays–Sundays) for each calendar week, and averaged the diary measures for Mondays –Thurs-days and Fri–Thurs-days–Sundays. Accident and diary measures were plotted by calendar week and superimposed against the Loess scatter-plot smoother (α = 0.5) to identify any overall trends and calculate corre-sponding estimates of the measures for each calendar week (Cleveland, 1994). We chose the smoothing spanα so as to make sure that there was no relationship anymore between calendar weeks and the residuals generated by the loess algorithm and, hence, the smoother depicted the data trend correctly (Cleveland, 1994).
Finally, we used Pearson’s correlation coefficients to assess two kinds of relationship. First, we correlated the rate ratios of alcohol-related accidents with the proportions of alcohol-alcohol-related accidents. Comparing rate ratios to proportions indicated whether peaks in the number of alcohol-related accidents (i.e. higher rate ratios) coincided with an increased proportion of alcohol-related accidents or merely reflected a general increase in the number of accidents. Second, we cor-related the rate ratios of alcohol-cor-related accidents with each of the three measures derived from the diaries (the proportion of drinkers, the median number of drinks, and the 90th percentile number of drinks). These correlations indicated whether alcohol-related accidents and the diary drinking variables exhibited similar temporal patterns.
RESULTS
Holiday periods
Alcohol-related accidents increased during all three holiday periods (Table1). In general, alcohol-related accidents were highest on the holiday eves and decreased over the 3 days after the holiday. For
New Year, the increase on New Year’s Day itself was equal to the in-crease on New Year’s Eve. An additional analysis showed that 64% of alcohol-related accidents on New Year’s Day occurred between 6:00 and 10:00 a.m., and were thus presumably related to New Year’s Eve drinking. The proportions of alcohol-related accidents increased largely in parallel with the rate ratios: correlating the rate ratios with the proportions across all three holiday periods revealed a correlation of r = 0.94 (P < 0.0001).
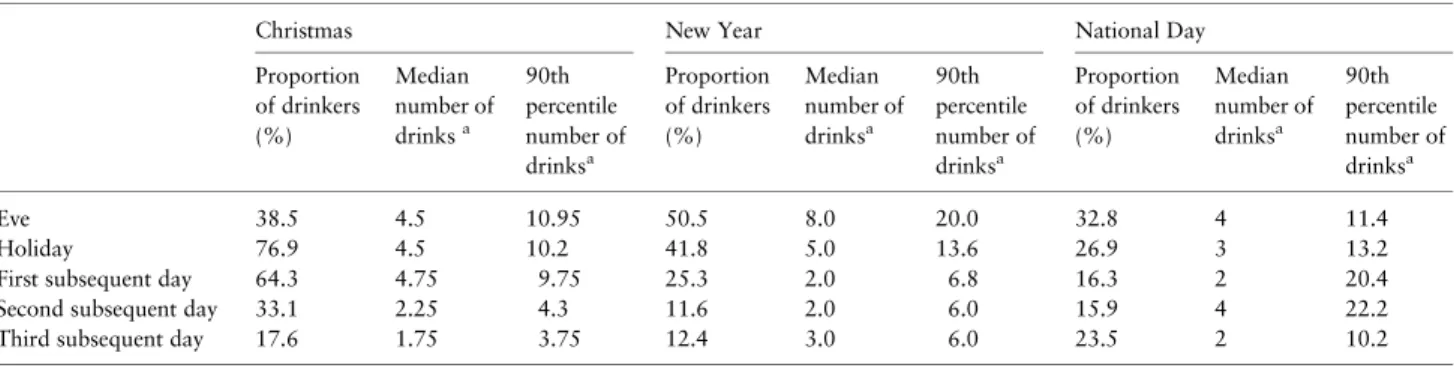
Diary data generally confirmed the picture identified for accidents, albeit less pronounced (Table2). The Christmas period was associated with increased proportions of drinkers and amount of drinks con-sumed starting Christmas Eve and extending to the day after Christ-mas. At New Year, increases in all drinking measures were found for New Year’s Eve and New Year’s Day. For 1 August the picture was least consistent, with the evening of 31 July clearly associated with an increased proportion of drinkers and increased numbers of drinks. The highest number of drinks at the 90th percentile level, however, was on 2 and 3 August.
The correlations between the rate ratios of alcohol-related accidents and the diary variables across all holiday periods were indicative of similar temporal patterns. The correlation between rate ratios and the proportion of drinkers was r = 0.50 (P = 0.056); r = 0.73 (P = 0.002) between the rate ratios and the median number of drinks; and r = 0.27 (P = 0.33) between the rate ratios and 90th percentile number of drinks. The last correlation was mainly low due to the unusually high values in the 90th percentile number of drinks on 2 and 3 August (Table2) and was r = 0.77 (P = 0.002) when excluding these dates.
Weekday patterns
Rate ratios for alcohol-related accidents revealed a clear pattern, with peaks on Friday and Saturday and the highest peak on Saturdays
Table 2. Alcohol consumption during public holiday periods in young Swiss men
Christmas New Year National Day
Proportion of drinkers (%) Median number of drinksa 90th percentile number of drinksa Proportion of drinkers (%) Median number of drinksa 90th percentile number of drinksa Proportion of drinkers (%) Median number of drinksa 90th percentile number of drinksa Eve 38.5 4.5 10.95 50.5 8.0 20.0 32.8 4 11.4 Holiday 76.9 4.5 10.2 41.8 5.0 13.6 26.9 3 13.2
First subsequent day 64.3 4.75 9.75 25.3 2.0 6.8 16.3 2 20.4 Second subsequent day 33.1 2.25 4.3 11.6 2.0 6.0 15.9 4 22.2 Third subsequent day 17.6 1.75 3.75 12.4 3.0 6.0 23.5 2 10.2
aWithin drinkers.
Table 1. Alcohol-related road accidents during public holiday periods in young Swiss men
Christmas New year National day
O/E O % totala O/E O % totala O/E O % totala
Eve 1.81 22 23.9 1.98 16 23.9 1.90 23 21.5
Holiday 0.99 12 13.3 2.06 25 33.8 1.32 16 17.6
First subsequent day 1.07 13 17.1 0.99 12 14.1 0.58 7 9.7 Second subsequent day 0.82 10 16.7 0.41 5 6.6 0.49 6 10.7 Third subsequent day 0.49 6 7.3 0.49 6 9.8 0.41 5 6.5 E: (accidents/days) ×3b 12.12 12.12 12.12
E, expected frequency of accidents; O, observed frequency of accidents; O/E, ratio of observed vs. expected frequency of accidents
aProportion of alcohol-related accidents relative to the total number of accidents on that day.
(Table3). From Monday to Saturday, the rate ratios of alcohol-related accidents increased from 0.32 to 2.30 (Table3). The proportions of alcohol-related accidents demonstrated the same peaks on Friday and Saturday. Comparing Mondays to Saturdays, the proportions increased by a factor of 4.5 from 4.8 to 21.7% (Table3).
In contrast to the rate ratios, the proportion remained somewhat high-er on Sundays relative to workdays. An additional analysis revealed, how-ever, that 45.5% of alcohol-related accidents on Sundays occurred between 6:00 a.m. and 9:00 a.m. (versus 8.7% on Saturdays and 2.9% on Fridays). Thus, a substantial portion of Sunday accidents were likely related to Saturday drinking that extended well into Sunday mornings.
The same weekday pattern was observed in the drinking diaries, identified across all drinking measures (Table3). Comparing Mondays versus Saturdays, the proportion of drinkers increased by a factor of 5.7, from 9.9 to 56.4%; the median number of drinks by a factor of 2.5, from 2.0 to 5.0; and the 90th percentile number of drinks by a factor of 2.2, from 6.7 to 15.0 (Table3). Finally, the observation that Sundays were generally close to workday levels in the diary variables supports the conjecture that the increase in alcohol-related accidents on Sundays reported above was due to Saturday drinking.
Seasonal patterns
The workweek rate ratios of alcohol-related accidents exhibited a summer-time peak, from around mid-May until the end of August (Fig.1a). The same pattern was found for proportions (Fig.1b). The lowest rate ratios, as predicted by the Loess algorithm, were found in calendar weeks 12 (end of March, rate ratio = 0.84) and 42 (mid-October, rate ratio = 0.82), whereas the peak was found in calendar week 26 (end of June, rate ratio = 1.22). Similarly, the lowest Loess-predicted proportions of alcohol-related accidents were found in calendar weeks 13 ( proportion = 5.7%) and 42 ( proportion = 4.9%), whereas the peak was found in calendar week 27 ( proportion = 7.8%). The summer-time peak partly coincided with the National Day period (indicated by triangles in Fig.1a and b).
In addition, there was a peak for both the rates and proportions at the end of the year, in calendar weeks 51 and 52 (Fig.1a and b). These weeks included the Christmas and New Years’ period (indicated by triangles in Fig.1a and b).
Correlating the trend line of rate ratios with the trend line of pro-portions of alcohol-related accidents confirmed high correspondence of these temporal trends (r = 0.94, P < 0.0001).
The weekend rate ratios and proportions for alcohol-related acci-dents demonstrated no consistent seasonal patterns (Fig.1c and d). Accordingly, correlating the trend lines of rate ratios and proportions indicated a smaller correspondence than identified for workweek acci-dents (r = 0.65, P < 0.0001, versus r = 0.94 reported above).
In the diary data, the summer-time peak was evident for all work-week drinking measures (Fig.2a–c). Peaks in calendar weeks 51 and
52 were observed in both the proportion of drinkers and median num-ber of drinks. The seasonal pattern of workweek drinking thus paral-leled the seasonal pattern of workweek alcohol-related accidents. This was indicated by correlations as well. Correlating the trend lines of workweek rate ratios of alcohol-related accidents and proportions of drinkers in the diary revealed r = 0.80 (P < 0.0001); the correlation be-tween the rate ratio trend line and the median number of drinks trend line was r = 0.71 (P < 0.0001); and the correlation between the rate ratio trend line and the 90th percentile number of drinks trend line was r = 0.39 (P = 0.0043). The last correlation was 0.62 (P < 0.0001) when excluding calendar weeks 51 and 52, however, as these weeks were not associated with a peak in the 90th percentile (the other cor-relations remained roughly the same: 0.82 and 0.66, P’s < 0.0001). As observed for accident data, the National holiday, Christmas and New Year’s periods coincided with seasonal peaks, albeit less consistently (triangles in Fig.2a–c).
As for accidents, the patterns for weekend drinking variables exhibited no uniform pattern (Fig.2d–f). The correlations of the trend line of the rate ratios of alcohol-related accidents were 0.31 (P = 0.024) with the trend line of the proportion of drinkers, r =−0.40 (P = 0.0034) with the trend line of the median number of drinks, and r = 0.53 (P = 0.00062) with the trend line of the 90th percentile number of drinks.
DISCUSSION
In the present study, we analysed federal road accident registry data from Switzerland and drinking diaries from a large cohort of young Swiss men for temporal effects by calendar weeks, weekdays and pub-lic holidays (Christmas, New Years, National Day). We identified evi-dence for several temporal peaks that are manifest simultaneously in road accidents and drinking diaries. These included peaks (a) during workweeks in the summer and at the end of the year, but not during weekends; (b) on Fridays and Saturdays, with Saturday drinking ex-tending until early Sunday morning; and (c) on the evenings preceding public holidays and the holidays themselves.
Our results suggest an increase in drinking during the summer, in line with previous studies from different populations (Fitzgerald and Mulford, 1986;Uitenbroek, 1996;Puljula et al., 2007). However, we found this seasonal effect to be specific: weekend consumption of alcohol did not vary systematically across the year, but workday drinking increased in the summer. The workweek increase was mani-fested by an increased proportion of young men who consumed alco-hol, as well as by an increased number of consumed drinks. Furthermore, the increase in consumption coincided with a higher number of alcohol-related road accidents. It seems that the increase in alcohol-related accidents was not simply due to a larger travel ra-dius or the increased use of cars. Rather, as indicated by the parallel Table 3. Alcohol-related road accidents and alcohol consumption on different weekdays in young Swiss men
Monday Tuesday Wednesday Thursday Friday Saturday Sunday O/E rate ratio of alcohol-related accidents 0.32 0.35 0.50 0.66 2.04 2.30 0.81 Proportion of alcohol-related accidents 4.8 5.1 6.8 8.4 18.7 21.7 14.3 Proportion of drinkers 9.9 11.8 10.8 15.0 44.7 56.4 21.2 Median number of drinksa 2.0 2.0 2.0 2.0 4.0 5.0 2.0
90th percentile number of drinksa 6.7 6.0 8.0 10.0 13.0 15.0 7.0
E, expected frequency of accidents; O, observed frequency of accidents; O/E, observed vs. expected frequency of alcohol-related accidents.
increase in the proportion of alcohol-related accidents, our results sug-gest that it is increased alcohol intake that drives the summer-time peak in accidents.
A likely explanation for the lack of a seasonal effect in weekend drinking is that the number of drinks consumed on weekends was already high even among average drinkers. Therefore, there was much more room for heavier drinking during workdays than on week-ends. Thus, if summer time induces an increase in drinking, this is like-ly to happen during the workweek (which comes to resemble weekend consumption) rather than further increasing already-high weekend consumption.
More generally, seasonal effects in alcohol intake are likely to depend on the drinking style of the studied population. In our study, the summer-time increase occurred in the low-consumption portion of the drinking style (i.e. workweeks), whereas there was no evidence of any change in the high-consumption portion (i.e. weekends). This pattern of change is compatible with the previous observation that seasonal peaks are due to the superimposition of additional drinking on a stable drinking style, rather than to the
substitution of one drinking style with another (Fitzgerald and Mulford, 1986).
Besides the noted modification during summer time, our results agree with previous studies demonstrating a weekday pattern with peaks in alcohol intake and alcohol-related harm on Fridays and Satur-days in various populations (Arfken, 1988;Pridemore, 2004;Gmel et al., 2005;Makela et al., 2005;Puljula et al., 2007;Heeb et al., 2008;Finlay et al., 2012). The weekend drinking sessions extended until the early morning, especially on Sundays, and were characterized by heavy amounts of drinking even for average drinkers (five standard drinks,Courtney and Polich, 2009). Furthermore, the identified week-end increases were rather pronounced, with the proportions of drinkers increasing from about 10% on Mondays to 56% on Saturdays, and about a doubling of the amount of drinking and alcohol-related acci-dents. This suggests that heavy weekend drinking is a predominant drinking style of young Swiss men (Heeb et al., 2008;Kuntsche and Gmel, 2013), a young adult drinking style that has also been identified in other countries (Parker and Williams, 2003;Van Wersch and Walker, 2009). In contrast, in older adults, the weekend peak was found to be
Fig. 1. Alcohol-related road accidents across a calendar year in young Swiss men. Trends of rate ratios (O/E) and proportions of alcohol-related accidents by young Swiss men across a calendar year, separating workdays (Monday—Thursday) and weekends (Friday—Sunday). (a and b) workweek and (c and d) weekend results. Triangles indicate calendar weeks that are associated with a public holiday period. Jan, January; Mar, March; May, May; Jul, July; Sep, September; Nov, November.
smaller in previous studies (Makela et al., 2005), and proportions of drinkers during the workweek were often higher, whereas the amount of drinking was lower (Heeb et al., 2008;Kuntsche and Gmel, 2013). Finally, our results are consistent with earlier studies indicating effects of public holidays across different populations (Farmer and Williams, 2005;Makela et al., 2005). Overall, alcohol consumption and alcohol-related accidents were most common on the evening prior to actual holidays, and declined afterwards. In line with a previ-ous study from Scotland (Uitenbroek, 1996), Christmas and New Year’s both appeared to be involved in the end-of-year seasonal peak.
Implications for prevention measures
Our results suggest specific time windows wherein well-established prevention measures should be enforced. Because enforcement is re-source demanding, tailoring enforcement for particular groups and to the‘hot spots’ of drinking and drink-driving is necessary (Kaplan and Prato, 2007;International Center for Alcohol Policies, 2015). Temporal peaks are one aspect of such hot spots; another important aspect is the geographical distribution of drinking and drink-driving. Future efforts should be made to combine these different aspects and develop models predicting the occurrence of heavy drinking and alcohol-related road accidents as precisely as possible. Prevention measures of established empirical effectiveness include driver breath testing (Shults et al., 2001; Fell et al., 2004), maximum alcohol blood concentration laws (Shults et al., 2001;Fell and Voas, 2006), minimum drinking age laws (Shults et al., 2001;Grube and Stewart, 2004;Callaghan et al., 2014), dram shop liability (Grube and Stewart, 2004;Rammohan et al., 2011), server training programs (Shults et al., 2001), restricting special promotions and price discounts (Kuo et al.,
2003), and the combination of such measures in multi-component programs (Shults et al., 2009). In addition, information campaigns around holidays might enhance prevention (Makela et al., 2005; Neighbors et al., 2007).
There are, however, limiting factors that must be considered. In particular, the enforcement of drink-driving laws has been found to have only a lasting effect if it reaches a minimal intensity, is highly vis-ible, and is sustained (Mann et al., 2001;Fell et al., 2008,2014,2015). Furthermore, the cost-effectiveness of enforcement might be low if the baseline prevalence of drinking and drink-driving is already low or the enforcement intensity is already high (Veisten et al., 2013). The SARTRE-4 survey in Europe has indeed shown that both drink-driving and enforcement intensity vary substantially across Europe, although drivers are generally aware of the risk associated with drink-driving (Antov et al., 2012). Thus, additional enforcement may not show benefits in every country. Considering our study population, young Swiss men, targeted enforcement could be effective, as (a) men are well-known to be less likely to adhere to driving laws than women (Vardaki and Yannis, 2013; IRTAD, 2014; Scott-Parker et al., 2014) and (b) the intensity of enforcement of drink-driving pol-icies in Switzerland was found to be below the European average (WHO, 2013).
Strengths and limitations
The study’s strengths are that (a) it combined seasonal, weekday, and public holiday effects in one study, showing how weekday and sea-sonal patterns interlock; (b) it used data from two independent data sources that were found to converge, providing additional validity for the results; (c) it was based upon reliable data, with drinking
Fig. 2. Alcohol consumption across a calendar year in young Swiss men. Trends of proportions of drinkers, median number of drinks, and 90th percentile number of drinks (within drinkers) across a calendar year in young Swiss men, separating workdays (Monday—Thursday) and weekends (Friday—Sunday). (a–c) workweek and (d–f) weekend results. Triangles indicate calendar weeks associated with a public holiday period. Jan, January; Mar, March; May, May; Jul, July; Sep, September; Nov, November.
diary data drawn from a large cohort that included almost 83% of the study population, and registry data for road accidents.
The results must be considered with the following limitations. First, our results are specific to young Swiss men. Second, despite the large sample for the diary data, French-speaking Swiss were over-represented relative to German-speaking Swiss. We did notfind, how-ever, any indication of substantial differences in the temporal effects between German and French-speaking regions (data not shown). Third, the classification of accidents as ‘alcohol-related’ was not entirely conclusive, because some accidents had missing information on relevant indicators; these behaved consistently like non-alcohol accidents, however (data not shown). Fourth, three calendar weeks had to be inserted from the cohort’s baseline data for seasonal and holiday analysis of drinking diaries, potentially introducing self-selection bias in these weeks. Finally, despite the convergence of two independent data sources and the correlations between rate ratios and proportions of alcohol-related accidents, the study design itself does not allow for causal inference.
CONCLUSIONS
Our results suggest several types of temporal effect that include in-creased drinking and alcohol-related accidents on Fridays and Satur-days through early Sunday morning, during workweeks in the summer, at the end of the year, and around public holidays. Estab-lished prevention measures should be enforced during these time-windows to reduce the associated peaks in alcohol consumption and related harm.
ACKNOWLEDGEMENTS
We are grateful to Charlotte Eidenbenz and Petra Dermota for project manage-ment and study coordination.
FUNDING
This work wasfinancially supported by the Swiss National Science Foundation (FN33CS30_139467). The funder had no role in study design, data collection, data analysis, data interpretation, preparation of the manuscript or decision to publish.
CONFLICTS OF INTEREST STATEMENT
None declared.
REFERENCES
Antov D, Banet A, Barbier C, et al. (2012) European road users’ risk perception and mobility. The SARTRE 4 survey. In Cestac J, Delhomme P (eds), European Road Users Risk Perception and Mobility. The SARTRE 4 Survey. Available:http://www.attitudes-roadsafety.eu/home/results/?tx_airfile manager_pi1%5Bpath%5D=Results%2FSARTRE4%3A%20Publications %2FAnalyses%20reports(13 October 2014, date last accessed).
Arfken CL. (1988) Temporal pattern of alcohol consumption in the United States. Alcohol Clin Exp Res12:137–42.
Bundesamt für Strassen ASTRA Strassenverkehrsunfall-Statistik [Road acci-dents registry].
Callaghan RC, Sanches M, Gatley JM, et al. (2014) Impacts of drinking-age laws on mortality in Canada, 1980–2009. Drug Alcohol Depend 138:137–45. Cleveland WS. (1994) The Elements of Graphing Data. Summit, New Jersey:
Hobart Press.
Courtney KE, Polich J. (2009) Binge drinking in young adults: data, definitions, and determinants. Psychol Bull135:142–56.
Del Rio MC, Prada C, Alvarez FJ. (2002) Drinking habits throughout the sea-sons of the year in the Spanish population. J Stud Alcohol63:577–80. Dermota P, Wang J, Dey M, et al. (2013) Health literacy and substance use in
young Swiss men. Int J Public Health58:939–48.
ERSO European Road Safety Observatory. (2012) Traffic safety basic facts 2012. Young people (aged 18–24). Available: http://ec.europa.eu/ transport/road_safety/pdf/statistics/dacota/bfs2012_dacota-ntua-young_ people.pdf(16 October 2014, date last accessed).
Farmer CM, Williams AF. (2005) Temporal factors in motor vehicle crash deaths. Inj Prev11:18–23.
Fell JC, Voas RB. (2006) The effectiveness of reducing illegal blood alcohol con-centration (BAC) limits for driving: evidence for lowering the limit to .05 BAC. J Safety Res37:233–43.
Fell JC, Lacey JH, Voas RB. (2004) Sobriety checkpoints: evidence of effective-ness is strong, but use is limited. Traffic Inj Prev 5:220–7.
Fell JC, Tippetts AS, Levy M. (2008) Evaluation of seven publicized enforce-ment demonstration programs to reduce impaired driving: Georgia, Louisi-ana, Pennsylvania, Tennessee, Texas, IndiLouisi-ana, and Michigan. Ann Adv Automot Med52:23–38.
Fell JC, Waehrer G, Voas RB, et al. (2014) Effects of enforcement intensity on alcohol impaired driving crashes. Accid Anal Prev73:181–6.
Fell JC, Waehrer G, Voas RB, et al. (2015) Relationship of impaired-driving en-forcement intensity to drinking and driving on the roads. Alcohol Clin Exp Res39:84–92.
Finlay AK, Ram N, Maggs JL, et al. (2012) Leisure activities, the social week-end, and alcohol use: evidence from a daily study offirst-year college stu-dents. J Stud Alcohol Drugs73:250–9.
Fitzgerald JL, Mulford HA. (1986) Drinking frequency changes in selected con-texts by season in Iowa, 1979–1980. J Stud Alcohol 47:311–5.
Gmel G, Heeb JL, Rezny L, et al. (2005) Drinking patterns and traffic casualties in Switzerland: matching survey data and police records to design preventive action. Public Health119:426–36.
Grube JW, Stewart K. (2004) Preventing impaired driving using alcohol policy. Traffic Inj Prev 5:199–207.
Gruenewald PJ, Johnson FW. (2010) Drinking, driving, and crashing: a traf fic-flow model of alcohol-related motor vehicle accidents. J Stud Alcohol Drugs 71:237–48.
Heeb JL, Gmel G, Rehm J, et al. (2008) Exploring daily variations of drinking in the Swiss general population. A growth curve analysis. Int J Methods Psychiatr Res17:1–11.
International Center for Alcohol Policies. (2015) Module 15—Drinking and driving. Available:http://www.icap.org/PolicyTools/ICAPBlueBook/Blue BookModules/15DrinkingandDriving/tabid/175/Default.aspx(22 January 2015, date last accessed).
IRTAD The International Traffic Safety Data and Analysis Group. (2014) Road safety annual report 2014. Available:http://www.oecd-ilibrary.org/doc server/download/7514011e.pdf?expires=1424452737&id=id&accname= guest&checksum=F5E517B4A47A3F6B32FB90159DA99E9D(8 October 2014, date last accessed).
Kaplan S, Prato CG. (2007) Impact of BAC limit reduction on different popula-tion segments: a Poissonfixed effect analysis. Accid Anal Prev 39:1146–54. Kuntsche E, Gmel G. (2013) Alcohol consumption in late adolescence and early
adulthood—where is the problem? Swiss Med Wkly 143:w13826. Kuntsche E, Rehm J, Gmel G. (2004) Characteristics of binge drinkers in
Europe. Soc Sci Med59:113–27.
Kuo M, Wechsler H, Greenberg P, et al. (2003) The marketing of alcohol to college students: the role of low prices and special promotions. Am J Prev Med25:204–11.
Lim SS, Vos T, Flaxman AD,, et al. (2012) A comparative risk assessment of burden of disease and injury attributable to 67 risk factors and risk factor clusters in 21 regions, 1990–2010: a systematic analysis for the Global Bur-den of Disease Study 2010. Lancet380:2224–60.
Makela P, Martikainen P, Nihtila E. (2005) Temporal variation in deaths related to alcohol intoxication and drinking. Int J Epidemiol34:765–71.
Mann RE, Macdonald S, Stoduto LG, et al. (2001) The effects of introducing or lowering legal per se blood alcohol limits for driving: an international re-view. Accid Anal Prev33:569–83.
Marmet S, Gmel G, Gmel G, et al. (2013) Alcohol-Attributable Mortality in Switzerland Between 1997 and 2011. Lausanne: Addiction Suisse. Neighbors C, Walters ST, Lee CM, et al. (2007) Event-Specific prevention:
ad-dressing college student drinking during known windows of risk. Addict Behav32:2667–80.
OECD Organisation for Economic Co-Operation and Development, ECMT European Conference Of Ministers Of Transport. (2006) Young Drivers. The Road to Safety. Available:http://www.internationaltransportforum. org/jtrc/safety/YoungDrivers.html(8 October 2014, date last accessed). Parker H, Williams L. (2003) Intoxicated weekends: young adults’ work hard–
play hard lifestyles, public health and public disorder. Drugs Educ Prev Policy10:345–67.
Pridemore WA. (2004) Weekend effects on binge drinking and homicide: the so-cial connection between alcohol and violence in Russia. Addiction99: 1034–41.
Puljula J, Savola O, Tuomivaara V, et al. (2007) Weekday distribution of head traumas in patients admitted to the emergency department of a city hos-pital: effects of age, gender and drinking pattern. Alcohol Alcohol42:474–9. Rammohan V, Hahn RA, Elder R, et al. (2011) Effects of dram shop liability and enhanced overservice law enforcement initiatives on excessive alcohol consumption and related harms: two community guide systematic reviews. Am J Prev Med41:334–43.
Rehm J, Room R, Graham K, et al. (2003) The relationship of average volume of alcohol consumption and patterns of drinking to burden of disease: an over-view. Addiction98:1209–28.
Rehm J, Mathers C, Popova S, et al. (2009) Global burden of disease and injury and economic cost attributable to alcohol use and alcohol-use disorders. Lancet373:2223–33.
Rehm J, Baliunas D, Borges GL, et al. (2010) The relation between different di-mensions of alcohol consumption and burden of disease: an overview. Addiction105:817–43.
Scott-Parker B, Watson B, King MJ, et al. (2014)‘I drove after drinking alcohol’ and other risky driving behaviours reported by young novice drivers. Accid Anal Prev70:65–73.
Shults RA, Elder RW, Sleet DA, et al. (2001) Reviews of evidence regarding inter-ventions to reduce alcohol-impaired driving. Am J Prev Med21:66–88. Shults RA, Elder RW, Nichols JL, et al. (2009) Effectiveness of multicomponent
programs with community mobilization for reducing alcohol-impaired driving. Am J Prev Med37:360–71.
Toumbourou JW, Stockwell T, Neighbors C, et al. (2007) Interventions to reduce harm associated with adolescent substance use. Lancet369:1391–401. Uitenbroek DG. (1996) Seasonal variation in alcohol use. J Stud Alcohol57:47–52. Van Wersch A, Walker W. (2009) Binge-drinking in Britain as a social and cul-tural phenomenon: the development of a grounded theoretical model. J Health Psychol14:124–34.
Vardaki S, Yannis G. (2013) Investigating the self-reported behavior of drivers and their attitudes to traffic violations. J Safety Res 46:1–11.
Veisten K, Houwing S, Mathijssen MP, et al. (2013) Is law enforcement of drug-impaired driving cost-efficient? An explorative study of a methodology for cost-benefit analysis. Int J Drug Policy 24:122–34.
WHO World Health Organization. (2013) Global status report on road safety 2013: supporting a decade of action. Available:http://www.who.int/ violence_injury_prevention/road_safety_status/2013/en/(22 January 2015, date last accessed).
WHO World Health Organization. (2014) Global status report on alcohol and health 2014. Available:http://apps.who.int/iris/bitstream/10665/112736/1/ 9789240692763_eng.pdf?ua=1(22 January 2015, date last accessed). WHO World Health Organization Regional Office For Europe. (2013) Status
report on alcohol and health in 35 European countries 2013. Available:
http://www.euro.who.int/__data/assets/pdf_ file/0017/190430/Status-Report-on-Alcohol-and-Health-in-35-European-Countries.pdf(23 January 2015, date last accessed).
WHO World Health Organization Regional Office For Europe. (2015) European detailed mortality database. Available: http://data.euro.who.int/dmdb/