Picoliter Cell Volume Potentiometric Detector
for Open-Tubular Column LC*
Andreas Manz and Wilhelm Simon
Department of Organic Chemistry, Swiss Federal Institute of Technology (ETH), 8092 Zlirich, Switzerland
Abstract
A detector for open-tubular column liquid chromatography
based on an ion-selective microelectrode cell assembly is described. The microelectrode with tip diameter of approx-imately 1 Mm is directly inserted into the downstream col-umn end. Estimated detector cell volumes are about 10~14 I (25-^m i.d. column). Experimental evidence is presented that proves the cell volume to be smaller than 5 x 10~101. The detection system should be adequate for open-tubular columns with an inner diameter > 5 ^m.
Some interesting approaches to low dead-volume detectors have been reported. These include UV detectors (18,19), laser fluorimetry (20), sheath flow fluorimetric detection (21), free-falling drop detectors (22), on-column optical detectors (12,13,23), and miniaturized electrochemical detectors (24). Cell volumes as small as 0.06 nl have been obtained (2). Although ion-selective electrodes (ISE) have been used for the detection in LC (25-27), the dead-volumes are too large for use with small bore open-tubular columns.
In this paper, a report is presented on the use of ion-selective microelectrodes as detectors of extremely small dead-volume in open-tubular column LC.
Introduction
There is growing interest in the use of columns of small in-ner diameter for liquid chromatography (LC) (1). In particular, theoretical and experimental aspects of open-tubular columns are under study by a number of groups (2-17). For a recent review see reference 2.
A severe limitation is imposed by the detector cell volume \Z,et
which, according to Knox and Gilbert (3), should be: 7T d : L
Eq. 1
where a" = standard deviation of unretained solute peak, dc = inner diameter of open tubular column, L = column
length, and N = number of theoretical plates, if the early-eluting peaks are to be resolved.
Equation 1 leads to a V,cl of 67 pi for an open-tubular
col-umn of 1-m length and 10-/im i.d. (k ' = 0 , ^=13.8, h = 0.29). Maximum detector cell volumes that contribute less than 1% loss of efficiency for columns of <. 30-/im i.d. would have to be smaller than 1 nl (h = 1, N = 10s, capacity ratio k ' = 10, dif-fusion coefficient D = lO^mV) (2). For a column of 30-/*m i.d., Equation 1 leads to a Vdel of 6.7 nl (h = l, N = 1 0 \
k ' = 10, v = 7.2, length of capillary:3m).
'This paper was presented in part at the U.S.-Japanese Joint Seminar on Microcolumn Separation Methods and Their Ancillary Techniques in Honolulu, Hawaii, August 25-28, 1982.
Theoretical
The response of an ISE cell assembly can be described by (26):
E = Eo0 + —
z. log (ai Eq. 2
where E = electromotive force of the cell assembly; z ^ a ^ t h e charge number of the primary I ion and its activity in moles per liter (M) in the sample solution; z ,a =the charge number of any interfering J ion and its activity in moles per liter (M) in the sample solution; KJ301 = selectivity factor or a measure of the preference by the sensor of the interfering J ion relative to the I ion to be detected (an ideally selective membrane electrode would show all K^°' = 0); Eo = potential difference comprising
a constant (for a given temperature) plus the liquid junction potential; and s = 2.3O3RT/ziF = 59.16mV/zi (25°C). For a
suf-ficiently large ionic background concentration, variations in the liquid junction potential induced by changes in the activity of the primary I ion can be kept negligably small.
The measurement of the potential difference AE, which is due to the addition of I ion to a background of the J ions, allows a determination of the activity a- of the I ion:
Eq. 3
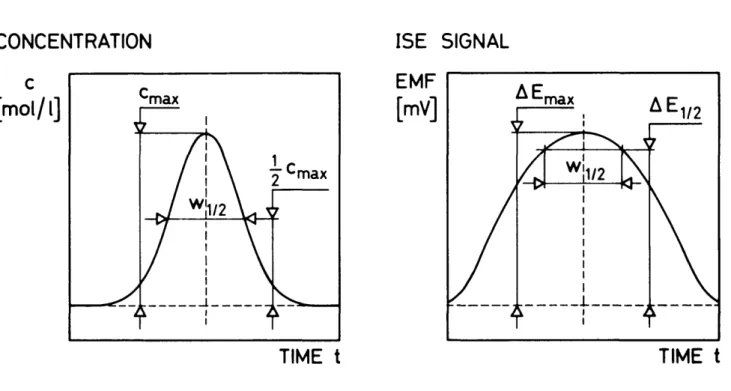
For the maximum activity in an elution profile (see Figure 1) a potential difference AEmax is obtained; the width
of the signal is defined for aj = ai m a x/2, where AE = AE1/2:
log
10 + 1
Eq. 4
Table I and Equation 4 show that large values of AEmax lead
to potentiometric signals where the width of the elution profile AE,/2 (for a; max/2) must be read off at heights above 50% of
the potentiometric signal AEmax. Therefore, elution profiles
recorded in AE values often look much broader and show more overlap than the more conventional profiles presented linearly in the concentration of the eluted species.
Although ISEs respond to single ion activities, it is permissi-ble to use the corresponding ion concentrations provided that constant ionic background and low activities of the primary ion are maintained and appropriate calibration measures are taken.
Experimental
The experimental set-up shown in Figure 2 was used with the following components: a pump (Altex model 110A); a pressure gauge (Wika Manometer 232.50.100, range 0-10 bar); injection loops (Rheodyne type 70-10, 10 /*1 and Valco UHP series, 0.2 /il, with two-position electric value actuator); a 25-/*m i.d. vitreous silica capillary column of length 0.6 m and 0.3 m, un-treated or un-treated with trichloro-octadecyl-silane (ODS) (Scien-tific Glass Engineering); and a valve (Whitey SS-22 RS4).
The ion-selective microelectrode detector had a tip diameter of = 1 jim and was inserted directly into the end of the
open-Table 1. to One AE max (mV) 0.1 0.2 0.5 1 2 5 10 20 50 100 200 500 PRESSURE GAUGE
0
:
PUMP ELUENT Height AE» Half of thein an Elution Profile Corresponding Maximum (mV) Activity of 1 A AE he Eluted Ion Ey2 ^max X100
monovalent divalent monovalent divalent
ion 0.05 0.10 0.25 0.50 1.02 2.62 5.48 11.90 35.64 82.75 182.25 482.24 SAMPLE I ion 0.05 0.10 0.25 0.51 1.04 2.74 5.95 13.56 41.38 91.12 191.12 491.12 ion 50.04 50.10 50.24 50.49 50.98 52.44 54.85 59.52 71.29 82.75 91.12 96.45 ion 50.10 50.20 50.49 50.98 51.95 54.85 59.52 67.80 82.75 91.12 95.56 98.22
CAPILLARY CAPILLARY COLUMI , 250 yum i.D. , < 1 INJECTION / I LOOP
_ / S — —
\ / / VALVE 25 yum i.D. DETECTORFigure 2. Schematic diagram of the open-tubular column liquid chromatograph
CONCENTRATION
ISE SIGNAL
TIME t
TIME t
tubular column (see Figure 3). Its membrane was a classical
cation-exchanger solution (3% w/w potassium
tetra-/?-chlorophenylborate in 2,3-dimethylnitrobenzene) (29,30). The
reference electrode was a chlorinated silver wire inserted into
a micro pipet (filled with 3A/KG). The potential difference
bet-ween ion-selective microelectrode and reference electrode was
measured as described earlier (30) and recorded (Kontron,
W + W Recorder Model 314). For further details see reference
31.
Because of the relatively low electrical resistance [2x 10
9Q
for a tip diameter of 1.5 /*m (29)] of the microelectrode based
on a classical cation-exchanger, the response time of the
elec-trochemical cell assembly is less than 10 msec (32). Even with
neutral carrier based systems (29,33,34) showing inherently
higher membrane resistances, microelectrodes with response
times of about 7 msec have been prepared (35).
Results and Discussion
The detection volume of the detector described here is
deter-mined by the surface area (= 8 x 10'
3m
2) of the ion-selective
SEPARATION CAPILLARY ION-SELECTIVE MICROELECTRODE ' • • ' • ' ^Jf'^-'•••,••:•./••"[ GLASS PLATE ELUENT DROP REFERENCE IMPEDANCE ELECTRODE CONVERTER Figure 3. Schematic diagram of the ion-selective detection system
REDUCED PLATE HEIGHT log h
1-- 1
IN]. LOOP : 10/JI ALKALI METAL CHLORIDES. 001 M k' = 0
MOBILE PHASE : 10 " M NH4N03, H2O
COLUMN : LENGTH = 60cm,ID.: 25>um
-1 3 log V
REDUCED VELOCITY
Figure 4. Reduced plate height as a function of the reduced velocity. Curve: Equation 13 in reference 3. Points: Experimental values
electrode and the stagnant diffusion layer extending from the
membrane into the sample solution. Assuming a thickness of
this layer of approximately one column inner diameter (here
25 jim), an effective detector volume of 20 x 10" 1 results. An
experimental verification of the influence of the volume of the
detector on the elution profile was performed by measuring the
reduced plate height h for an unretained component as a
func-tion of the reduced linear velocity v of the mobile phase. Figure
4 indicates perfect agreement between experimental values
(points) and those predicted by the Golay equation (curve). The
calculations were based on a column diameter d
c= 25 urn, a
diffusion coefficient D= 10'"mV, and k ' =0. Equation 13 in
reference 3 was used to calculate the curve plotted in Figure
4. The minimum in Figure 4 corresponds to a value of h = 0.29
(HETP = 7.2 urn, N = 83.000) for u = 13.8 (16.3 nl/min).
Together with Equation 1, the detection volume is therefore
estimated to be smaller than 500 pi. Unfortunately, the
separa-tion system used leads to a drastic increase in HETP with
in-creasing capacity ratio (see Figure 5) so that it is unsuitable for
analytically relevant separations of cations (see Figure 6).
To estimate the number of moles of the ions to be detected,
the following equation was used:
Eq. 5
REDUCED PLATE HEIGHT log h 10 -o o o o o o I N I LOOP 10/Jl . • " V = 93 MOBILE NaCI, RbCl, CsCI, TEAI, TPAI 10"3 M SPLIT FL0W_: PHASE : 10 I* LiOAc o KCI. TMACI. , TBAI, — . • 5 ml/min 1 NHAN03 OR ,H20 0.5 1.0 k' CAPACITY RATIO Figure 5. Reduced plate height as a function of the capacity ratio. Curve: Equa-tion 13 in reference 3. Points: Experimental values. Column: 60 cm, 25-^m i.d., ODS.
mV
105
-
o-I N 1 LOOP : lOyut ALKALo-I METAL
V = 3 6 ; MOBILE COLUMN A _ CHLORIDES, 0.01 M SPLIT FLOW : 5 m l / m i n PHASE : 10"3 M NHANO3lH2O .- LENGTH : 60 cm ,I.D.: 2 5 / i m ,
oos
1L
N V
K
0 2 4 6 Figure 6. Chromatogram of alkali metal chlorideswhere rij = moles of ions in injection loop, nc = moles of ions
injected into the open tubular column, Vc = volume flow
(ml/min) of mobile phase through open tubular column, and Vs = split flow (ml/min).
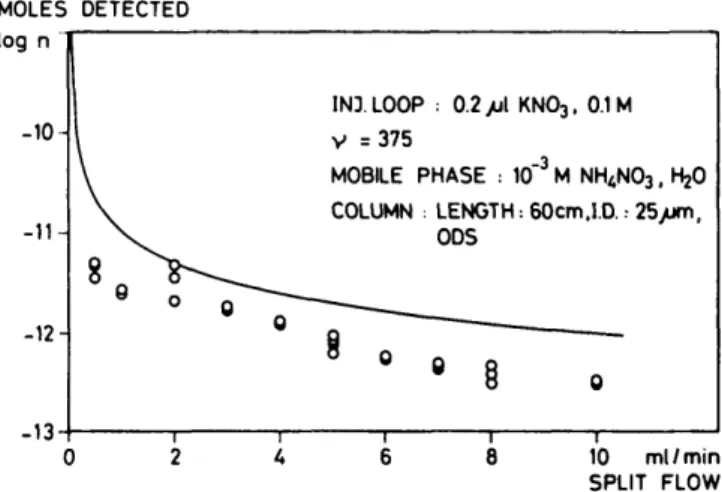
In Figure 7, these calculated values (curve) are compared with those obtained experimentally using Equation 3 (points). The rather large deviations are mainly a result of an independent and perhaps inappropriate determination of the selectivity fac-tor (K£°'NH + s 1), which had been obtained by the separate
solution method (28) on 10"W solutions of the chlorides, and also a result from inadequate description of the system by Equa-tions 3 and 5. Small deviaEqua-tions are also due to the substitution of concentrations for single ion activities.
An indication of the detection limit is presented in Figure 8 for the rather unfavorable case of the injection of K+ into a background of NH4 + . Since the electrode system does not
heavily discriminate between these two ions, the detection limit must be rather high (see Equation 3). Even for this extreme case, ions in the pmol range can be detected. Selectivity factors log K£f (29) are ca. -2.8 [J: (CH,)4N+], 1.3 (J: C s+) , 0.6 (J:
Rb+), 0 (J: K+) , -1.8 (J: N a+) , and -2.5 (J: Li+); thus con-siderably lower detection limits can be expected for certain other ions [e.g., (CH,)4N+], even when using the same electrode
system and the same ionic background. In extreme cases, detec-tion limits of neutral carrier based liquid membrane electrodes are about 10-'A/(Ca2 + in 0.125M K+) (33) or even < 1 0 - ' ° M (H,O + in 1.0MK + or N a+) (34).
The noise of the electrode system including the electronic equipment is < 0.5 mV, corresponding to an uncertainty in the concentration of < 2 % at high values of the signal measured.
Acknowledgment
This work was partly supported by the Schweizerischer Na-tionalfonds zur Ftfrderung der Wissenschaftlichen Forschung.
References
MOLES DETECTED J n 10 1 1 10 - -12--13-I
V\
V
8 >*
0 o I N I LOOP : 0.2/jl KNO3. 0.1 M V =375MOBILE PHASE : 10'3 M NHANO3, H2O
COLUMN : LENGTH: 60cm,ID.: 25yum, ODS
g
v—^—-
8° 0 a
8 0 10 ml/min SPLIT FLOWFigure 7. Number of moles detected as a function of the split flow. Curve: Equation 3. Points: Experimental values obtained through Equation 5.
\ Figure 6 • 10""mol ^1 min
L
8. Detection 5mV 6[
limit of I N I LOOP V = 212 ; : 10/JI KCl ; 10~\i0"2 ,10~3 SPLIT FLOW : MOBILE PHASE : 10"3 M COLUMN : 10"'2mol 6J L
1
the ISE detector
M 5 ml/min NH4NO3,H2O LENGTH : 3 0 c m , I D . 25>um 10"13 mol system
1. M. Novotny. Microcolumns in liquid chromatography. Anal.
Chem. 53: 1294A-301A (1981).
2. F.J. Yang. Open tubular column LC: Theory and Practice. J.
Chromatogr. Sci. 20: 241-51 (1982).
3. J.H. Knox and M.T. Gilbert. Kinetic optimization of straight open tubular liquid chromatography. J. Chromatogr. 186: 405-18 (1979).
4. V. Pretorius and T.W. Smuts. Turbulent flow chromatography: A new approach to faster analysis. Anal. Chem. 38: 274-81 (1966).
5. G. Guiochon. Preparation and operation of liquid chromatographic columns of very high efficiency. J. Chromatogr. 185: 3-26(1979).
6. K. Hibi, D. Ishii, I. Fujishim, T. Takeuchi, and T. Nakanishi. Studies of open tubular microcapillary liquid chromatography I.
HRC & CC 1: 21-7 (1978).
7. T. Tsuda, K. Hibi, T. Nakanishi, T. Takeuchi, and D. Ishii. Studies of open tubular microcapillary liquid chromatography II. J.
Chromatogr. 158: 227-32 (1978).
8. K. Hibi, T. Tsuda, T. Takeuchi, T. Nakanishi, and D. Ishii. Studies of open tubular microcapillary liquid chromatography III. J.
Chromatogr. 175: 104-22 (1979).
9. D. Ishii, T. Tsuda, and T. Takeuchi. Studies of open tubular
microcapillary liquid chromatography IV. J. Chromatogr. 185: 73-8 (1979).
10. D. Ishii, T. Tsuda, and T. Takeuchi. Open tubular microcapillary liquid chromatography with 30-40 mm i.d. columns. J.
Chromatogr. 199: 249-58 (1980).
11. D. Ishii and T. Takeuchi. Open tubular capillary LC. J.
Chromatogr. Sci. 18: 462-71 (1980).
12. F.J. Yang. Fused silica open tubular column for liquid chromato-graphy. HRC & CC 3: 589-90 (1980).
13. F.J. Yang. On-column detection using fused silica column. HRC
& CC 4: 83-5 (1981).
14. J.H. Knox. Theoretical aspects of LC with packed and open small-bore columns. J. Chromatogr. Sci. 18: 453-61 (1980). 15. T. Tsuda and G. Nakagawa. Open-tubular microcapillary liquid
chromatography with 30-40 ^m i.d. columns. J. Chromatogr. 199: 249-58 (1980).
16. M. Krejci, K. Tesarik, and J. Pajurek. Open-tubular columns in liquid chromatography. J. Chromatogr. 191: 17-23 (1980). 17. M. Novotny. Capillary HPLC: Columns and related
instrumen-tation. J. Chromatogr. Sci. 18: 473-78 (1980).
18. D. Ishii, K. Asai, K. Hibi, J. Jonokuchi, and M. Nagaya. A study of micro-high performance liquid chromatography I. J.
19. Y. Hirata, M. Novotny, T. Tsuda, and D. Ishii. Packed micro-capillary columns with different selectivities for liquid chromatography. Anal. Chem. 51: 1807-809 (1979).
20. G.J. Diebold and R.N. Zare. Laser fluorimetry: Subpicogram detection of aflatoxins using high-pressure liquid chromatography. Science 196: 1439-442 (1977).
21. L.W. Hershberger, J.B. Callis, and G.D. Christian. Sub-microliter flow-through cuvette for fluorescence monitoring of high-performance liquid chromatographic effluents. Anal. Chem. 51: 1444-446 (1979).
22. F. Martin, J. Maine, C.C. Seeley, and J.F. Holland. The free-falling drop detector: A novel fluorescence detector for high-performance liquid chromatography. Clin. Chem. 222:1434-437 (1976).
23. F.J. Yang. Fused-silica narrow-bore microparticle-packed-column high-performance liquid chromatography. J. Chromatogr. 236: 265-77 (1982).
24. Y. Hirata, P.T. Lin, M. Novotny, and R.M. Wightman. Small-volume electrochemical detector for microcolumn liquid chromatography. J. Chromatogr. 181: 287-94 (1980). 25. K. Suzuki, H. Ishiwada, H. Inoue, and T. Shirai. Construction and
characteristics of polymer membrane electrodes for anions: Ap-plication to microelectrode cells and ion chromatography detec-tors. Presented at the 1982 Pittsburgh Conference on Analytical Chemistry and Applied Spectroscopy. K. Suzuki, private communication.
26. F.A. Schultz and D.E. Mathis. Ion-selective detector for ion-exchange liquid chromatography. Anal. Chem. 46: 2253-255 (1974).
27. H. Akaiwa, H. Kawamoto, and M. Osumi. Simultaneous deter-mination of bromide and chloride in natural waters by ion-exchange chromatography and direct potentiometry with an ion
selective electrode. Talanta 29: 689-90 (1982).
28. G.G. Guilbault, R.A. Durst, M.S. Frant, H. Freiser, E.H. Hansen, T.S. Light, E. Pungor, G. Rechnitz, N.M. Rice, T.J. Rohm, W. Simon, and J.D.R. Thomas. Recommendations for nomenclature of ion-selective electrodes. Pure Appl. Chem. 48:127-32 (1976). 29. M. Oehme and W. Simon. Microelectrode for potassium ions bas-ed on a neutral carrier and comparison of its characteristics with a cation exchanger sensor. Anal. Chim. Acta 86: 21-5 (1976). 30. F. Lanter, D. Erne, D. Ammann, and W. Simon. Neutral carrier based ion-selective electrode for intracellular magnesium activity studies. Anal. Chem. 52: 2400-402 (1980).
31. F. Lanter. Herstellung und Charakterisierung von ionenselektiven Carrier-Flussigmembranmikroelektroden fur intra- und ex-trazellulare Aktivitatsbestimmungen von physiologisch relevanten Kationen. Diss. ETH 7076, Zurich, 1982.
32. H.D. Lux and E. Neher. The equilibration time course of [K + ]o
in cat cortex. Exp. Brain Res. 17: 190-205 (1973).
33. F. Lanter, R.A. Steiner, D. Ammann, and W. Simon. Critical evaluation of the applicability of neutral carrier-based calcium selective microelectrodes. Anal. Chim. Acta 153: 51-9 (1982). 34. P. Schulthess, Y. Shijo, H.V. Pham, E. Pretsch, D. Ammann, and W. Simon. A hydrogen ion-selective liquid-membrane electrode based on tri-n-dodecylamine as neutral carrier. Anal. Chim. Acta 131: 111-16(1981).
35. E. Ujec, E.E.O. Keller, N. Kriz, V. Pavlik, and J. Machek. Low-impedance, coaxial, ion-selective, double-barrel microelectrodes and their use in biological measurements. Bioelectrochem.
Bioenerg. 7: 363-69 (1980).
Manuscript received September 13, 1982; revision received December 29, 1982.