HAL Id: hal-03027515
https://hal.archives-ouvertes.fr/hal-03027515
Submitted on 27 Nov 2020HAL is a multi-disciplinary open access archive for the deposit and dissemination of sci-entific research documents, whether they are pub-lished or not. The documents may come from teaching and research institutions in France or abroad, or from public or private research centers.
L’archive ouverte pluridisciplinaire HAL, est destinée au dépôt et à la diffusion de documents scientifiques de niveau recherche, publiés ou non, émanant des établissements d’enseignement et de recherche français ou étrangers, des laboratoires publics ou privés.
Deposition of sulfate aerosols with positive ∆33S in the
Neoarchean
Guillaume Paris, Woodward Fischer, Jena Johnson, Samuel Webb, Theodore
Present, Alex Sessions, Jess Adkins
To cite this version:
Guillaume Paris, Woodward Fischer, Jena Johnson, Samuel Webb, Theodore Present, et al.. Depo-sition of sulfate aerosols with positive ∆33S in the Neoarchean. Geochimica et Cosmochimica Acta, Elsevier, 2020, 285, pp.1-20. �10.1016/j.gca.2020.06.028�. �hal-03027515�
Journal Pre-proofs
Deposition of sulfate aerosols with positive Δ 33S in the Neoarchean
Guillaume Paris, Woodward W. Fischer, Jena E. Johnson, Samuel M. Webb, Theodore M. Present, Alex L. Sessions, Jess F. Adkins
PII: S0016-7037(20)30405-1
DOI: https://doi.org/10.1016/j.gca.2020.06.028
Reference: GCA 11820
To appear in: Geochimica et Cosmochimica Acta
Received Date: 21 February 2020 Revised Date: 23 June 2020 Accepted Date: 24 June 2020
Please cite this article as: Paris, G., Fischer, W.W., Johnson, J.E., Webb, S.M., Present, T.M., Sessions, A.L., Adkins, J.F., Deposition of sulfate aerosols with positive Δ 33S in the Neoarchean, Geochimica et Cosmochimica
Acta (2020), doi: https://doi.org/10.1016/j.gca.2020.06.028
This is a PDF file of an article that has undergone enhancements after acceptance, such as the addition of a cover page and metadata, and formatting for readability, but it is not yet the definitive version of record. This version will undergo additional copyediting, typesetting and review before it is published in its final form, but we are providing this version to give early visibility of the article. Please note that, during the production process, errors may be discovered which could affect the content, and all legal disclaimers that apply to the journal pertain.
Deposition of sulfate aerosols with positive Δ33S in the Neoarchean
Guillaume Paris1, Woodward W. Fischer2, Jena E. Johnson3, Samuel M. Webb4, Theodore M.
Present2, Alex L. Sessions2, Jess F. Adkins2
1 CRPG, 15 rue Notre-Dame des Pauvres, UMR 7358 Université de Lorraine-CNRS 54000 Nancy,
France
2 Division of Geological and Planetary Sciences, California Institute of Technology, Pasadena, CA
91125, USA
3 Department of Earth and Environmental Sciences, University of Michigan, Ann Arbor MI 48103,
USA
4 Stanford Synchrotron Radiation Lightsource, Stanford University, Menlo Park, CA 94025, USA
Corresponding author: Guillaume Paris, [email protected] Abstract
Anomalous sulfur isotope compositions present in Archean rocks have been intensely scrutinized over the last 20 years because they record key aspects of Earth's atmospheric composition prior to the appearance of free molecular oxygen ca. 2.3 billion years ago. These isotopic compositions can be described as mass anomalous fractionations (MAF) and are produced in the atmosphere as UV light interacts with SO2 molecules. Most interpretations suggest that atmospheric processes
generate a reduced S-phase with a positive (33S-enriched) MAF signature, as measured in pyrites,
and an oxidized S-phase with a negative anomaly, as measured in bedded barite deposits. However, recent data for carbonate-associated sulfate (CAS) — a direct proxy for the isotopic composition of sulfur from seawater sulfate — in Neoarchean rocks showed no such negative values, but rather the opposite. To understand if the positive MAF anomalies we measured in Neoarchean CAS reflect secondary processes (diagenetic, metamorphic, handling) instead of original signals of Archean seawater sulfate, we collected additional sample suites with various degrees of preservation and metamorphic alteration across the Campbellrand-Malmani platform in South Africa. Results illustrate that within this comprehensive suite, less-altered samples all
contain positive MAF values while secondary processes tend to either remove CAS from the sample and/or decrease the 33S-enrichment. This positive MAF signal in sulfate is therefore
reasonably interpreted as a primary depositional origin, and implies that the assumption that sulfate always carries a negative MAF anomaly throughout the Archean rock record needs to be reconsidered. Our CAS observations suggest that future experiments and calculations should also consider atmospheric and/or sulfur cycling processes that can produce oxidized sulfur with a positive MAF signature.
1. Introduction
The evolution of Earth’s atmosphere through geological time is a long-standing problem in the Earth Sciences. During Archean time (4.0 to 2.5 Ga), the Earth was characterized by a lack of oxygen in the atmosphere and oceans (Holland, 1984; Fischer et al., 2016). Despite a lower intensity of solar irradiation, liquid water was sustained at Earth's surface, suggesting a significantly higher greenhouse gas content in the Archean atmosphere compared to today's (Sagan and Mullen, 1972; Kasting, 1989). The major greenhouse gas is thought to have been carbon dioxide (CO2) possibly together with much higher methane (CH4) concentrations, with
contributions from carbonyl sulfide (COS), ammonia (NH3) or other greenhouse gases (e.g. Sagan
and Chyba, 1997; Zahnle et al., 2006; Domagal-Goldman et al., 2008; Thomazo et al., 2009; Ueno et al., 2009). It is therefore of great interest to characterize not only the evolution of O2, but also
the different gases that helped sustain liquid water on the early Earth. Because they are thought to have originated from reactions in the atmosphere, anomalous multiple sulfur isotope ratios (Farquhar et al., 2000) offer the opportunity of constraining multiple gas components at once (e.g. Endo et al., 2016).
Unusual sulfur isotope compositions have been observed in Archean sedimentary rocks until their disappearance from the rock record in early Proterozoic time associated with the Great Oxygenation Event (Farquhar et al., 2000; Ono et al., 2003; Guo et al., 2009; Johnston, 2011; Luo et al., 2016; Philippot et al., 2018)
.
Most processes on Earth separate sulfur isotopes in proportion to their relative mass difference, generating "mass-dependent fractionations" (MDF), so called because they follow a canonical equilibrium fractionation law (Hulston and Thode, 1965; Eiler et al., 2014) where δ'33S=0.515×δ'34S (with δ'xS=ln[(xS/32S)sample/(xS/32S)reference]; x=34 or x=33). The
δxS value is almost identical to δ'xS (δxS=[(xS/32S)
sample/(xS/32S)reference-1]). However, in the
absence of molecular oxygen and ozone (Farquhar et al., 2001), UV-light interaction with SO2
molecules generates anomalous sulfur isotopic compositions, (δ'33S≠0.515×δ'34S) usually
described as "mass-independent fractionations" (MIF) or "mass-anomalous fractionation" (MAF), reported as Δ33S (Δ33S =δ'33S-0.515×δ'34S). We use here the broader expression "MAF" as such
signatures could arise from a mass fractionation law different from the reference law rather than from truly mass-independent processes.
The unusual sulfur isotope abundances, or MAF, provide a strong line of evidence for an Archean atmosphere free of O2 (Pavlov and Kasting, 2002). Beyond recognizing that Δ33S ≠ 0, knowing
which species carry the positive and negative Δ33S anomalies can help determine which process
(or processes) and UV wavelengths generated MAF in the distant past. In order to explain the exact structure of MAF data, gases other than SO2 must be present in the Archean atmosphere. As
a result, these data can help us to understand which gases contributed to sustain a sufficient greenhouse effect on the early Earth, such as CH4 or NH3 (Zahnle et al., 2006; Domagal-Goldman
et al., 2008; Zerkle et al., 2012; Izon et al., 2017). Understanding the exact processes that produced the Archean MAF and describing the underlying mass fractionation law(s) are therefore of significant value.
As soon as the MAF signatures were discovered (Farquhar et al., 2000), SO2 photolysis lab
experiments attempted to undercover the mechanisms that generated them (Farquhar et al., 2001). Many mass fractionation mechanisms have been explored through photochemistry experiments under different UV wavelengths and atmospheric compositions (Masterson et al., 2011; Whitehill and Ono, 2012; Ono et al., 2013; Whitehill et al., 2013; Whitehill et al., 2015; Endo et al., 2016). These experimental approaches have been supplemented with 1-D column atmosphere models and isotopologue cross-section adsorption calculations (Lyons, 2007; Danielache et al., 2008; Lyons, 2009; Ueno et al., 2009; Claire et al., 2014; Endo et al., 2015; Izon et al., 2017; Endo et al., 2019). Overall, the photochemical processes generating S-MAF can in principle be differentiated based on the wavelengths reacting with SO2.
(1) At wavelengths between 190 and 220 nm, photolytic processes (SO2→SO+O), self-shielding
of SO2 (SO2 absorbs the wavelengths with which it interacts) and/or pressure-broadening all occur
(Lyons, 2009; Ono et al., 2013; Lyons et al., 2018; Endo et al., 2019). Early SO2 photolysis
experiments at 193 nm generated negative-MAF sulfate ( ArF excimer laser; Farquhar et al., 2001), focusing attention to this range of wavelengths. MAF-bearing sulfur species are produced because the photodissociation rates are a function of absorption cross-sections, slightly different for each SO2 isotopologue. In addition, 32SO2, the most abundant isotopologue, has a lower self-shielding
reaction rate, with a dependence on SO2 concentrations: the more SO2 there is, the faster 32SO2
shields itself (Lyons, 2009; Ueno et al., 2009; Ono et al., 2013; Endo et al., 2019). SO2 is
to S0 or possibly COS in the presence of CO. By mass-balance, the exiting SO
3 molecules should
carry a negative anomaly. Subsequent oxidation of SO3 generates sulfuric acid (H2SO4) aerosols
carrying the negative Δ33S anomaly that can then be transferred to the oceans. Paired with negative
Δ33S Archean barite and positive Δ33S Archean pyrite, these experiments formed the basis for the
original sulfur photochemical model on early Earth.
(2) At wavelengths between 250 and 350 nm, photoexcitation (SO2→*SO2) occurs (Ueno et al.,
2009; Halevy, 2013; Whitehill et al., 2013; Endo et al., 2019). MAF is produced during the transition of SO2 from an excited singlet state 1SO2 (the spin of the excited electron is paired with
that of the lowest, or ground, energy state) to an excited triplet state 3SO
2 (where the excited
electron spin is no longer paired with the ground state electron) and the anomaly can then be transferred to either the reduced or oxidized species after reaction with ground SO2 (Whitehill and
Ono, 2012). Initial experiments with continuous wavelengths above 220 nm (Xe lamp) and KrF excimer laser generated positive-MAF sulfate (Farquhar et al., 2001). In the context of Archean barite with negative-MAF sulfate, these longer wavelengths experiments seemed less relevant to Archean atmospheric chemistry. Furthermore, photoexcitation is considered a very minor pathway (Endo et al., 2016).
(3) Across both ranges of wavelengths, recent lab experiments and numerical models have demonstrated the important role played by the absolute SO2 concentration and the presence of
other trace (COS, CO, etc.) and minor (CO2, CH4) gases in setting the sign (+/-) of the MAF
anomaly in pyrites (Ueno et al., 2009; Claire et al., 2014; Izon et al., 2017; Endo et al., 2019). In a CO-containing atmosphere, MAF processes could occur from a combination of collision-induced system crossing and self-shielding and therefore a combination of photoexcitation and photooxidation (Whitehill et al., 2013; Endo et al., 2016), which is hypothesized to match the measured Δ36S/ Δ33S ratio. During photoexcitation in the 250-350 nm region, the intersystem
crossing from an excited singlet state 1SO
2 to an excited triplet state SO2 (*SO2) generates *SO2
with a positive Δ33S through near-resonant spin coupling between both excited states (Whitehill et
al., 2013). This anomaly is expected to be transferred to SO, and not to SO3, through the reaction
*SO2+SO2→*SO+SO3, therefore delivering it ultimately to the reduced sulfur pool. But if the
anomaly is captured as COS, it could be transferred to sulfate instead (Savarino et al., 2003; Whitehill and Ono, 2012). Experimental results are very sensitive to the initial conditions and to
the overall composition of the artificial atmosphere. This is true in both older and more recent experiments. For example, CO is required to transfer the positive anomaly to COS (Endo et al., 2019) and therefore the final result depends on the initial CO concentration in the reaction volume. Based on the initial laboratory experiments of SO2 irradiated by UV light, it was hypothesized that
reduced sulfur species carried a positive Δ33S value and that higher-valent sulfur species (SO 3,
SO42-) carried a commensurate negative counterpart (e.g. Farquhar et al., 2001). The cascade of
reactions that subsequently occurred in the atmosphere would have transferred the positive Δ33S
of reduced sulfur ultimately to pyrite, explaining the generally positive values measured in sedimentary pyrites (Farquhar et al., 2013; Halevy, 2013). Pyrite is proposed to be formed through two different pathways. The first one is direct deposition of elemental sulfur chains S8 (e.g. Ono
et al., 2009a). Elemental sulfur can either produce pyrite following chemical reaction with ferrous sulfide (Rickard, 1975), or following further reduction through microbial disproportionation (e.g. Philippot et al., 2007; Farquhar et al., 2013). In both cases, pyrites would carry the atmospheric reduced sulfur MAF (usually assumed to be positive). The second pathway is through microbial sulfate reduction (MSR) that reduces sulfate to sulfide, which would produce pyrite that carries the atmospheric oxidized sulfur MAF (usually assumed to be negative). MSR is assumed to have started possibly 3.5 Ga ago (e.g; Shen et al., 2001; Ueno et al., 2008; Shen et al., 2009). However, it has been recently suggested that MSR would have evolved only 2.7 Ga ago and that organic sulfur played a major role in the pre-2.7 Ga sulfur cycle (Fakhraee and Katsev, 2019). Even if it was relatively recently-evolved, MSR would have been active during the deposition of the Campbellrand-Malmani platform. In the end, such a model would result in sulfate carrying a negative Δ33S value and pyrites carrying either positive or negative Δ33S values.
Finally, geological support for a model where reduced sulfur carries the positive atmospheric MAF signature came from negative Δ33S values measured in Paleoarchean barites from South Africa,
India and Australia (Bao et al., 2007; Philippot et al., 2007; Ueno et al., 2008; Shen et al., 2009; Philippot et al., 2012; Roerdink et al., 2012; Muller et al., 2016) and slightly negative MAF measured in Archean volcanic massive sulfide deposits (Jamieson et al., 2013). Additional evidence interpreted within the frame of the canonical model came from the observation of diamond-hosted sulfides carrying a negative Δ33S and interpreted as the evidence of Archean
grains of Archean pyrites revealed a roughly constant and negative Δ33S in pyrites with a broad
range of δ34S values (Farquhar et al., 2013; Fischer et al., 2014; Zhelezinskaia et al., 2014). To be
consistent with the view that oxidized sulfur species carried a negative Δ33S value, the previous
studies suggested that there was mass-dependent microbial reduction of negative Δ33S sulfate.
However, scatter in δ34S values is also observed in pyrite grains with a positive Δ33S value (Fischer
et al., 2014). Questions remain about Archean MAF processes. Experiments highlight the many possible pathways involved in forming Archean-like MAF signals (e.g. Savarino et al., 2003; Whitehill et al., 2013; Endo et al., 2016). Recently, new theoretical considerations of atmospheric chemistry underlined that the role given to COS as a potential exit channel may have been excessive (Babikov, 2017; Babikov et al., 2017; Harman et al., 2018). They support instead that sulfur was exiting the atmosphere as elemental sulfur chains (Sx) of different sizes and not S8
exclusively. This theory predicts an exit channel with elemental sulfur carrying negative Δ33S
value and sulfate characterized by positive Δ33S values. Obtaining adequate oxidized sulfur from
the rock record to measure its MAF value has proven to be challenging.
There is a significantly larger amount of MAF data from Archean pyrites compared to Archean sulfate minerals. Sulfate concentrations in Archean oceans were much lower than today (Grotzinger and Kasting, 1993; Crowe et al., 2014; Fakhraee et al., 2018), leaving only specialized deposits of sulfate minerals (e.g. Bao et al., 2007; Philippot et al., 2012; Roerdink et al., 2012; Ueno et al., 2008). The Paleoarchean barites used to constrain the negative MAF signal derive from volcanoclastic deposits with a petrogenesis that might not lead them to preserve marine sulfate isotopic compositions (Roerdink et al., 2013; Muller et al., 2016; Lowe et al., 2019). In contrast to these older barites, we have observed positive Δ33S values in younger Neorchean
carbonate-associated sulfate (CAS; Paris et al., 2014). CAS is known to derive initially from seawater sulfate in younger successions (e.g. Rennie et al., 2018; Toyama et al., 2020). These observations and models contradict the established paradigm that sulfate carried MAF negative signatures throughout Archean time. Similar observations of positive Δ33S in CAS had been
previously made, but considered as deriving from secondary processes (Domagal-Goldman et al., 2008). There could be a possibility that the Neoarchean CAS that we previously measured is affected by post-depositional processes, as CAS can be potentially altered during diagenesis, metasomatism or sulfate extraction (Gill et al., 2008; Wotte et al., 2012; Rennie et al., 2014; Present et al., 2015; Fichtner et al., 2017; Present et al., 2019).
In this study, we examined the composition and preservation of multiple sulfur isotopes within the sedimentary succession of the Campbellrand-Malmani platform to pinpoint depositional compositions and assess if post-depositional processes have impacted the isotopic composition measured on CAS from samples collected across the platform (Paris et al., 2014). To this end, we sampled different formations that capture different ages, depositional environments, and metamorphic histories across the platform. We utilized the preservation contrast between the better-preserved western part of the craton (Griqualand West structural sub-basin) and the eastern part of the craton (Transvaal basin), where tectonics and the massive plutonic Bushveld Intrusive Complex may have altered the sulfur isotope signals contained in carbonate rocks more strongly than what is observed in Griqualand West (Gleason et al., 2011; Fischer et al., 2014; Johnson et al., 2019). To assess how exhumation and weathering could also have played a role, we compare the signal measured in rocks coming from outcrops to rocks derived from deep diamond drill cores. Finally, to augment our previous study in which only pure carbonates were analyzed, we purposely measured sulfate from various recrystallized and metasomatized samples, including partially silicified samples as well as samples rich in pyrite, to compare how clear post-depositional alteration processes and potential contaminants impacted the CAS sulfur isotopic compositions. 2. Geological context
The Transvaal Supergroup in South Africa is preserved in two distinct structural basins (Griqualand West and Transvaal) and covers over 0.2×10⁶ km2 (Beukes, 1987). Within the
Transvaal Supergroup, the Neoarchean Campbellrand-Malmani platform contains attractive targets for micro-CAS analyses with a unique abundance of in-situ, benthic carbonate precipitation and the occurrence of extremely diverse stromatolitic and microbialite fabrics (Beukes, 1987; Sumner and Bowring, 1996; Sumner, 1997b; Sumner and Grotzinger, 2004; Knoll and Beukes, 2009). The platform initiated as a carbonate ramp, now preserved as the Schmidtsdrif Subgroup, and developed into a mature rimmed carbonate shelf that spread across the entire Kaapvaal Craton (Sumner and Beukes, 2006) accumulating over 1 km in thickness of marine carbonate. In the Prieska area, deeper basin sediments are preserved and the thickness is ~500 m (Beukes, 1987; Sumner, 1997b). Eventually the carbonate platform drowned during a major transgression that translated into the deposition of iron formations of the Asbestos Hills Subgroup (Kuruman Iron Formation in Griqualand West and the Penge Iron Formation in the Transvaal).
Compared to other Neoarchean strata, the Campbellrand platform is markedly well preserved, particularly in Griqualand West where the strata are flat-lying, and the regional metamorphism is generally low-grade, not exceeding the greenschist facies (200-400°C Miyano and Beukes, 1984; Miyano and Beukes, 1997). The western edge of the craton is marked by thin-skinned folding and faulting, resulting in Campbellrand rocks overthrusting the Proterozoic red beds of the Olifantshoek Group (Beukes, 1987). Petrographic textures in carbonate lithologies from the west reflect this excellent preservation potential as they commonly contain fabric-retentive, early diagenetic dolomite, as well as primary calcite in many areas (Sumner and Grotzinger, 2004; Fischer et al., 2009). To the east, the Transvaal area is marked by steep structural dips, and he Bushveld Igneous Complex intruded the Neoarchean strata ca. 2.05 Ga ago (Walraven et al., 1990; Buick et al., 2001), resulting in steeper structure dips, higher metamorphic temperatures, and greater metasomatism than the Griqualand West region (Kaneko and Miyano, 1990; Miyano and Beukes, 1997).
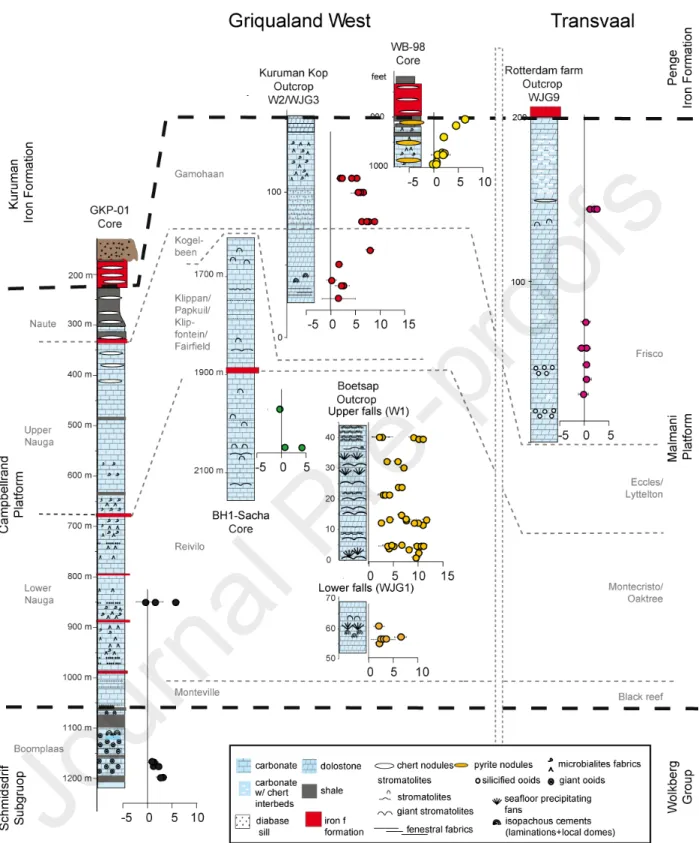
The platform is broadly divided into two large sequences that can be correlated from Griqualand West to the Transvaal (Fig. 1). The first sequence is the Lower Nauga/Reivilo formation while the second one is the Upper Nauga Formation, which is overlain by the Naute/Gamohaan/Frisco formation (Sumner, 1997a; Sumner and Beukes, 2006). Each of them represent aggradational packages separated by a thin transgressive unit at the top of the Lower Nauga/Reivilo formation in the Griqualand West area, the Kamden Iron Formation. Carbonate deposition was reestablished by the time of deposition of the Upper Nauga Formation. The Campbellrand-Malmani platform slope was then at its steepest, with a lagoon that developed episodically behind the reef margin. Immediately after deposition of these facies, a major transgression led to the final demise of the platform, recorded within the Naute/Gamohaan/Frisco formation. In Griqualand West, this flooding is recorded in a sequence characterized by deep subtidal fenestral microbialites with increasing chert content, ultimately grading into the Kuruman Iron Formation. In the Transvaal, the Frisco Formation evolves from ripple marks, cross laminations, and ooids to sequential carbonate/chert layers and finally into the Penge Iron Formation. The Penge and Kuruman Iron formations cap the platform across the entire Kaapvaal Craton.
Sampling was targeted to investigate the sulfur isotope differences between the Griqualand West and Transvaal areas and between formations in the same area of the platform, as well as comparing
the CAS preservation in core versus outcrop samples. As a result, our sulfur isotope data come from samples collected from five different stratigraphic sections through the platform, mostly from cores and outcrops from the Lower Nauga/Reivilo formation and the Naute/Gamohaan/Frisco formation. A few additional samples come from a core through the Monteville Formation. In Griqualand West, the Boetsap section (27° 57.88' S 024° 27.24' E; Truswell and Eriksson, 1973; Sumner, 2002; Sumner and Grotzinger, 2004) captures shallow subtidal paleoenvironments of the Reivilo Formation deposited during the early development of the Campbellrand platform and consists of two parts, Lower (samples WJG1) and Upper Falls (samples W1; Paris et al., 2014). Textures consist of minor grainstones and abundant precipitated stromatolites including seafloor aragonite fans (Sumner and Grotzinger, 2004). Most of the carbonates in this part of the platform have been altered with a fabric-retentive dolomitization, though in this section some horizons are still present as limestone (e.g. Paris et al., 2014). GKP 01 (samples GKP) is a drill core collected with the Agouron Institute South African Drilling Project that penetrates through the proximal slope facies of the Campbellrand platform (Knoll and Beukes, 2009). We targeted cements associated with deep subtidal fenestral microbialites deposited deeper in the basin in the Lower Nauga Formation. SAC samples were collected from the BH1-Sacha core (Altermann and Siegfried, 1997) that captures shallow parts of the platform paleoenvironments. Samples WJG3 and W2 come from the Kuruman Kop section (Sumner, 2002; Sumner and Grotzinger, 2004; 27° 22.82' S 024° 20.82' E) and capture the terminal drowning of the carbonate platform from a shallow lagoonal evaporitic environment (WJG3) to a subtidal microbialite facies that includes abundant early marine cements (W2). The lagoonal facies sediments comprise interbedded fenestrate microbial laminations and isopachously domed limestone (Sumner and Beukes, 2006). The deep subtidal, fenestral microbialite facies of the 2.521 Ga Gamohaan Formation contains abundant herringbone calcite, interpreted as an early seafloor precipitating cement (Sumner and Beukes, 2006; Sumner and Bowring, 1996; Sumner and Grotzinger, 1996). In the Campbellrand platform, herringbone calcite occurs as encrusting beds and is an important phase of void-filling cementation associated with the deep subtidal fenestral microbialites (Sumner and Grotzinger, 1996). Core WB-98 captures the same transition as WJG3 and W2 samples from Kuruman Kop. However, while the facies are similar between WB-98, WJG3 and W2, and all represent the Lower Nauga Formation, most samples in WB-98 contained mm to cm pyrite nodules. We note that such nodules are similar to those investigated in a similar core (Kamber and Whitehouse, 2007). Their presence
makes core WB-98 a poor prospect for accurate CAS measurements due to the enhanced possibility of for oxidized pyrite contamination, but an interesting target for the current investigation. Some samples from this core appeared surficially oxidized at the time of collection, possibly due to the storage conditions (Fig. S4). Thus, WB-98 provides us with an opportunity to test how poor preservation and secondary oxidation of abundant pyrite affects the CAS sulfur isotope signal.
In the Transvaal area, we sampled the Rotterdam Farm section (samples WJG9; 24° 33.643' S ; 027°21.251' E). The Rotterdam Farm section captures the Frisco Formation, a package laterally equivalent to and comprised of similar facies to the Gamohaan Formation. This formation was deposited in a more updip, proximal setting, and like the Gamohaan and Naute formations, the strata record the drowning of the platform, though the Frisco Formation contains more siliciclastic-rich beds than the Gamohaan/Naute formation. The Rotterdam Farm outcrop evolved from a shallow sedimentation environment, as indicated by cross-stratified ooid grainstones, now silicified, to a deeper more quiescent environment and eventually the deposition of the Penge Iron Formation. Rocks in this part of the platform witnessed more deformation and higher temperatures, and the samples we selected contained evidence of both early and late silicification that may have occurred during ca. 2.05 Ga Bushveld-related metamorphism and associated hydrothermal fluids circulation (Schiffries and Skinner, 1987). Through these Transvaal area rocks, we were able to explore the effects of metasomatism and metamorphism on the CAS record. 3. Methods
3.1 Sample preparation and petrographic observations
We selected a subset of samples across the various environments and lithologies encountered in the platform. Samples were sectioned using a rock saw, orthogonal to bedding, and polished for petrographic inspection. The slabs were cleaned with MilliQ water, then micromilled using a Sherline 5410 mill equipped with a RoundTool diamond-coated carbide end mill (GR4SI 1/16 D1; 1.5mm diameter) to collect 40 to 150 mg of powders from different petrographic textures. Representative thin sections were made and observed microscopically using polarized and transmitted light (Fig. S1-S3).
All plastics (centrifuge tubes, autosampler vials and Biorad columns) were leached in 10% reagent grade HCl and rinsed 5 times in MilliQ water. Teflon vials were cleaned in 5% Seastar HNO3,
rinsed 5 times in MilliQ water, refluxed overnight with concentrated Seastar HNO3 at 160ᵒC and
rinsed 3 times in MilliQ water. For each sample, up to 40 mg of powder were weighed and sonicated for 60 min in 1 M NaCl. All samples were then centrifuged and rinsed 4 times in MilliQ water. After drying, the samples were weighed again, dissolved in 10% HCl, centrifuged, and the supernatant was collected in a Savillex Teflon vial. The supernatant was dried at 120ᵒC on a hot plate under HEPA filtered laminar flow air and the insoluble residue was dried in an oven at 90ᵒC. The residues were weighed, and the dried supernatant was dissolved in HCl. Biorad disposable columns were loaded with 2 ml of clean AG1X8 anion-exchange resin 100-200 mesh (Das et al., 2012; Paris et al., 2014). The resin was then cleaned with 20 ml of 10% HNO3, 20 ml of 10% HCl
and 10 ml of 0.5% HCl. Samples were loaded onto the resin, cations were removed by rinsing the column with 5 times 5 ml of MilliQ water, and sulfate was eluted with 3×4 ml of 0.5 M HNO3
(Paris et al., 2014). Seawater and corals internal standards were processed through the columns following the same procedures as checks on the consistency of our procedure over time.
3.3 Sulfur isotopes, sulfate concentration, and stable isotope measurements
Sulfur isotopes were measured as 32S+, 33S+ and 34S+ ions at Caltech on a Neptune Plus
multi-collector inductively-coupled plasma mass spectrometer (MC-ICPMS, Thermo Fisher Scientific) in high resolution mode. We used a desolvating membrane (Aridus, Cetac) as an introduction system to decrease interferences and make measurements of sulfur possible, following a method described previously (Paris et al., 2013; Paris et al., 2014). Samples were measured by sample-standard bracketing to correct instrumental fractionation. The bracketing sample-standard was a Na2SO4
solution concentrated at 20 µmol/l. Na + was added to the samples after purification as NaOH to
match the sodium concentration of the bracketing standard (Paris et al., 2013). Sulfur isotope ratios of the Na2SO4 bracketing solution were determined by comparing it directly to a solution of
international standard IAEA-S1 (δ34S
VCDT = -0.3‰, δ33SVCDT = -0.055‰, (Ding et al., 2001; Ono
et al., 2006). The δ34S
VCDT value of our bracketing Na2SO4 solution is -1.55‰±0.16 (2sd) and the
δ33S
VCDT value is -0.77±0.17‰ (Δ33S = 0.02±0.17‰) and was determined previously (Paris et al.,
2013). All values were corrected assuming linear drift and corrected for instrumental background.
ratios through the consistency or our standards that cover most of the range of δ33S and δ34S values
measured in our CAS. Consistency standards (seawater and a deep-sea coral aragonite) were purified and measured alongside the Archean carbonates. We measured average δ34S and Δ33S
values of 20.95 ± 0.19 ‰ and 0.10 ± 0.24‰ for seawater (2sd, n=4) and 22.35± 0.22 ‰ and 0.02 ± 0.22‰ (2sd, n=4) for our coral consistency standards, in agreement with our previous investigations. Individual TPB were measured in each batch of column. We performed the blank corrections using the average of all measured ratios to improve accuracy but using the average concentrations of each batch. In addition to our consistency standards, we added two Paleoproterozoic samples from an economic drill-core (T92/7 and T92/22, Mooidraai Formation, provided by Prof. Beukes, see Fig. 1). Despite their low sulfur content (20 to 180 ppm) similar to the other samples analyzed in this article, they display no MAF values (average Δ33S=0.21±0.30‰,
n=3), in agreement with the timing of MAF disappearance evaluated in South Africa (Guo et al., 2009; Luo et al., 2016). Values are presented in the appendix.
In parallel, an aliquot of the purified sample is used to measure sulfate content by ion chromatography at the ESE (Caltech) using a Dionex ICS-3000 system (Thermo Fisher Scientific) using in-house concentration standards to assess accuracy and precision. The CAS concentrations were calculated from the measured sulfate amount, and from the dry weights of the cleaned powder and the insoluble residue. The insoluble residue was evaluated by weighing the centrifuge tube before and after dissolution of the carbonate. The soluble fraction was calculated by difference and evaluated between 22% and 107 % of the initial weight, possibly due to difference of statics from one weighing session to the next. In the absence of a clear way to evaluate uncertainty in these calculations, it was therefore assumed to be 10 % RSD. In a few cases, the soluble fraction could not be evaluated and was assumed to be 95% in order to calculate the CAS concentration of the sample. Because the concentrations were measured after purification, we also applied a blank correction. Total procedural blanks (TPB) were measured as they were run on the Neptune for isotopic ratios. The signal was compared to the bracketing standard to calculate the amount of sulfur. In some cases, more powder than necessary was drilled and duplicates were run from the same dissolved powders.
Uncertainties for sulfur isotopic compositions are given as blank-corrected 2 standard deviations. There are two steps in the blank correction. First, the machine blank from the MC-ICPMS is
subtracted using the signal measured in the blank solution (5% HNO3+40 µmol/L NaOH to match
the Na-addition to the samples). Second, we correct for the total procedural blank (TPB) that includes reagents and sample handling. To measure the TPB we processed empty vials through the whole procedure. Typically there is not enough sulfur to run both the IC and the ICPMS for TPB samples. We evaluated the amount of TPB sulfur on the MC-ICPMS instead. To do so, we diluted the TPB in a known volume of HNO3+NaOH solution and assumed a linear response of
intensity to sulfur concentration, and report the results in the appendix. We used these numbers in the following TBP correction equations as ratios (34R
blk) and not delta values to correct the isotopic
ratio (34R
meas) to the true CAS isotopic ratio (34Rcarb:
× = × + × (1), meas 34R meas n 34Rblk blk n carb 34R carb n
where nmeasis the total mass of sulfur from a single sample and
= - (2).
carb
n nmeas nblk
The true isotopic composition of our sample, icarb, and concentration of our sample,
34R i
carb
ppm , were calculated as:
= ( × - × )/ (3) carb 34R meas 34R meas n 34Rblk blk n ncarb and
[SO42-]carb = (ncarb × 96.04) / mcarb (4),
with mcarb the carbonate weight of the sample.
An analogous set of equations can be written for evaluating 33R
carb. Uncertainty in the TPB
corrected ratio was calculated by propagating the standard deviation obtained for random populations of 1000 values with a normal distribution that has the same evaluated standard deviation as each member of equation (3) and (4). The blank correction increases the typical δ34S
reproducibility from 0.2 to 0.35‰ and the Δ33S one from 0.40 to 0.70‰ (2sd). Carbon and oxygen
isotopes were measured at Caltech using a Delta V Plus isotope ratio mass spectrometer (Thermo Fisher Scientific) equipped with the GasBench II. About 100 μg of powder was weighed and then
digested for at least 2 h at 72°C with 85% phosphoric acid in 12 mL vials pre-flushed with helium. Accuracy was assessed by running two in-house calcite standards at the beginning and end of each analytical session. Reproducibility was monitored by running a Carrera marble standard between every five samples and 0.22‰ for δ13C and 0.85‰ for δ18O as 2SD.
3.4 Synchrotron data
We used sulfur K-edge X-ray absorption spectroscopy (XAS) to study the electronic structure and the redox state of the sulfur present in some of the carbonate samples that we analyzed in this study. A few mg of powder were placed onto sulfur-free (< 1 ppm) mylar tape (St. Gobain) in a milled aluminum sample holder. X-ray absorption near edge structure (XANES) spectra for bulk S valence state were collected at beamline 14-3 at Stanford Synchrotron Radiation Lightsource (SSRL) in Menlo Park, California. Samples were measured in fluorescence mode, using a 4-element Vortex detector (Hitachi) equipped with Xspress3 pulse processing electronics (Quantum Detectors). A sodium thiosulfate (NaS2O3) standard was used for energy calibration, with the first
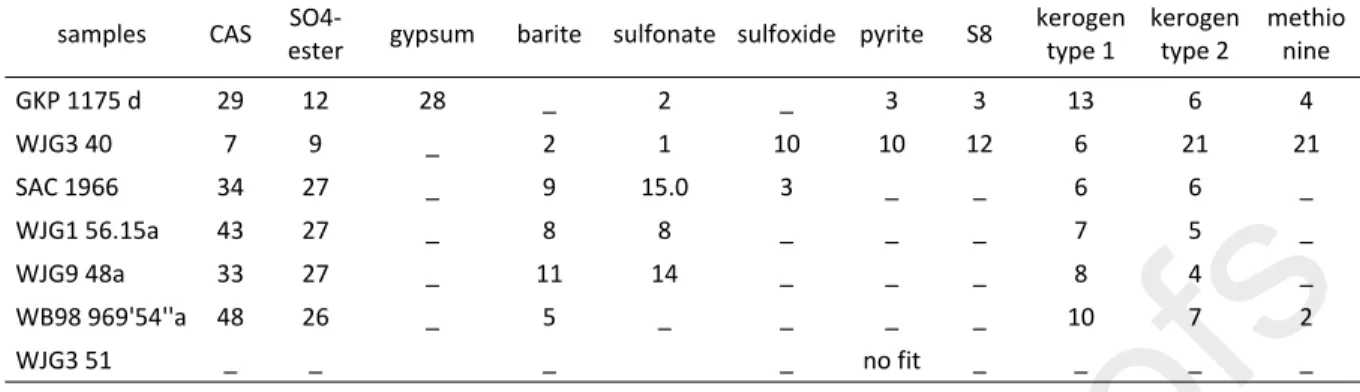
pre-edge peak (fluorescence maxima) set at 2472.02 eV. Duplicate to quadruplate spectra through the sulfur K-edge were collected for all samples by measuring fluorescence while scanning from 2460 to 2540 eV, and averaged to obtain better spectral resolution and help reduce noise. Repeat analyses of identical spots showed no evidence of redox changes during analysis (e.g. photooxidation by the X-ray beam). We fit the data using the SIXPACK software (Webb, 2005) and the following standards: CAS-sulfate, pyrite, S8, sulfoxide, sulfonate, methionine, sulfate ester
and kerogen type 1 and 2 (Table 1). S8 was measured from a Sigma-Aldrich alpha-S8 powder.
Pnon yrite, kerogen type 1 and 2, CAS, gypsum and barite were measured from geological samples at SLAC. SO4-ester (dextran sulfate), sulfoxides (methionine sulfoxide), thioether (methionine), sulfonic acids/sulfonate (taurine) were measured as solutions (to minimize the self-absorption artifacts and spectral differences due to crystal packing made up to 30–100 mM in PBS at pH 7.4 (except for dextran sulfate which was analyzed at pH 8.2). Standards are shown in Fig. S5. The relative proportions of each sulfur species are given in Table 1.
4. Results
Samples with a lower degree of post-depositional alteration hail from outcrops and cores located in the better-preserved Griqualand West region (Fig. S1). As previously described (Paris et al 2014), samples from the Boetsap outcrop of the Reivilo Formation (W1, Paris et al., 2014; WJG1, this study) are relatively well-preserved precipitated stromatolites, including aragonite fans, and minor grainstones (Fig. S1a). These rocks have largely been dolomitized but some horizons are still limestone, and they mark the base of the Campbellrand-Malmani platform capturing shallow subtidal paleoenvironments. A new pisolite sample from the Monteville Formation (sample GKP 1175, Fig. S1c-d) supplements our previous data (Paris et al. 2014) from core GKP 01. We note that those samples consist of a very different lithology, dominated by micritized ooids, pisoids, and ‘giant’ ooids packstone/rudstone. The Kuruman Kop outcrop, with deep subtidal, fenestral microbialite facies, records the terminal carbonate deposition of the drowning platform in the Gamohaan Formation. Samples from this outcrop show micritized oncoids interspersed between drusy to blocky cement, including the early herringbone calcite cement, with rare m-scale pyrite crystals (Fig. S1b, S2, S3).
The WB-98 drill core also provides a record of the Gamohaan Formation but these strata contain abundant mm to cm pyrite nodules. This sample showed signs of external oxidation that most likely occurred after core extraction and are removed by polishing (Fig. S4), but we cannot exclude that the pyrite minerals were partially oxidized before we handled them. Thus, we characterize the WB-98 samples as less pristine reservoirs for CAS as they contain potentially contaminating sulfides and sulfide-derived sulfate produced during oxidative weathering.
Unlike the Griqualand West area, the Campbellrand-Malmani strata in the Transvaal region were subject to metamorphism and metasomatic fluids introduced by the Bushveld intrusion (Kaneko and Miyano, 1990; Walraven et al., 1990; Buick et al., 2001). Samples collected from outcrops at Rotterdam Farm from the Frisco Formation, equivalent to the Naute/Gamohaan formations, show extensive silicification, including completely quartz-replaced ooids and cherty marble with common euhedral sulfides and silicified veins (Figure S4).
4.2 Geochemical data
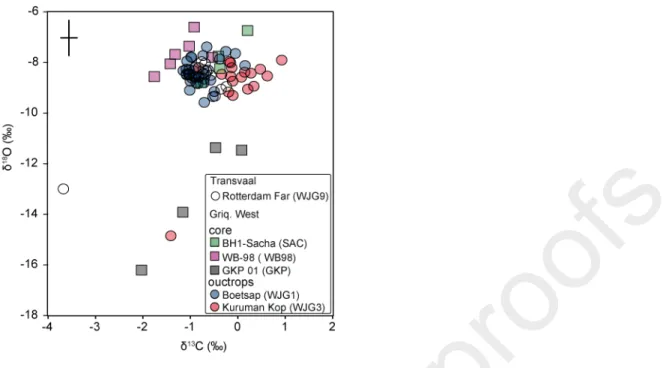
The carbonate content of our samples varies from ~10 to ~100 weight percent, reflecting the wide variety of materials analyzed. Carbon and oxygen isotope data are consistent with previous studies
of carbonates from the Campbellrand-Malmani platform (Fischer et al., 2009). The δ13C values
range from -4 to 0.5‰ with most points clustering around -1‰ while δ18O data range from -18 to
-6‰ with most points between -9‰ and -6‰ (Fig. 2).
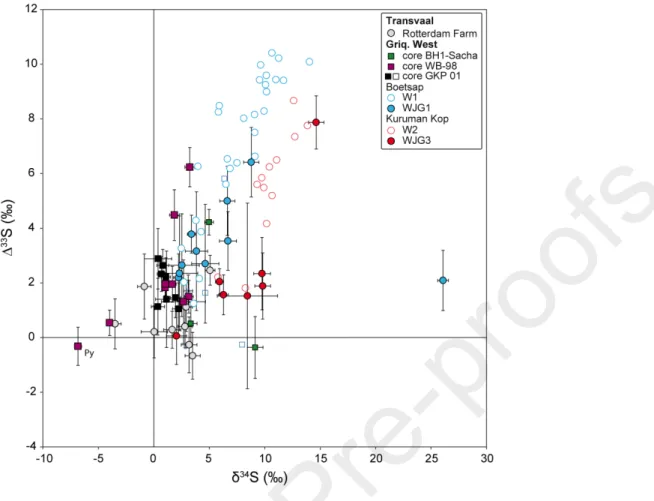
Our data reveal that almost all CAS samples analyzed are characterized by positive ∆33S in
carbonates with very low sulfate content (Fig. 3, 4, 5). For all samples, the ∆33S values range from
–0.5 ‰ to +8.0 ‰, the δ34S values range from -7‰ to +25‰ and the sulfate contents range from
1 to >1000 ppm. Almost all the data indicate a CAS content lower than 150 ppm with the exception of two samples from WB-98. A few negative ∆33S values were encountered but they usually
corresponded to the samples with the lowest amount of recovered sulfate (3 nmol or less, for concentrations usually lower than 3 ppm). As a result, the errors make the determined values not significantly different from zero. With the exception of one point from the Boetsap outcrop (Δ33S
≈ +2‰, δ34S≈ +25‰), all data follow a positive correlation between the major isotope composition
and the 33S anomaly. The δ34S, Δ33S and CAS measurements agree with our previously published
data (Paris et al 2014), but some differences are observed. The highest sulfate contents (>150 ppm) are found in samples from core WB-98, while samples from the Transvaal area display the lowest concentrations (Fig. 4). In addition, the samples from the Boomplaas Formation (core GKP 01) are characterized by less positive Δ33S values and very negative δ18O. Those samples consist
of a very different lithology, dominated by ‘giant’ ooids.
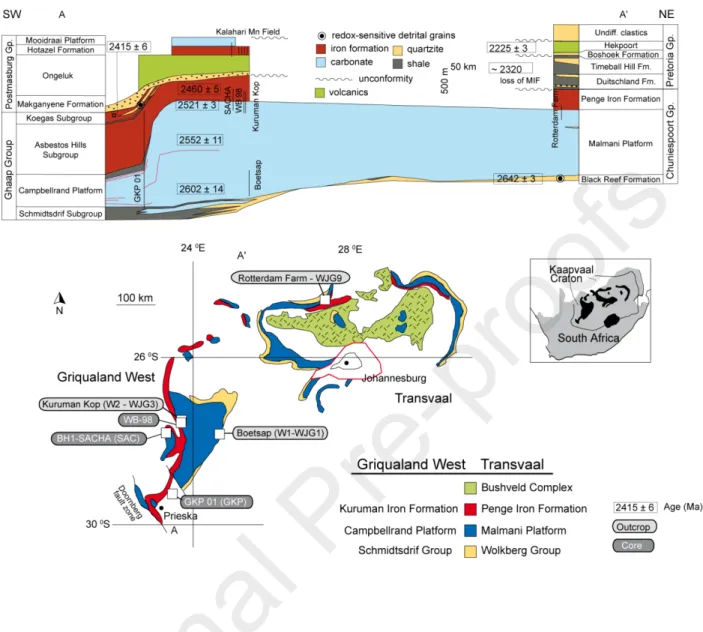
Overall, our sulfur isotopic data appears to contain three clear endmembers (Fig. 4). Endmember 1 is defined by the most positive ∆33S values with intermediate CAS content. Endmember 2, on
the other hand, reflects samples characterized by Δ33S values that are either slightly positive or not
significantly different from zero and containing low to extremely low CAS content. Finally, Endmember 3 represents samples with the highest sulfate contents and isotopic values with positive to slightly negative Δ33S, but with δ34S lower values than endmember 1 (as defined by the
values from WB-98 samples, purple squares, figs. 3 and 4). 4.3 XANES data
XANES analyses of microdrilled untreated powders reveal sulfur speciation in our samples (Paris et al., 2014). Typical spectral data are shown in Fig. 6 and indicate that sulfur was present in our samples as a mixture between various species of reduced sulfur and sulfate, as expected. For most
of the samples, we obtained a visually satisfactory fit, except for sample WJG3 51. The fit produced a non-existent reduced sulfur peak and failed to fit the shape of the sulfate peak (Fig. S6). The XANES data revealed that most samples contained at least some CAS, in agreement with our previous study (Paris et al., 2014). Most samples also contained sulfate present as SO4-ester, but also traces of gypsum and barite. Kerogen-sulfur was the most abundant reduced sulfur species in our samples and we usually did not detect a lot of pyrite or S8. In addition, we found
presence of sulfonate in two samples and thioether in one sample. 5. Discussion
To understand the sulfur photochemistry and associated sulfur fractionation laws generated by Archean atmospheric processes, most models rely on data from sedimentary pyrites and assume that sulfate exited the atmosphere already carrying a negative Δ33S value. Existing direct oxidized
sulfur data derive primarily from Paleoarchean barites (Bao et al., 2007; Ueno et al., 2008; Shen et al., 2009; Philippot et al., 2012; Roerdink et al., 2012; Muller et al., 2016). These barites were all deposited between 3.5 and 3.1 Ga ago and therefore cover only a small fraction of the Archean Eon. Furthermore, their existence is a something of a paradox for an ocean with low sulfate concentrations where sulfate evaporites are not observed in the rock record (Grotzinger and Kasting, 1993). Thus, the barite may not represent Archean open-ocean sulfate as they are associated with volcaniclastic deposits (Philippot et al., 2012) or reflect hydrothermal systems (Van Kranendonk, 2006). In contrast to the barite record, the data presented here shows an unambiguously positive Δ33S signal in carbonate-associated sulfate throughout our diverse sample
set, consistent with previous results (Paris et al., 2014). Our diverse dataset, ranging from cores to outcrops and from pure carbonate samples to samples with complex mineralogy or preservational history, further reveal seawater sulfate deposition and preservation across the marine carbonate platform captured by the ~2.5 Ga Campbellrand-Malmani sequence. In the following discussion, we first assess if this positive Δ33S signal is primary or post-depositional.
We then compare the CAS data and the pyrite data in the Campbellrand platform and finally discuss the possible atmospheric origin of the positive Δ33S in CAS.
A positive Δ33S anomaly in oxidized sulfur species is at odds with most interpretations of the
Archean sulfur cycle. We combined the current dataset and our previous data to test whether the omnipresent positive Δ33S signal that we measured could actually derive from preservational
biases or metamorphic history. The data in Fig. 3 indicate that positive Δ33S values are also
correlated with δ34S values. Fig. 4 shows that, across the entire platform, the sulfate content and
Δ33S values define a domain delimited by three likely endmembers. These are not necessarily
mixing relationships, but rather types of samples with characteristic relationships between their sulfur isotope value and sulfate content. The different cores and sections do not appear randomly distributed between these three endmembers and we hypothesize that each of them corresponds to a different phase of the geological history of the platform.
We first ensure that we measured sulfur from CAS. CAS is present in almost all our samples. We also found abundant sulfur both as kerogen and SO4-ester. We do not expect sulfur from kerogen
to contribute to our measured CAS because sulfur extraction from organic matter, especially kerogens, require stronger chemical reagents than those we used for CAS extraction (e.g. Raven et al., 2015). Similarly, pyrite was present only in small amounts in our samples and it is not significantly dissolved in our protocol (Present et al., 2015). S8 was present in only two of the
tested powders. Barite could not have been dissolved during our process, which is also designed to not collect gypsum (Present et al., 2019). However, we cannot exclude that we could have leached sulfate from SO4-ester groups and that our sulfur isotopic composition resulted from a CAS-SO4 ester mix. Such groups are found for example in brachiopod shell carbonates where
they play a role in biomineralization; however, they are not a known diagenetic product (Richardson et al., 2019a; Richardson et al., 2019b). In any case, the sulfate in those groups likely would have initially been derived from seawater sulfate, just like the CAS.
We propose that Endmember 1 (high Δ33S, intermediate [CAS]) records the most pristine original
sulfate isotopic composition. This endmember consists primarily of samples from two outcrops located at the base and the top of the platform in the Griqualand West area: Boetsap and Kuruman Kop. Some of the data points were previously published (Paris et al., 2014) and others come from additional sampling from those two locations and new data presented here. Carbonates are preserved as fabric-retentive dolomite or limestone that initially precipitated as seafloor carbonate cements, occasionally associated with microbial mats (Sumner and Beukes, 2006; Sumner and
Bowring, 1996; Sumner and Grotzinger, 1996). Carbon and oxygen isotope data agree with previous investigations (Fischer et al., 2009). We initially chose these samples as the best candidates for retaining Archean CAS because they show no sign of post-exhumation oxidation, they contain only traces of disseminated pyrite, and they display no petrographic evidence of deformation or metamorphic alteration (Paris et al., 2014), only reaching low-grade greenschist facies (Miyano and Beukes, 1984). Overall, the sulfate content of those rocks (roughly 10 to 50 ppm) is consistent with precipitation of inorganic aragonite in seawater with sulfate concentrations around 100 µmol/L or precipitation calcite at concentrations lower than 30 µmol/L (Barkan et al., 2020), a range that agrees with existing seawater sulfate concentration estimates for the Neoarchean (Crowe et al., 2014; Fakhraee et al., 2018). However, no constraints exists on dolomite, or during the aragonite-calcite diagenetic inversion (except during meteoric diagenesis, Gill et al., 2008).
Unlike Endmember 1, we suggest that Endmember 2 (low Δ33S, low [CAS]) documents sulfur
isotopes affected by late diagenesis and/or metamorphism and metasomatic fluids. Endmember 2 contains samples from the Rotterdam farm outcrop, both located in the Transvaal area, as well as some samples from the Griqualand West area such as late void-filling spar. The Transvaal area was chosen to assess the influence of post-depositional history as depositional depth and metamorphic history were different between the two parts of the platform, including the Bushveld intrusion ca. 2.05 Ga ago (Walraven et al., 1990). Selected locations reached temperatures up to 500°C and contain substantial petrographic evidence of metamorphism (Miyano and Beukes, 1997). Samples from the Rotterdam Farm location were sometimes silicified, preventing us at times from drilling out sample material. Petrographically, they show silicified fractures and extensive replacement of carbonate ooids by chert. Other samples were characterized by low
weight percent (<10%) carbonate and CAS content. The samples that were affected by the Bushveld metamorphism have the lowest sulfate content, sometimes close to our total procedural blank. Some of those points can therefore not be represented in Figs 3 and 4 but would likely extend Endmember 2 farther to the right in Fig. 4. We also note that samples WJG9 143 from the Rotterdam farm outcrop is characterized by homogeneous δ13C values and heterogeneous sulfur
isotopic compositions (both δ34S and Δ33S). Such a pattern is not necessarily surprising if the rocks
were initially deposited in a sulfate-poor environment. These results suggest that no massive sulfate overprinting occurred in these rocks. In addition, some samples from Griqualand West
also belong to this endmember. For example, two samples (spar) of GKP 01 from the Lower Nauga/Reivilo Formation are characterized by Δ33S values close to zero and very low CAS content
(less than 5 ppm, Paris et al., 2014). This core did not strongly experience the Bushveld contact metamorphism, however these rocks contain void-filling sparry cements that reflect residual porosity readily accessed by Bushveld hydrothermal fluids (Gleason et al., 2011; Paris et al., 2014). Overall, Endmember 2 shows diagenetic or metamorphic alteration of the rocks that tends to erase the Δ33S-δ34S trend, not create it. The carbonates might all be secondary and reprecipitated in a
fluid that was poor in sulfate. We conclude that these secondary processes do not explain the positive Δ33S values in Endmember 1.
Endmember 3 (low Δ33S, high [CAS]) is the richest in sulfate and corresponds mainly to samples
from the pyrite-rich and secondarily-oxidized core WB-98, and thus we contend that this endmember reflects the effects of incipient oxidative weathering. WB-98 samples have abundant pyrite nodules and showed clear visual signs of surficial oxidation. As a result, they do not represent the ideal target to explore the sulfur isotopic composition of seawater CAS, but could represent a source of sulfate with a positive Δ33S if we assume that pyrite oxidation is the origin
for the CAS measured in our samples. However, WB-98 is characterized by lower Δ33S and δ34S
values and richer sulfate contents than samples from other locations, likely connected to the presence of (re)oxidized pyrite. We purposefully drilled a pyrite nodule texture as a way to test the influence of the presence of pyrite and to investigate whether the positive Δ33S could be derived
from pyrite oxidation, either in the lab or during the depositional history of the rock. This sample (WB98 998d, Fig. S4, sample marked "Py" in Fig. 3, 4, and 7A) is an outlier. It has by far the highest sulfate content and the most negative δ34S and Δ33S values from the entire dataset. The
pyrite sample initially contained ~25% of pyrite (10 mg) and we recovered 2.4 µmol SO42- (most
likely including sulfate from CAS and from oxidized pyrite). If we assume that all the sulfate came from pyrite oxidation, 2.4 µmol SO42- would correspond to the oxidation of ~150 µg of pyrite
(~1.5% of the pyrite included in our drill sample). We cannot determine however whether such oxidation occurred in the core prior to sampling or in the lab after sampling. The former is likelier than the latter as our protocol is not able to oxidize pyrite to such an extent (Present et al., 2015). Regardless, sulfate from pyrite oxidation clearly overprinted the sulfur signals of WB-98 if it started with a composition near Endmember 1. If correct, pyrite contamination lowers the measured isotopic composition and does not generate the positive signal we see in Endmember 1,
especially in this part of the platform where nodular pyrites are documented as having negative Δ33S (Fischer et al., 2014).
The rest of the samples falls between the three endmembers. This includes part of the samples from Kuruman Kop, Boetasp, core BH1-Sacha, GKP-01. In particular, samples from the Boomplaas Formation (core GKP 01) are characterized by less positive Δ33S values than
endmember 1 and very negative δ18O. Because they are the only samples from this formation, we
cannot draw any specific conclusion; however we note that those samples are lithologically unique within our sample set, consisting of coarse sand to gravel-sized ooid, pisoid, and ‘giant’ ooid packstone (Fig. S1). However, it is difficult to interpret the extent to which samples between the endmembers represent, or not, a combination of the processes mentioned previously.
As an alternative hypothesis to Endmember 1 being a pristine record of marine sulfate, we considered if Endmember 1 could reflect the oxidation of disseminated positive-MAF pyrites in the absence of negative MAF nodules. Most disseminated pyrites exhibit positive MAF values (Ono et al., 2009a; Ono et al., 2009b) and their oxidation would tend to increase Δ33S values of
sulfate. However, XANES results indicate that our Endmember 1 samples do contain CAS (Fig. 6), and only have rare to extremely rare disseminated pyrites, as confirmed by direct observations of the thin sections matching the drilled areas performed for some of the samples (Fig. S1, S2, S3). Therefore, in Endmember 1 samples, the sulfate we measure could either be purely CAS, or a mixture of CAS and oxidized disseminated pyrite. For example, XANES data reveal that sample W1-5 contains ~10% sulfur in sulfate and the rest as pyrite (~75%) or organic (~15 %) sulfur, yielding Δ33S values as high as +10.4 ‰ (Paris et al. 2014). If we assume that the Δ33S value of
sulfate should be close to Eoarchean barites (i.e. lower than -0.5‰), this means our measured Δ33S
would require the contribution of oxidized pyrites with values of Δ33S higher than +11.6‰. Such
high Δ33S values have not been documented in contemporaneous pyrites (Fig. 7). The highest
published value of disseminated pyrite in the Reivilo Formation is Δ33S = +10.34‰ (Izon et al.,
2015), with the exception of pyrites from the Fig Tree Group (Δ33S values up to 14‰), but they
would be an unlikely candidate as a source of sulfur to the basin because they are characterized by negative δ34S values, lower than -20‰ (Philippot et al., 2012). Thus the published pyrite data do
not support such a mixing, even assuming all pyrite is oxidized during sample preparation. The fact that pyrite and CAS isotopic compositions do not overlap in the Gamohaan formation (from
the better-preserved Kuruman Kop section) further supports that CAS sulfur isotope data from Endmember 1 do not reflect procedural pyrite oxidation, as further discussed in section 5.2. As a result, we feel confident that Endmember 1 likely contains the most pristine CAS in the platform. We therefore assume that this positive Δ33S signal reflects sulfate incorporated in the rocks during
their precipitation from seawater as early cements across the Neoarchean platform, in agreement with our previous interpretation (Paris et al., 2014).
5.2 How could Δ33S-positive sulfate form?
There are at least three potential ways to explain how seawater sulfate in the Campbellrand basin can exhibit positive Δ33S values. (1) The marine sulfate in the waters overlying the
Campbellrand-Malmani platform could be dominated by sulfate coming from oxidative weathering of positive Δ33S pyrite, (2) microbial metabolisms (sulfur disproportionation or sulfur oxidation) led to
forming sulfate with positive Δ33S values or (3) Neoarchean atmospheric processes could have
generated original sulfate with a positive Δ33S.
(1) In order to create sulfate with positive MAF signature, we could consider oxidative weathering of positive Δ33S pyrites during the Archean. First, this idea is in conflict with the observation of
unoxidized detrital pyrites in underlying and overlying strata (Johnson et al., 2014). Even in a fully oxygenated atmosphere, modern weathering of Archean crust with anomalous Δ33S pyrite
produces sulfur with no MAF (Torres et al., 2018). For Archean weathering to generate sulfate with a positive Δ33S value, oxidation of the S-species carrying only the positive Δ33S signal is
required. In addition, highly positive Δ33S pyrites such as the values found in our CAS
measurements are only found in the latest Neoarchean pyrites, suggesting that this weathering would need to involve contemporaneous pyrites from the Campbellrand platform, which is difficult to envision. It has been suggested that biologically-mediated weathering of sulfur minerals could have started about 2.7 Ga ago (Stüeken et al., 2012), which could possibly be reconciled with detrital pyrite observations assuming differential pyrite weathering using a biological oxidant other than O2. In sum, we suggest that Archean oxidation of pyrites is
inconsistent with both modern and ancient observations of pyrite weathering.
(2) An alternative explanation for the positive Δ33S values measured in sulfate to be produced as a
to sulfate at the time of rock formation, or sulfur-disproportionation (e.g. Philippot et al., 2007; Shen et al., 2009; Farquhar et al., 2013). Microbial activity is expected in Noeoarchean basins (e.g. Farquhar et al., 2013), especially in the case of samples from cores GKP 01 and WB-98 or from the Kuruman Kop outcrop, where microbial fenestrae and rolled microbial mats are observed (e.g. Fig. S4). If we follow the canonical model and assume that atmospheric sulfate carries a negative Δ33S, the positive Δ33S isotopic compositions we measure in Neoarchean CAS would
imply that sulfate derived from sulfide oxidation or elemental sulfur disproportionation completely erased the isotopic signature of the atmospheric input in the Campbellrand-Malmani basin. We do not ever measure negative CAS Δ33S in pristine samples. Our observation implies that seawater
sulfate in this basin did not carry a negative Δ33S value, regardless of the atmospheric processes
involved.
(3) Instead, we argue that the positive MAF values in CAS result from atmospheric processes that generate an oxidized sulfur species carrying the positive Δ33S anomaly, with reduced sulfur in
early diagenetic disseminated pyrites deriving from microbial reduction of this sulfate. Outcrop samples reveal Δ33S values that are more positive than those measured from core samples.
However, cores and outcrops do not cover the same formations and we cannot interpret this difference in detail. However, because we have the most data for samples from Boetsap and Kuruman Kop, both outcrops from different locations of the Griqualand West part of the platform (bottom and top of the Campbellrand-Malmani platform, respectively), we investigate the relationship between δ34S and Δ33S for these two suites of samples, including previous data (Paris
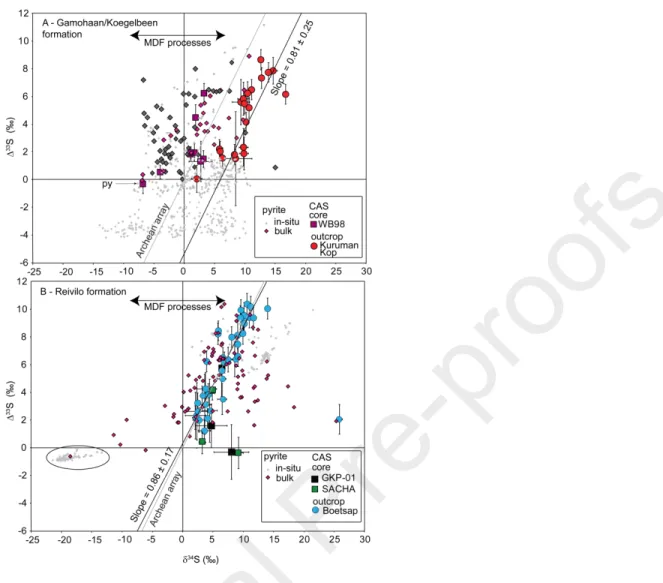
et al., 2014). Fig. 7 shows that in a δ34S vs. Δ33S crossplot, most of the data from the Gamohaan
(top of the platform, Kuruman Kop outcrop, Fig. 7A) and the Reivilo Formation (base of the platform, Boetsap outcrop, Fig. 7B) plot along straight lines. The slope of this line is identical, within error, to the Archean array, initially defined by bulk rock measurements (δ34S=0.89×Δ33S;
Ono et al., 2009a) and attributed to MAF formation by interaction of UV-light with SO2 molecules.
We also note that the Gamohaan Formation, as recorded by the better-preserved Kuruman Kop, contains CAS and pyrite data that do not overlap with each other, reinforcing our interpretation that we did not simply measure reduced sulfur that would have been reoxidized during rock handling. The isotopic relationships between these two phases may reflect different aspects of environmental processes. In the Reivilo formation, almost all of the CAS data strictly follow the Archean array, outside of one point with a very high δ34S, while pyrite data from previous
publications are more varied (Fig 7B). If the original oxidized sulfur species in seawater had a positive Δ33S, then sulfur dioxide gas emitted from the mantle with Δ33S ≈ 0‰ experienced
atmospheric photochemical reactions that led to positive Δ33S sulfate. Presumably the negative
Δ33S would be carried in the resulting reduced sulfur species. Part of the positive Δ33S sulfate
could have then been reduced through a mass-dependent reduction process, such as microbial sulfate reduction (double-headed arrow in Fig. 7), to be preserved as sedimentary pyrites carrying positive Δ33S values – forming the Archean pyrite array. Disseminated pyrite crystals could also
be formed secondarily or altered by later processes, such as disseminated pyrite from shales adjacent to the Campbellrand platform that were characterized magnetically as secondary (Fischer et al., 2014). These MDF processes such as microbial and thermochemical sulfate reduction do not affect the Δ33S value and could explain why the δ34S data of reduced sulfur covers a wider
range than the CAS data.
Our hypothesis that positive-MAF was carried by oxidized sulfur species and negative MAF was hosted by reduced sulfur species would explain why positive Δ33S can be found in both
disseminated pyrite and CAS, as well as why negative values are found only in pyrites across the Campbellrand platform and not in CAS. Within this framework, we interpret the CAS sulfur isotopes in the Gamohaan Formation as reflecting the non-quantitative formation of pyrite. As a result, sulfate would keep its initial Δ33S positive trend, but the δ34S values of the sulfate would be
offset from pyrite towards positive values. We indeed observed a positive offset of ~5‰ from sulfate to pyrite in the Gamohaan Formation (Fig. 7A), which is small yet consistent with microbial sulfate reduction (Crowe et al., 2014). The observation of such an offset in the Gamohaan formation rich in microbial mats, unlike its observation in the Reivilo formation where no such mats are observed, would be consistent with microbial processes occurring. The overall relationship between sulfate and pyrite in all measurements of the Campbellrand platform is consistent with the hypothesis that disseminated pyrites formed from sulfate carrying a positive Δ33S value.
This observed sulfate-sulfide relationship emphasizes the fact that the only samples revealing clearly negative Δ33S are nodular or layered pyrites while the disseminated pyrites tend to display
positive values in existing data for the Campbellrand-Malmani platform (Kamber and Whitehouse, 2007; Farquhar et al., 2013; Fischer et al., 2014). Within the Reivilo formation, pyrites with
negative Δ33S values and very negative δ34S values seem to indicate that there was a process with
a distinct MAF law (oval, Fig. 7), and not a simple MDF process with initial sulfate containing a negative Δ33S. Therefore, we suggest that these pyrites could derive from atmospherically-derived
negative Δ33S reduced sulfur with positive Δ33S sulfide derived from sulfate to make pyrite (ferrous
sulfide reacting with elemental sulfur to make pyrite, Rickard 1975). 5.3 Can atmospheric processes generate positive sulfate?
This positive Δ33S atmospheric sulfate hypothesis leaves us with the challenge of explaining the
possibility of a 33S-enrichment in sulfate that contradicts the barite record. Laboratory and
numerical experiments have produced different fractionations including some showing that oxidized S-phases can carry a positive Δ33S. Overall, no lab experiment seems to directly capture
the Archean relationship observed between δ34S, Δ33S and Δ36S (Δ36S/ Δ33S ~1 in sediments),
which demonstrates that open and critical questions remain about the underlying MAF-generating process.
Until recently, in light of only one sulfate archive (barites), previous studies that resulted in modeled or experimental positive Δ33S sulfate were disregarded. The first models based on
cross-section adsorptions yielded positive anomalies in sulfate (Ueno et al., 2009). This result was considered unfit to explain the Archean MAF signature. Ueno et al. (2009) thus developed the idea that the presence of COS in the atmosphere shielded part of the photolysis spectrum in order to generate a negative anomaly, because COS preferentially absorbs wavelengths between 200 and 210 nm. During photooxidation in the 180-220 nm region, the predicted photolytic processes yield Δ33S values whose sign depends strongly on the cross-section adsorption profiles. The initial sign
of the MAF signal in sulfate was calculated as positive (Claire et al., 2014) but then changed to negative using revised spectra (Endo et al., 2015; Izon et al., 2017). By contrast, because the latest cross-sections produce fractionation that appear in agreement with negative sulfate (Endo et al., 2015; Izon et al., 2017), no additional calculations have been produced to understand if the presence of other gases could affect the UV spectrum and lead to positive sulfate formation. However, two other known processes can create a positive Δ33S in sulfate. Photooxidation without
self-shielding can create sulfate with a (small) positive Δ33S (Endo et al., 2016). Fractionation
![Figure 4 Cross-plots showing 1/[CAS] (g of carbonate/µg of sulfate) vs. Δ 33 S with linear (A) or logarithmic x-axis (B)](https://thumb-eu.123doks.com/thumbv2/123doknet/14800225.605851/42.918.121.773.106.444/figure-cross-plots-showing-carbonate-sulfate-linear-logarithmic.webp)