HAL Id: hal-00300861
https://hal.archives-ouvertes.fr/hal-00300861
Submitted on 10 Jul 2002HAL is a multi-disciplinary open access
archive for the deposit and dissemination of sci-entific research documents, whether they are pub-lished or not. The documents may come from teaching and research institutions in France or abroad, or from public or private research centers.
L’archive ouverte pluridisciplinaire HAL, est destinée au dépôt et à la diffusion de documents scientifiques de niveau recherche, publiés ou non, émanant des établissements d’enseignement et de recherche français ou étrangers, des laboratoires publics ou privés.
On the origin of tropospheric O3 over the Indian Ocean
during the winter monsoon: African biomass burning vs.
stratosphere-troposphere exchange
A. T. J. de Laat
To cite this version:
A. T. J. de Laat. On the origin of tropospheric O3 over the Indian Ocean during the winter monsoon: African biomass burning vs. stratosphere-troposphere exchange. Atmospheric Chemistry and Physics Discussions, European Geosciences Union, 2002, 2 (4), pp.943-981. �hal-00300861�
ACPD
2, 943–981, 2002
On the origin of tropospheric O3 over
the Indian Ocean
A. T. J. de Laat Title Page Abstract Introduction Conclusions References Tables Figures J I J I Back Close Full Screen / Esc
Print Version Interactive Discussion
c
EGS 2002
Atmos. Chem. Phys. Discuss., 2, 943–981, 2002 www.atmos-chem-phys.org/acpd/2/943/
c
European Geophysical Society 2002
Atmospheric Chemistry and Physics Discussions
On the origin of tropospheric O
3
over the
Indian Ocean during the winter monsoon:
African biomass burning
vs. stratosphere-troposphere exchange
A. T. J. de Laat
Space Research Organization Netherlands (SRON), the Netherlands Received: 2 May 2002 – Accepted: 12 June 2002 – Published: 10 July 2002 Correspondence to: A. T. J. de Laat ([email protected])
ACPD
2, 943–981, 2002
On the origin of tropospheric O3 over
the Indian Ocean
A. T. J. de Laat Title Page Abstract Introduction Conclusions References Tables Figures J I J I Back Close Full Screen / Esc
Print Version Interactive Discussion
c
EGS 2002
Abstract
A comparison and analysis of modeled and measured O3 profiles from the INDOEX campaign is presented. European Centre for Medium-Range Weather Forecast (ECMWF) meteorological analyses have been assimilated into the model to represent actual meteorology. The focus of this study is on two commonly observed features
5
in the O3 profiles: mid tropospheric O3 maxima (300–500 hPa) over the tropical In-dian Ocean, and the upper-tropospheric O3 laminae that occur above approximately 14 km (> 150 hPa) altitude. A comparison of model simulated O3 profiles with mea-sured O3 profiles indicates that the model realistically simulates the observed mid-tropospheric O3 maxima. An analysis of the model simulations shows that the major
10
source of the mid-tropospheric O3 maxima is advection of polluted air masses from continental biomass burning areas over Africa, with generally only a small contribution of stratospheric O3. Previous studies hinted at Stratosphere-Troposphere exchange (STE) along the subtropical jet (STJ) as the primary source of the mid-tropospheric O3 maxima over the Indian Ocean.
15
Analysis of the model simulations shows that the mechanism causing the mid-tropospheric transport of African biomass burning pollution and stratospheric air masses are frontal zones or waves passing along the subtropical jets, causing ad-vection of tropical air masses in the prefrontal zone. Furthermore, these frontal zones or waves also cause STE at the mid-latitudinal side of the STJ. The model simulations
20
also indicate that the contribution of STE in general is minor compared to advection and in situ tropospheric production of O3 for the mid-tropospheric O3budget over the Indian Ocean region.
An analysis of the model simulations shows that the model cannot exactly reproduce the measured upper-tropospheric O3 maxima. However, modeled O3 mixing ratios at
25
14 and 16 km altitude are significantly higher than at 8 to 12 km altitude, indicating that the model does simulate an upper-tropospheric layer. According to the model simu-lations, the sources of O3 at 14 and 16 km altitude are advection of both tropospheric
ACPD
2, 943–981, 2002
On the origin of tropospheric O3 over
the Indian Ocean
A. T. J. de Laat Title Page Abstract Introduction Conclusions References Tables Figures J I J I Back Close Full Screen / Esc
Print Version Interactive Discussion
c
EGS 2002
and stratospheric O3as well as in situ O3formation.
1. Introduction
The INDian Ocean Experiment (INDOEX) has provided invaluable observations about the chemical composition of the Indian Ocean atmosphere, in particular O3, during the winter monsoon period (typical November-April). The INDOEX measurements show
5
the presence of free-tropospheric layers with enhanced O3mixing ratios (de Laat et al., 1999; Zachariasse et al., 2000; Zachariasse et al., 2001). These layers can be found throughout the free troposphere. Generally, a typical O3 profile over the Indian Ocean can be divided into several layers. In the marine boundary layer O3 mixing ratios are generally low, caused by an O3-destructive environment (de Laat and Lelieveld, 2000).
10
Between the boundary layer and 8 km O3mixing ratios are higher. Between 8 and 12 to 14 km is the zone where convective outflow occurs. This layer can be either high or low in O3, depending on the origin of the air masses that were transported by the convection to this altitude. Finally, an upper-tropospheric layer may be found between 12 to 14 km and the tropopause (typically 17 km over the tropical Indian Ocean). In this
15
layer O3mixing ratios are generally high, although on occasion the layer of convective outflow may extend up to the tropopause.
The upper-tropospheric layers with enhanced O3 mixing ratios are also reported by Folkins et al. (1999), in O3 profiles measured at Samoa (14 S, 170 W) in the Pa-cific Ocean. Based on the O3− θe (equivalent potential temperature) correlation they
20
concluded that air masses below 14 km altitude generally were of tropospheric origin, whereas above 14 km the correlation suggested a stratospheric origin. Furthermore, Folkins et al. (1999) used temperature and humidity profiles to show that convection generally cannot reach altitudes above 14 km over tropical oceans.
Zachariasse et al. (2000) reported similar upper-tropospheric layers with enhanced
25
O3 during the First Field Phase (FFP) of INDOEX, which took place during February and March 1998. They used trajectory analysis and potential vorticity fields derived
ACPD
2, 943–981, 2002
On the origin of tropospheric O3 over
the Indian Ocean
A. T. J. de Laat Title Page Abstract Introduction Conclusions References Tables Figures J I J I Back Close Full Screen / Esc
Print Version Interactive Discussion
c
EGS 2002
from the European Center for Medium-Range Weather Forecast (ECMWF) to con-clude that STE along the northern hemispheric subtropical jet (NH-STJ) was the major source of the upper-tropospheric O3 laminae, either by shear-induced differential ad-vection or clear-air turbulence. An example of such upper-tropospheric O3 laminae is shown in Fig. 1, along with the corresponding temperature profiles. The tropopause
5
should be located around 16 to 17 km altitude according to temperature profiles. Upper-tropospheric O3 laminae can be found between 13 and 17 km, while an O3 minimum exists between 10 and 13 km, the typical altitude of convective outflow. The maximum altitude of approximately 13 km that convection can reach, as reported by Folkins et al. (1999), was also derived from the INDOEX temperature and humidity profiles.
10
The O3profiles in Zachariasse et al. (2000) often showed mid-tropospheric O3 max-ima. The mid-tropospheric O3 maxima were often very dry. Zachariasse et al. (2000) used this as an indication that the polluted boundary layer over the northern Indian Ocean and India could not be the source of the mid-tropospheric O3 maxima. They also noted that mid-tropospheric air masses might travel deep into the tropics.
15
In de Laat et al. (1999) similar mid-tropospheric O3maxima observed during March and April 1995 were reported. However, these measurements were made closer to Africa (see Fig. 2) and also close to the ITCZ. A model and trajectory analysis showed that the major source of these maxima was biomass burning over Africa, with a possi-ble contribution from STE along the southern hemispheric subtropical jet (SH-STJ). O3
20
profiles measured at R ´eunion Island during the same period also showed enhanced mid-tropospheric O3 mixing ratios (Baray et al., 1999). Their trajectory and potential vorticity analysis indicated that STE due to the interaction of tropical cyclone Marlene with the SH-STJ could give rise to the O3maxima they measured. Baray et al. (2001) noted in a comment on de Laat et al. (1999) that some profiles from both de Laat et
25
al. (1999) and Baray et al. (1999) might have the same source regions since they were measured at close locations and at approximately the same time. Baray et al. (2001) questioned whether biomass burning really could be the source because the biomass burning season in Africa south of the equator ends in December. However, in a
sub-ACPD
2, 943–981, 2002
On the origin of tropospheric O3 over
the Indian Ocean
A. T. J. de Laat Title Page Abstract Introduction Conclusions References Tables Figures J I J I Back Close Full Screen / Esc
Print Version Interactive Discussion
c
EGS 2002
sequent reply de Laat and Lelieveld (2001) used 3-D global chemistry-climate model simulations to show that STE was not the source of the O3maxima. Furthermore, they also noted that the modeled O3maxima were associated with high CO peaks, another indication that the source of the O3 maxima was tropospheric. In a case study of an extreme pollution event over R ´eunion Island (Randriambelo et al., 1999) the authors
5
indicate the need for more thorough model analyses of the chemical and dynamical processes taking place over the southern Indian Ocean region.
More recently, a study by de Laat et al. 2001) investigated the tropospheric source regions of Carbon Monoxide (CO) over the Indian Ocean. Some indications were found of a contribution of African biomass burning to free-tropospheric air masses over the
10
northern Indian Ocean.
2. Model description
The general circulation model (GCM) used for this study is the 19-layer European Cen-ter HAMburg Model (ECHAM), version 4. Model simulations were performed at T30-resolution, approximately 3.75◦×3.75◦with a time resolution of 1800 s. The model uses
15
a hybrid σ − ρ vertical coordinate system from the surface to 10 hPa. Average pres-sure levels are 990, 970, 950, 900, 840, 760, 670, 580, 490, 400, 320, 250, 190, 140, 100, 70, 50, 30 and 10 hPa. Corresponding approximate midlayer altitudes are 0.03, 0.14, 0.38, 0.78, 1.4, 2.1, 3.1, 4.2, 5.6, 7.0, 8.6, 10.2, 11.9, 13.8, 15.9, 18.0, 20.5, 23.8 and 31 km. Tracer transport is calculated using a semi-Lagrangian advection scheme
20
(Rasch and Williamson, 1990). Vertical transport is included through parameteriza-tions of vertical diffusion (Roeckner et al., 1996) and convection (Tiedtke, 1989). A detailed description of ECHAM version 4 is given by Roeckner et al. (1995), Haskins et al. (1995), and Chen and Roeckner (1996).
For this study I used the standard background chemistry scheme which includes
25
CH4-CO-NOX-HOX chemistry, emissions of NO and CO, dry deposition of O3, NOX, HNO3and H2O2, and wet deposition of HNO3and H2O2. Concentration changes due
ACPD
2, 943–981, 2002
On the origin of tropospheric O3 over
the Indian Ocean
A. T. J. de Laat Title Page Abstract Introduction Conclusions References Tables Figures J I J I Back Close Full Screen / Esc
Print Version Interactive Discussion
c
EGS 2002
to chemical reactions are calculated explicitly for all species by means of an Eulerian Backward Iterative (EBI) scheme (Hertel et al., 1993). A detailed description of the coupled chemistry GCM is given by Roelofs and Lelieveld (1995, 1997).
The model considers a biomass burning source of 6 Tg N yr−1 for NO and of 700 Tg CO yr−1 for CO, distributed according to Hao and Liu (1994). NO emissions
5
from soils, 5.5 Tg N yr−1, are distributed according to Yienger and Levy (1995). Light-ning NOX emissions, 5 Tg yr−1, are distributed according to Price and Rind (1992). The model considers global NO emissions from fossil fuel burning on the order of 21 Tg N yr−1, according to Benkovitz et al. (1996). Anthropogenic CO emissions are distributed according to Lelieveld and van Dorland, consisting of fossil fuel burning
10
(450 Tg CO yr−1), vegetation (100 Tg CO yr−1), natural non-methane hydrocarbon oxi-dation (280 Tg CO yr−1), anthropogenic non-methane hydrocarbon oxidation (300 Tg CO yr−1), oceanic emissions (40 Tg CO yr−1), and wildfires (30 Tg CO yr−1). The total NO and CO emissions considered in the model are 37.5 Tg NO yr−1 and 1900 Tg CO yr−1. Methane (CH4) surface concentrations are prescribed, ranging from
15
1772 ppm in the northern hemisphere to 1680 ppm in the southern hemisphere. The parameterization for dry deposition of O3, NOX and HNO3 is described in Ganzeveld and Lelieveld (1995) and Ganzeveld et al. (1998). The wet scavenging of HNO3 and H2O2 is calculated using the large-scale and convective cloud and pre-cipitation fields calculated on-line by the climate model as described by Roelofs and
20
Lelieveld (1995, 1997).
Stratospheric O3 mixing ratios are prescribed between 1 and 2 model layers above the tropopause up to the 10 hPa top level of the GCM. Transport of O3 across the tropopause depend directly on the air motions simulated by the GCM. The simulated tropopause is marked by a potential vorticity of 3.5 10−6K m2kg−1s−2 poleward of 20◦
25
latitude (Hoerling et al., 1993), and by a −2 K km−1temperature lapse rate equatorward of 20◦latitude.
The model realistically represents the seasonal variability of the O3 photochemical production and of O3 transport from the stratosphere (Roelofs and Lelieveld, 1995,
ACPD
2, 943–981, 2002
On the origin of tropospheric O3 over
the Indian Ocean
A. T. J. de Laat Title Page Abstract Introduction Conclusions References Tables Figures J I J I Back Close Full Screen / Esc
Print Version Interactive Discussion
c
EGS 2002
1997). Surface O3mixing ratios as measured in remote and relatively clean conditions are also reproduced by the model, but the model appears to underestimate the O3 mixing ratios in some polluted regions because of neglect of non-methane hydrocarbon chemistry (Roelofs et al., 1997).
In this study, the so-called “nudging” technique, using ECMWF analyses, was used
5
to simulate specific periods. This method is described more extensively by Jeuken et al. (1996) and de Laat et al. (1999). The periods for which the ECHAM model was nudged in this study were 16 March – 30 April 1995, and 1 February – 1 April 1998. We note that the nudging method has been used for several other studies (Kentarchos et al., 1999, 2000 and 2001; de Laat et al., 2001; de Laat and Lelieveld, 2000, 2002).
10
3. Observations
The O3profiles used in this study were obtained from two pre-INDOEX ship-campaigns. The first campaign took place during March and April of 1995 with the R/V Malcolm Baldrige. From this campaign we used sixteen O3profiles that were measured along a track from Durban, South Africa to Colombo, Sri Lanka (Fig. 2). Surface measurements
15
of several trace gases, aerosols and meteorological parameters were made along with the soundings. For a detailed description and results of this campaign see Rhoads et al. (1997) and de Laat et al. (1999).
The second campaign took place during February and March 1998 as part of the INDOEX First Field Phase (FFP), a larger preparatory campaign for the INDOEX
In-20
tensive Field Phase that would take place during the same months one year later in 1999. The Indian R/V Sagar Kanya sailed from southern India to the Indian Ocean east of Madagascar (Fig. 2). As in the 1995 campaign, O3sondes were launched and surface measurements were made.
The O3 sondes were balloon-borne Electrochemical Concentration Cell (ECC) O3
25
sondes (model 1z, En-Sci Corp., Boulder, Colorado) coupled to V ¨asi ¨al ¨a radiosondes (model RS80, V ¨asis ¨al ¨a USA, Woburn, Massachusetts). The accuracy of the O3sensor
ACPD
2, 943–981, 2002
On the origin of tropospheric O3 over
the Indian Ocean
A. T. J. de Laat Title Page Abstract Introduction Conclusions References Tables Figures J I J I Back Close Full Screen / Esc
Print Version Interactive Discussion
c
EGS 2002
varies from ±1–2 ppbv below 5 km to ±5 ppbv at 10 km and ±20 ppbv at 20 km altitude (Smit et al., 1994, 1995). Tables 1 and 2 summarize the ship tracks and locations where the O3profiles were measured.
4. Measured and modeled O3profiles
4.1. 1995 profiles
5
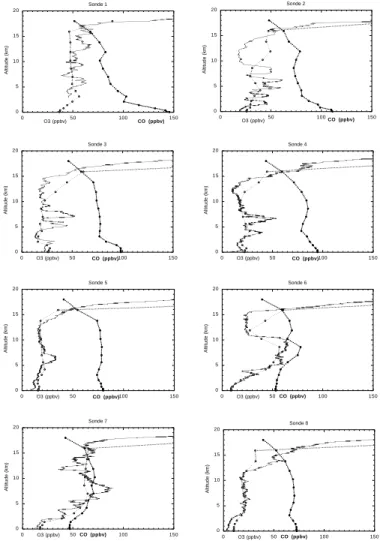
Figure 3a shows O3 profiles measured from the ship cruise of R/V Malcolm Baldrige during March and April 1995. An analysis of profiles 6 to 13 can be found in de Laat et al. (1999). Additionally profiles 9 and 10 are also discussed in de Laat and Lelieveld (2001). For the exact location of the O3 profiles, see Table 1. Profiles 6 to 13 were launched south of the ITCZ. The most striking features in profiles 6 to 13 are the
10
low O3 mixing ratios in the marine boundary layer (O3 destructive environment), mid-tropospheric O3 maxima, which can be attributed to biomass burning over Africa, and low upper-tropospheric O3 mixing ratios, which are likely caused by vertical transport of marine boundary layer air due to convection. Furthermore O3laminae are present in most profiles between 14 and 17 km, most notably profiles 6 and 7. Figure 3a and b
15
show the modeled O3and CO profiles. Generally speaking the model reproduces the observed O3profiles. The model cannot reproduce smaller O3 features in the profiles because of the low horizontal and vertical resolution. The low horizontal resolution may cause some displacement of modeled gradients compared to actual location of the gradients because the observations were done in a region with sharp horizontal
20
gradients. This may result in discrepancies between modeled and observed O3 pro-files (for example profile 9, see de Laat et al., 1999, for a detailed analysis). Modeled O3 correlates well with modeled CO for mid-tropospheric O3 maxima, indicating that the mid-tropospheric O3 maxima have a tropospheric origin. Trajectories showed that the air masses originated from biomass burning regions over central Africa (de Laat et
25
ACPD
2, 943–981, 2002
On the origin of tropospheric O3 over
the Indian Ocean
A. T. J. de Laat Title Page Abstract Introduction Conclusions References Tables Figures J I J I Back Close Full Screen / Esc
Print Version Interactive Discussion
c
EGS 2002
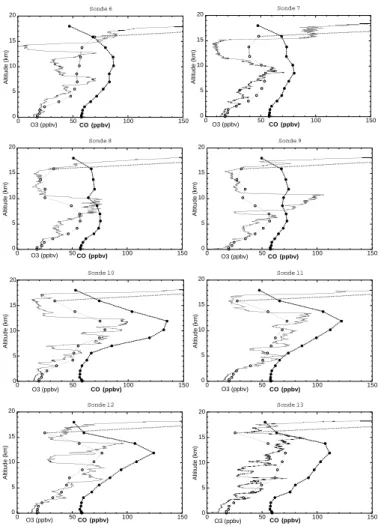
Figure 3b also shows O3 profiles from soundings launched during the 1995 cruise of the R/V Malcolm Baldrige, which have not been published before. The ITCZ was lo-cated close to profiles 14 and 15. Boundary layer O3is low, whereas free tropospheric O3 is high. With the exception of profile 15 and maybe profile 18, no clear upper-tropospheric O3 minima can be discerned in the measured profiles. This is not the
5
case for the modeled profiles, which still show upper-tropospheric minima. However, the largest discrepancies between the measured and modeled profiles occur close to the ITCZ (profiles 14 to 17). It can be expected that the model cannot reproduce the exact location of the ITCZ at the current model resolution because generally the con-vective surface area (typically 10–1000 km2) is much smaller that the model gridsize
10
(typically 100 000 km2). Further away from the ITCZ (profiles 18 to 21) this is less of a problem.
Mid-tropospheric O3mixing ratios are generally high for all profiles, also north of the ITCZ, and are reproduced by the model. As with profiles 6 to 13 in Fig. 3a, modeled mid-tropospheric O3peaks are associated with high modeled CO mixing ratios, which
15
is indicative of a tropospheric O3source.
O3laminae occur between 12 and 17 km altitude in all measured O3profiles for 1995. The model does not exactly reproduce these laminae. However, in profiles 6, 7 and 21 there is no O3minimum anymore at 14 and 16 km altitude. This is a first indication that model simulates an tropospheric layer that may resemble the observed
upper-20
tropospheric maxima.
4.2. 1998 (FFP) profiles
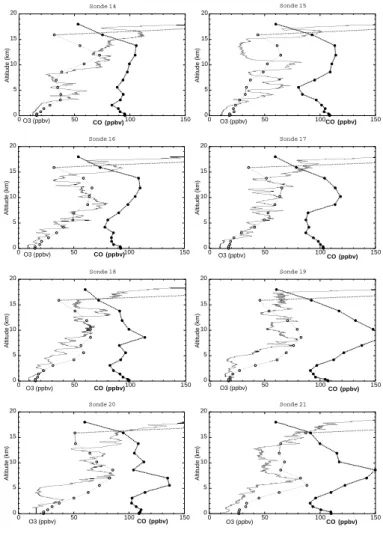
Figure 4a and b show vertical profiles from the 1998 INDOEX IFP O3soundings. An analysis of these profiles can be found in Zachariasse et al. (2000). For the details of the location and time of launch of these soundings, see Table 2. The overall features of
25
the 1998 profiles are similar to those measured in 1995: Low boundary layer O3mixing ratios, mid-tropospheric maxima and minima, and upper-tropospheric O3laminae be-tween 14 and 17 km altitude. However, mid-tropospheric O3mixing ratios are generally
ACPD
2, 943–981, 2002
On the origin of tropospheric O3 over
the Indian Ocean
A. T. J. de Laat Title Page Abstract Introduction Conclusions References Tables Figures J I J I Back Close Full Screen / Esc
Print Version Interactive Discussion
c
EGS 2002
lower for the FFP-profiles than for the 1995 profiles. Modeled O3profiles are similar to measured O3 profiles. Large discrepancies only exist for profile 15, with an observed mid-tropospheric minimum and a modeled mid-tropospheric maximum, and profile 2, for which the model does not reproduce the observed upper-tropospheric minimum. As for the 1995 profiles, the model does not capture the upper-tropospheric O3 laminae
5
very well, but no upper tropospheric O3 minima are present in the modeled profiles, with the exception of profiles 14 and 15. Furthermore, O3 mixing ratios increase from an altitude of 12 km and higher for most modeled profiles.
Modeled CO profiles corresponding to the measured O3 profiles are somewhat dif-ferent to the modeled 1995 CO profiles. Generally, modeled mid-tropospheric CO
10
mixing ratios are lower during 1998 than during 1995. This corresponds with lower mid-tropospheric O3mixing ratios for the 1998 profiles, which one would expect if O3 and CO have the same source. Boundary layer CO mixing ratios north of the ITCZ are higher compared to 1995. Considering that the FFP profiles were measured earlier in the year (March) compared to 1995 (April), the discrepancies can be explained as
15
follows. According to de Laat and Lelieveld (2002) the strength of the boundary layer continental outflow from India to the Indian Ocean weakens considerably during March and April, lowering the boundary layer levels of pollution. Furthermore, the convec-tive outflow in the free troposphere (divergent flow away from the convection) at the ITCZ will be balanced by the mid-tropospheric inflow of polluted air masses from the
20
subtropics. A weak ITCZ allows the polluted free tropospheric subtropical air masses north and south of the equator to be advected further equatorward than in case of a strong ITCZ. The ITCZ is generally stronger during March than during April over the Indian Ocean. Therefore, more boundary layer air is vertically mixed at the ITCZ dur-ing March than durdur-ing April. Furthermore, a stronger ITCZ causes a stronger divergent
25
upper-tropospheric flow that can transport the “clean” air masses further away from the ITCZ. Thus, free tropospheric O3and CO mixing ratios will be lower and cover a larger area during March compared to April. The result is that free tropospheric O3and CO mixing ratios are lower for the 1998 profiles compared to the 1995 profiles.
ACPD
2, 943–981, 2002
On the origin of tropospheric O3 over
the Indian Ocean
A. T. J. de Laat Title Page Abstract Introduction Conclusions References Tables Figures J I J I Back Close Full Screen / Esc
Print Version Interactive Discussion
c
EGS 2002
The ECHAM model also provides a separate tracer for O3 that originates from the stratosphere (hereafter O3s). The influence of STE along the subtropical jets on tropo-spheric O3 can be derived for the modeled profiles using this tracer. Figure 5 shows modeled O3s profiles for the 1998 soundings. With the exception of profiles 13 and 14, the contribution of O3s to total tropospheric O3is relatively small (less than 20%). On
5
the other hand, the mid-tropospheric O3features in profiles 6, 7, 12, 13 and 14 are at least partly of stratospheric origin. The contribution of O3s can be as high as 50% for profiles 13 and 14.
Modeled CO mixing ratios above 12 km altitude decrease to approximately 50 to 60 ppbv around 18 km altitude (see Figs. 3 and 4). Modeled free tropospheric CO mixing
10
ratios higher than 50 to 60 ppbv indicates a tropospheric origin, while lower mixing ratios indicate a stratospheric origin (unless O3 mixing ratios are low, which indicates vertical mixing of very clean marine boundary layer air masses). Such low CO mixing ratios are not modeled for any of the 1998 (or 1995) profiles. Interestingly, the highest O3s contribution is modeled for profiles 13 and 14, which also showed the highest
mid-15
tropospheric CO mixing ratios modeled for 1998. Based on the modeled profiles and the correlation between O3 and CO peaks for both 1995 and 1998 we can conclude that, in general, mid-tropospheric O3maxima have a tropospheric origin. According to 1998 profiles 13 and 14, there also may be a relation between STE and the advection of O3and CO rich tropospheric air.
20
5. Mid-tropospheric O3 and CO maxima: source region and advection mecha-nism
Now that it is established that the mid-tropospheric O3 and CO maxima have tropo-spheric source regions, we can try to determine what the source regions are and how the pollution is advected to the Indian Ocean. For that, we first need to understand the
25
dynamical processes in this region.
ACPD
2, 943–981, 2002
On the origin of tropospheric O3 over
the Indian Ocean
A. T. J. de Laat Title Page Abstract Introduction Conclusions References Tables Figures J I J I Back Close Full Screen / Esc
Print Version Interactive Discussion
c
EGS 2002
and Carmichael, 1993; Roelofs et al., 1997). In particular, biomass burning is the major source of these pollutants (Crutzen and Andrae, 1990; Crutzen and Carmichael, 1993; Hao and Liu, 1994; Galanter et al., 2000; de Laat et al., 2001). CO production will also occur indirectly by way of oxidation of higher hydrocarbons, which are addition-ally emitted by biomass burning. The biomass-burning season in Africa is very much
5
dependent on the time of year (Hao and Liu, 1994). Generally, biomass burning oc-curs during the local dry season, causing a maximum in pollution levels. Furthermore, enhanced O3formation occurs during the dry season because of increased photodis-sociation due to reduced cloudiness. On the other hand, O3formation will be reduced during the wet season because of smaller biomass burning emissions and reduced
10
photodissociation due to increased cloudiness.
For the free troposphere the situation is different. CO is emitted at the surface (either directly or by oxidation of (higher) hydrocarbons), and gradually decreases away from its sources. This will result in the highest CO mixing ratios near the surface, and lower mixing ratios aloft. On the other hand, tropospheric O3is mostly produced by a catalytic
15
reaction chain involving NOX(e.g. Graedel and Crutzen, 1993). Therefore not only will O3be produced close to the source regions of its precursors, but as the precursors are transported, it will also be produced during advection (Chatfield and Delaney, 1990; Pickering et al., 1992). This so-called “mix-then-cook” mechanism, in combination with O3 removal that occurs at the surface, causes O3mixing ratios to be generally higher
20
in the free troposphere than at the surface. Furthermore, free tropospheric pollution is mostly removed by reaction with OH. In turn, OH depends largely on the presence of moisture (H2O). Because moisture decreases with altitude, the lifetime of O3 and its precursors CO and NOX can become quite long, enabling plumes of pollution to travel long distances, especially under dry conditions as they occur in the descending
25
branches of the Hadley circulation.
There exists a distinct difference in the chemical composition of the free troposphere over Africa between regions north and south of the equator due to differences in mete-orology, emissions and photochemistry. Major convection occurs south of the equator
ACPD
2, 943–981, 2002
On the origin of tropospheric O3 over
the Indian Ocean
A. T. J. de Laat Title Page Abstract Introduction Conclusions References Tables Figures J I J I Back Close Full Screen / Esc
Print Version Interactive Discussion
c
EGS 2002
during the winter monsoon period (Hastenrath, 1988), following the maximum in solar insolation, while biomass burning mainly occurs north of the equator (Hao and Liu, 1994). This will lead to differences in the free tropospheric chemical composition. The average modeled O3and CO mixing ratios for February and March 1998 at the surface and at 10 km altitude as well as the modeled precipitation in Fig. 6 reflect these di
ffer-5
ences. The precipitation is, for February and March, restricted to the southern part of the African continent. The surface O3 and CO mixing ratios have a maximum north of the convective regions. Maximum free tropospheric CO mixing ratios are found at the edge of the regions with high surface O3 and CO mixing ratios and precipitation (Fig. 6). This maximum is more difficult to distinguish in free tropospheric O3, because
10
of the ongoing O3production after air masses are advected away from the convection, and because of the influence of O3s. Figure 6 also shows that at the 10 km altitude level CO is advected (on average) from central Africa along the northern and south-ern hemispheric subtropical jets (NH-STJ and SH-STJ) at 20◦–30◦ towards the Indian Ocean. This advection cannot be discerned in the average O3 mixing ratios at 10 km
15
because of the influence of stratospheric O3. By looking at residual O3(= tropospheric O3, hereafter referred to as O3t), i.e. total O3minus O3s (Fig. 7), a pattern similar to CO for tropospheric O3along NH-STJ exists. Advection of O3from central Africa also oc-curs along the SH-STJ during February 1998, while it is absent in CO during the same month. This is also the result of the “mix-then-cook” chemistry of O3, which causes O3
20
production away from the convective regions, even at moderate pollution levels. The mechanism responsible for the advection along the subtropical jets can be de-termined from Figs. 8a and b, showing modeled O3, CO, O3s and O3t and the wind fields for two days during March 1998 at 10 km altitude (10 and 13 March, Day of Year (DOY) 69 to 72). For clarity, only CO mixing ratios above 100 ppbv, O3 mixing ratios
25
above 70 ppbv, O3s mixing ratios above 50 ppbv and O3t mixing ratios above 40 ppbv are shown.
On DOY 69, high CO mixing ratios are located over central Africa with corresponding O3mixing ratios reaching 70 ppbv. A wave in the NH-STJ is approaching from the west
ACPD
2, 943–981, 2002
On the origin of tropospheric O3 over
the Indian Ocean
A. T. J. de Laat Title Page Abstract Introduction Conclusions References Tables Figures J I J I Back Close Full Screen / Esc
Print Version Interactive Discussion
c
EGS 2002
(at 0◦E), causing winds in front of the wave to change from westerly to southwesterly. The divergent flow (convective outflow) at 10 km altitude over central Africa is relatively constant. Therefore, the wave at the STJ causes an acceleration of the flow just south of the wave. This initiates advection of polluted African air masses. North of the NH-STJ O3 mixing ratios are high, reflecting the change in the height of the tropopause
5
north and south of the STJ. Moreover, at the latitude with the highest wind speeds the largest gradients in O3 occur. At the SH-STJ the increase in O3 mixing ratios is not as distinct as along the NH-STJ. No east-west oriented O3 gradient exists along the SH-STJ, opposite to the NH-STJ. High O3 mixing ratios occur in bands that are associated with the frontal zones of low mid-latitude low-pressure areas. The
cross-10
frontal circulation causes strong downward motions just behind the front, transporting O3from the stratosphere to the troposphere. The differences in O3mixing ratios along the NH-STJ and SH-STJ reflect the differences in the dynamical structure of the STJ. The NH-STJ is generally stronger and more persistent than the SH-STJ (Hastenrat, 1998), which results in an east-west oriented NH-STJ and a more meandering
SH-15
STJ. At the same time, a band with high O3 is located along the SH-STJ over the southern tip of Africa (30◦S, 25◦E). Winds change from southwest to west at this band, indicative of a frontal zone.
The differences in O3s and O3t reflect the differences in CO and O3. O3s is high at the northern edge of the NH-STJ, whereas along the SH-STJ O3s is the cause of the
20
high O3 mixing ratios. The highest O3t mixing ratios are located over central Africa, while it is being advected east along the subtropical jets. The relatively constant O3t mixing ratios along the subtropical jets indicate that O3production or depletion is small. On DOY 72 the wave along the NH-STJ has advanced to the Arabian Sea, with advection of CO-rich air masses in the wake of the wave. The polluted air masses
25
have advanced to over India. In the wake of the wave the circulation changes from westerly to southwesterly, thereby injecting the polluted air masses into the tropics. At the same time O3s descends into the tropical troposphere at the wave, but remains north of the African pollution. This STE over India may be enhanced by the interaction
ACPD
2, 943–981, 2002
On the origin of tropospheric O3 over
the Indian Ocean
A. T. J. de Laat Title Page Abstract Introduction Conclusions References Tables Figures J I J I Back Close Full Screen / Esc
Print Version Interactive Discussion
c
EGS 2002
of the wave with the Himalayas and/or the Tibetan plateau. The frontal zone along the SH-STJ has advanced to 70◦E. Polluted African air masses are advected eastward north of the frontal zone. O3s is transported downwards south of the frontal zone. The high O3t mixing ratios are clearly associated with high CO mixing ratios. Furthermore, high O3s and O3t mixing ratios do not occur simultaneously, but remain separated,
5
indicating slow mixing.
As both the “northern wave” and the “southern front” continue to advance further east, the flow along the subtropical jets becomes westerly again, which will shut down the advection of polluted air masses from central Africa, while at the same time STE vanishes. Polluted air masses (CO and O3, the latter both from tropospheric and
strato-10
spheric origin) have entered the descending branches of the Hadley circulation, and will be slowly advected towards the ITCZ. The pollution is gradually removed during this advection.
This sequence will occur every time waves or fronts travel along the subtropical jets. It is important to note that, as these fronts have passed the African continent, they will
15
be rich in O3both poleward (stratospheric O3) and equatorward (tropospheric pollution) of the subtropical jets. Therefore, high free tropospheric O3 mixing ratios over the Indian Ocean are not an indication of a stratospheric origin, even though trajectories indicate advection along the subtropical jets. Low humidity is also not an indicator for a stratospheric origin because air masses dry out very rapidly in the downward branch of
20
the Hadley circulation. Frontal mixing of air masses may complicate the situation even more.
6. Upper tropospheric O3laminae: model interpretation
The comparison of O3 profiles with model results indicates that the model produces enhanced O3 mixing ratios at 14 and 16 km altitude. The model cannot reproduce
25
these layers exactly in location and mixing ratios. The strong decrease of CO mixing ratios at 14 and 16 km indicates that little convective transport occurs to altitudes above
ACPD
2, 943–981, 2002
On the origin of tropospheric O3 over
the Indian Ocean
A. T. J. de Laat Title Page Abstract Introduction Conclusions References Tables Figures J I J I Back Close Full Screen / Esc
Print Version Interactive Discussion
c
EGS 2002
12 to 14 km. Modeled O3 mixing ratios at 14 and 16 km altitude for 1998 are generally higher than those between 8 to 12 km altitude. Decreased convective transport of O3 -precursors does not cause a strong decrease in O3mixing ratios. Increased ultraviolet radiation could enhance O3formation, and STE may cause some additional transport. O3 laminae appear to be absent close to or at the ITCZ, where low O3 mixing
ra-5
tios often extend all the way up to the tropopause (e.g. 1995 profiles 8 to 13, 1998 profile 6). An explanation may be the difference between normal or “single cell” con-vection, and organized convection in tropical storms and cyclones. Normal convection generally does not reach the tropopause (Folkins et al., 1999). On the other hand, organized convection does reach the tropopause, thereby transporting marine
bound-10
ary layer air masses, which are low in O3, all the way up to the tropopause. Cyclones occur mostly close to the equator over the tropical (Indian) ocean, while decreasing in strength and frequency and occurrence towards higher latitudes. Furthermore, the upper-tropospheric average flow along the equator is westward. Thus, after a cyclone has “cleaned” the troposphere, the upper-tropospheric O3-depleted air masses will
15
slowly move to the west around the equator. A possible explanation may be tropical cyclone activity. During the 1995 campaign, a tropical cyclone was located over the central Indian Ocean (“Marlene”) just south of the equator (Baray et al., 1999; de Laat et al., 1999). A trajectory study for the 1995 profiles 7, 8 and 9 showed some trajecto-ries being lifted by “Marlene” from the central Indian Ocean marine boundary layer to
20
the upper tropical troposphere (de Laat et al., 1999).
To determine the source of modeled O3at 14 and 16 km altitude, Fig. 9 shows mod-eled O3, O3s and residual O3at the 16 km altitude level. The contribution of residual O3 at tropical latitudes is equal to or even higher than the contribution of O3s. O3s starts to dominate towards the subtropical jets, as can be expected because of transport, and
25
the fact that the tropopause height at mid-latitudes is much lower. However, a consid-erable amount of residual (tropospheric) O3 still exists at subtropical latitudes at the 16 km altitude level. Evidently, even though convection generally does not reach the al-titude of 16 km, the remaining vertical transport results in a chemical composition of the
ACPD
2, 943–981, 2002
On the origin of tropospheric O3 over
the Indian Ocean
A. T. J. de Laat Title Page Abstract Introduction Conclusions References Tables Figures J I J I Back Close Full Screen / Esc
Print Version Interactive Discussion
c
EGS 2002
atmosphere at 16 km that favors O3 formation. Therefore, the upper-tropospheric O3 laminae are probably of both tropical (transport and in situ formation) and stratospheric (transport) origin.
7. Summary
In this study I have analyzed INDOEX O3 profiles measured during the Indian winter
5
monsoon period from two ship campaigns during 1995 and 1998. A comparison was made with O3profiles obtained from model simulations with the nudged version of the 3-Dimensional global chemistry circulation model ECHAM. We point out that:
– The model reproduces the general features of the O3 profiles over the Indian Ocean: low boundary layer O3 mixing ratios, the mid-tropospheric O3 maxima
10
between the boundary layer and approximately 8 km altitude, O3mixing ratios in the convective outflow region between 8 and 12 to 14 km altitude, which may be either high or low, and elevated O3 mixing ratios between 12 to 14 km altitude and the tropopause (approximately 17 km over the Indian Ocean). Furthermore, with the exception of the upper-tropospheric maxima, modeled and measured O3
15
mixing ratios are comparable. The model also reproduces the individual profiles in the descending branches of the Hadley circulation very well, both north and south of the ITCZ.
– Modeled peaks in mid-tropospheric O3are associated with peaks in CO. Because of the relation between O3 and CO the mid-tropospheric O3 peaks must be of
20
tropospheric origin. This is confirmed by modeled O3s profiles; apart from the 1998 profiles 13 and 14, O3s does not contribute more than 20% to the total O3 mixing ratios at any tropospheric level.
– The model cannot reproduce the O3 profiles close to the ITCZ in detail. This is most evident for the 1995 profiles because a number of them were measured at,
ACPD
2, 943–981, 2002
On the origin of tropospheric O3 over
the Indian Ocean
A. T. J. de Laat Title Page Abstract Introduction Conclusions References Tables Figures J I J I Back Close Full Screen / Esc
Print Version Interactive Discussion
c
EGS 2002
or close to, the ITCZ. The most likely explanation is that the model does not re-produce the exact location of the ITCZ convection because of the low horizontal resolution and the fact that convection is a sub-grid scale process. Furthermore, the model cannot reproduce the 1998 profile taken close to the Indian coast (pro-file 15).
5
– The measurements show upper-tropospheric O3laminae between approximately 12 to 14 km and the tropopause, often with O3mixing ratios exceeding 100 ppbv. The O3 laminae are most obvious at subtropical latitudes, while they appear to be absent around the equator and the ITCZ. This indicates that the residual layer may originate from regions around the subtropical jets. The residual layer around
10
the equator and the ITCZ may be removed by organized convection in tropical storms and cyclones. The model simulation shows enhanced O3mixing ratios at 14 and 16 km altitude, although it cannot reproduce enhanced O3 mixing ratios for all profiles with upper-tropospheric O3laminae. Furthermore, modeled upper-tropospheric O3mixing ratios are generally lower than measured O3mixing ratios
15
at 14 and 16 km altitude, whereas upper-tropospheric CO mixing ratios generally decrease sharply. This indicates a decrease in convective mixing.
8. Discussion
The analysis of model simulations reveals the mechanism behind the mid-tropospheric O3peaks in the downward branches of the Hadley circulation. During the winter
mon-20
soon period a mid and upper-tropospheric “reservoir” of polluted air masses with high O3and CO mixing ratios is present over central Africa. This “reservoir” is fueled by sur-face biomass burning in equatorial Africa. Upper-tropospheric divergence due to con-vective outflow causes the pollution to slowly propagate north and south over Africa. Waves or frontal zones propagate along the subtropical jets and cause winds along
25
ACPD
2, 943–981, 2002
On the origin of tropospheric O3 over
the Indian Ocean
A. T. J. de Laat Title Page Abstract Introduction Conclusions References Tables Figures J I J I Back Close Full Screen / Esc
Print Version Interactive Discussion
c
EGS 2002
(NH) or north-west (SH). This causes advection of polluted air masses from the African reservoir to the edge of the subtropical jets. At the STJ the polluted air masses are advected eastward in front of the frontal zone. The polluted air masses enter the down-ward branches of the Hadley circulation over the Indian Ocean, causing an increase in O3and CO mixing ratios. In addition to this mechanism air masses of stratospheric
5
origin may enter the troposphere at the back of the frontal zones that propagate along the STJ. However, the model simulations also indicate that O3s is not advected that deep into the tropics. Furthermore, due to their slow downward motion over the sub-tropical Indian Ocean the polluted tropospheric air masses dry out. This results in very low humidity, which could easily be misinterpreted as a stratospheric signature, while
10
it is simply a result of local dynamics.
Studies by Thompson et al. (1996) and Chatfield et al. (1996) for the SAFARI (South-ern Africa Fire Atmospheric Research Initiative) and TRACE A (Transport and Atmo-spheric Chemistry Near the Equator-Atlantic) campaigns show a remarkable resem-blance with the analysis presented in this study, even though the above mentioned
15
studies were carried out for October 1992. Part of the mid-tropospheric air masses over central and southern Africa are advected southeast and subsequently along the SH-STJ eastward over the southern Indian Ocean (plate 3 and 4 of Thompson et al., 1996; Fig. 1 of Chatfield et al., 1996). Furthermore, part of the air masses are also advected to northern Africa and then along the NH-STJ eastward over southern Asia
20
(plate 4 of Thompson et al.,1996).
The observed O3laminae over the Indian Ocean also occur at altitudes higher than ”normal” convection generally reaches, much like the reported upper-tropospheric O3 laminae by Folkins et al. (1999). This contributes to the idea of the upper tropical troposphere as a part of the troposphere that undergoes little interaction with the rest
25
of the troposphere. As a consequence, these layers may be very persistent.
Modeled (sub-) tropical O3mixing ratios at 14 and 16 km altitude levels are generally higher than in the convective outflow region between 8 to 12 km, the latter often recog-nizable by peaks in CO mixing ratios. The model cannot reproduce the exact shape of,
ACPD
2, 943–981, 2002
On the origin of tropospheric O3 over
the Indian Ocean
A. T. J. de Laat Title Page Abstract Introduction Conclusions References Tables Figures J I J I Back Close Full Screen / Esc
Print Version Interactive Discussion
c
EGS 2002
and the O3 mixing ratios at, the measured upper-tropospheric O3laminae. This may be related to the too coarse vertical model resolution in this region.
There is a large discrepancy between measured and modeled O3 in 1998 profile 14. The measured profile shows a maximum just above the boundary layer, which is absent in the modeled profile. A similar layer has also been reported for aerosol
mea-5
surements (Leon et al., 2001; M ¨uller et al., 2001; Reiner et al., 2001), CO (de Laat et al., 2001; Reiner et al., 2001), acetone, acetonitrile and SO2 (Reiner et al., 2001). A likely explanation for this feature is the local sea breeze circulation at the Indian coasts (de Laat et al. 2001; Leon et al., 2001). The sea breeze circulation causes polluted continental air masses to be lifted above the (marine) boundary layer after which they
10
are advected from the continent to the ocean. The pollution will be restricted to a shal-low layer above the (marine) boundary layer because of the large-scale subsidence over the northern Indian Ocean (the downward branch of the Hadley circulation). The ECHAM model resolution is too coarse to simulate the sea-breeze circulation. In addi-tion, the measured O3 profile has a mid-tropospheric minimum, whereas the modeled
15
profile has a maximum, corresponding with a maximum in modeled O3s. A wave in the NH-STJ passed over northern India during the measurements of 1998 profile 14. This caused stratospheric air to enter the troposphere over northern India. The location where the profile was measured in the model (just west of India) was at the edge of this “O3s-plume”, with the maximum in O3s located further east. Thus, the modeled
20
profile was taken in an area with large horizontal O3gradients.
9. Conclusions
In this study we have shown that the nudged ECHAM model can reproduce mea-sured O3 profiles from two pre-INDOEX campaigns. The subtropical Indian Ocean atmosphere consists of low boundary layer O3, mid-tropospheric O3 maxima, either
25
O3 minima or maxima at the convective outflow region (8–12 km), and O3 laminae between the convective outflow region and the tropopause. The O3 maxima in the
ACPD
2, 943–981, 2002
On the origin of tropospheric O3 over
the Indian Ocean
A. T. J. de Laat Title Page Abstract Introduction Conclusions References Tables Figures J I J I Back Close Full Screen / Esc
Print Version Interactive Discussion
c
EGS 2002
mid-troposphere as well as in the convective outflow region are caused by advection of polluted tropical African air masses. This advection is closely related to the passage of waves and frontal zones along the subtropical jets. Such waves or fronts also cause transport of stratospheric air masses to the troposphere, but model simulations show that stratospheric air masses generally do not advance deep into the tropics.
5
The upper-tropospheric O3 laminae may be caused by a combination of in situ O3 production and STE. These layers may be removed by organized tropical convection in tropical storms and cyclones. The ECHAM model produces a residual layer with en-hanced O3mixing ratios at similar altitudes (between 12 to 14 and 17 km) as where O3 laminae with high mixing ratios were measured. The modeled residual layer consists
10
of a mixture of tropospheric and stratospheric air masses.
Most discrepancies between observations and model simulations are attributed to the model resolution. Therefore, a more detailed study in the near future will be carried out with a model that has a higher resolution both in horizontal and vertical directions.
Acknowledgements. The author thanks Kevin Rhoads (currently at . . ., USA) and Russ
Dick-15
erson (University of Maryland, USA) for making the 1995 O3soundings available and Herman
Smit from the Institute for Chemistry of the Polluted Atmosphere in J ¨ulich for making the 1998
O3 soundings available. The former director of the Indian Meteorological Institute, Dr. Dev
Sikka, is thanked for his insights, advice and suggestions.
References
20
Baray, J. L., Ancellet, G., Randriambelo, T., and Baldy, S.: Tropical cyclone Marlene and stratosphere-troposphere exchange, J. Geophys. Res., 104, 13 953–13 970, 1999.
Baray, J. L., Randriambelo, T., Baldy, S., and Ancellet, G.: Comment on “Tropospheric O3
distribution over the Indian Ocean during spring 1995 evaluated with a chemistry-climate model” by de Laat, A. T. J., et al., J. Geophys. Res., 106, 1365–1368, 2001.
25
Benkovitz, C. M., Scholtz, M. T., Pacyna, J., Tarrason, L., Dignon, J., Voldner, E. C., Spiro, P. A., Logan, J. A., and Graedel, T. E.: Global gridded inventories of anthropogenic emissions of sulfur and nitrogen, J. Geophys. Res., 101, 29 239–29 254, 1996.
ACPD
2, 943–981, 2002
On the origin of tropospheric O3 over
the Indian Ocean
A. T. J. de Laat Title Page Abstract Introduction Conclusions References Tables Figures J I J I Back Close Full Screen / Esc
Print Version Interactive Discussion
c
EGS 2002 Chatfield, R. B. and Delaney, A. C.: Convection links biomass burning to increased tropical
ozone: However, models will tend to overpredict O3, J. Geophys. Res., 95, 18 473–18 488,
1990.
Chatfield, R. B., Vastano, J. A., Singh, H. B., and Sachse, G.: A general model on how fire
emissions and chemistry produce African/oceanic plumes (O3, CO, PAN, and smoke) in
5
TRACE A, J. Geophys. Res., 101, 24 791–24 306, 1996.
Chen, C. T. and Roeckner, E.: Validation of the earth radiation budget as simulated by the Max Planck Institute for Meteorology general circulation model ECHAM4 using satellite ob-servations of the Earth Radiation Budget Experiment, J. Geophys. Res., 101, 4269–4287, 1996.
10
Crutzen, P. J. and Andreae, M. O.: Biomass burning in the tropics: Impact on atmospheric chemistry and biogeochemical cycles, Science, 250, 1669–1678, 1990.
Crutzen, P J. and Carmichael, G. R.: Modeling the influence of fires on atmospheric chemistry, in: Fire in the Environment: The Ecological, Atmospheric, and Climatic Importance of Vege-tation Fires, (Eds) Crutzen, P. J. and Goldammer, J. G., John Wiley, New York, pp. 89–106,
15
1993.
de Laat, A. T. J., Zachariasse, M., Roelofs, G. J., van Velthoven, P., Dickerson, R. R., Rhoads, K.
P., Oltmans, S. J., and Lelieveld, J.: Tropospheric O3distribution over the Indian Ocean
dur-ing sprdur-ing 1995 evaluated with a chemistry-climate model, J. Geophys. Res., 104, 13 881– 13 893, 1999.
20
de Laat, A. T. J. and Lelieveld, J.: The diurnal O3cycle in the tropical and subtropical marine
boundary layer, J. Geophys. Res., 105, 11 547–11 559, 2000.
de Laat, A. T. J, Dickerson, R. R., Lelieveld, J., Lobert, J., and Roelofs, G. J.: Source analysis of
Carbon MoNOXide pollution during INDOEX, J. Geophys. Res., D22, 28 481–28 496, 2001.
de Laat, A. T. J. and Lelieveld, J.: Reply, J. Geophys. Res., 104, 1369–1371, 2001.
25
de Laat, A. T. J. and Lelieveld, J.: Interannual variability of the Indian winter monsoon circulation and consequences for pollution levels over the Indian Ocean, J. Geophys. Res., submitted, 2002.
Folkins, I., Loewenstein, M., Podolske, J., Oltmans, S., and Proffitt, M.: A barrier to vertical mixing at 14 km in the tropics: Evidence from ozonesondes and aircraft measurements, J.
30
Geophys. Res., 104, 22 095–22 102, 1999.
Galanter, M., Levy, II, H., and Carmichael, G. R.: Impacts of biomass burning on tropospheric
ACPD
2, 943–981, 2002
On the origin of tropospheric O3 over
the Indian Ocean
A. T. J. de Laat Title Page Abstract Introduction Conclusions References Tables Figures J I J I Back Close Full Screen / Esc
Print Version Interactive Discussion
c
EGS 2002 Ganzeveld, L. N. and Lelieveld, J.: Dry deposition parameterization in a chemistry – general
circulation model and its influence on the distribution of chemically reactive trace gases, J. Geophys. Res., 100, 20 999–21 012, 1995.
Ganzeveld, L. N., Lelieveld, J., and Roelofs, G. J.: A dry deposition parameterization for sulfur oxides in a chemistry and general circulation model, J. Geophys. Res., 103, 5679–5694,
5
1998.
Graedel, T. E. and Crutzen, P.: Atmospheric change: An earth perspective, AT&T, pp. 446, Chapter 8, 1993.
Hao, W. M. and Liu, M. H.: Spatial and temporal distribution of tropical biomass burning, Global Biogeochem. Cycles, 8, 495–503, 1994.
10
Haskins, R. D., Barnett, T. P., Tyree, M. M., and Roeckner, E.: Comparison of cloud fields from an atmospheric general circulation model, in situ and satellite measurements, J. Geophys. Res., 100, 1367–1378, 1995.
Hastenrath, S.: Climate and circulation in the tropics, Kluwer Academic Press, pp. 455, 1988. Hertel, O., Berkowicz, R., Christensen, J., and Hov, O.: Test of two numerical schemes for use
15
in atmospheric transport-chemistry models, Atmos. Env. 27A, 2591–2611, 1993.
Hoerling, M. P., Schaack, T. K., and Lenzen, A. J.: A global analysis of stratospheric tropo-spheric exchange during northern winter, Mon. Wea. Rev., 121, 162–172, 1993.
Jeuken, A. B. M., Siegmund, P.C., Heijboer, L. C., Feichter, J., and Bengtson, L.: On the potential of assimilating meteorological analysis in a climate model for the purpose of model
20
validation, J. Geophys. Res., 101, 16 939–16 950, 1996.
Kentarchos, A. S., Roelofs, G. J., and Lelieveld, J.: Model study of a stratospheric intrusion
event at lower midlatitudes associated with the development of a cutoff low, J. Geophys.
Res., 104, 1717–1727, 1999.
Kentarchos, A. S., Roelofs, G. J., and Lelieveld, J.: Simulation of extratropical synoptic scale
25
stratosphere-troposphere exchange using a coupled chemistry-GCM: Sensitivity to horizon-tal resolution, J. Atmos. Sci, 57, 2824–2838, 2000.
Kentarchos, A. J., Roelofs, G. J., and Lelieveld, J.: Altitude distribution of tropospheric ozone over the northern hemisphere during 1996, simulated with a chemistry-GCM at 2 different horizontal resolutions, J. Geophys. Res., 106, 17 543–17 470, 2001.
30
Lelieveld, J. and van Dorland, R.: Ozone chemistry changes in the troposphere and consequent radiative forcing of climate, in: Atmospheric ozone as a climate gas, (Eds) Wang, W. C. and Isaksen, I. S. A., Springer-Verlag, Berlin, pp. 227–258, 1995.
ACPD
2, 943–981, 2002
On the origin of tropospheric O3 over
the Indian Ocean
A. T. J. de Laat Title Page Abstract Introduction Conclusions References Tables Figures J I J I Back Close Full Screen / Esc
Print Version Interactive Discussion
c
EGS 2002 Leon, J.-F., Chazette, P., Dulac, F., Pelon, J., Flamant, C., Bonazzola, M., Foret, G., Alfaro, S. C.,
Cachier, H., Cautenet, S., Hamonou, E., Gaudichet, A., Gomes, L., Rajot, J.-L., Lavenu, F., Inmdar, S. R., Sarode, P. R., and Kadadevarmath, J. S.: Large-scale advection of continental aerosols during INDOEX, J. Geophys. Res, 106, 28 427–28 439, 2001.
Pickering, K. E., Thompson, A. M., Scala, J. R., Tao, W.-K., Dickerson, R. R., and Simpson,
5
J.: Free tropospheric ozone production following entrainment of urban plumes into deep convection, J. Geophys. Res., 97, 17 895–18 000, 1992.
Price, C. and Rind, D.: A simple lightning parameterization for calculating global lightning dis-tributions, J. Geophys. Res., 97, 9919–9933, 1992.
Randriambelo, T., Baray, J. L., Baldy, S., and Bremaud, P.: A Case study of extreme
tropo-10
spheric ozone contamination in the tropics using in situ, satellite and meteorological data, Geophys. Res. Lett., 26, 1287–1290, 1999.
Rasch, P. J. and Williamson, D.: Computational aspects of moisture transport in global models of the atmosphere. Q. J. R. Meteorol. Soc., 116, 1071–1090, 1990.
Reiner, T., Sprung, D., Jost, D., Gabriel, R., Mayol-Bracero, O. L., Andreae, M. O., Campos, T.
15
L., and Shetter, R. E.: Chemical characterization of pollution layers over the tropical Indian Ocean: Signatures of emissions from biomass and fossil fuel burning, J. Geophys. Res., 106, 28 497–28 510, 2001.
Rhoads, K. P., Kelley, P., Dickerson, R. R., Carsey, T. P., Farmer, M., Savoie, L., and Prospero, J. M.: Composition of the troposphere of the Indian Ocean during the monsoonal transition,
20
J. Geophys. Res., 102, 18 981–18 995, 1997.
Roeckner, E., Arpe, K., Bengtsson, L., Christoph, M., Claussen, M., Dmenil, L., Esch, M., Giorgetta, M., Schlese, U., and Schulzweida, U.: The atmospheric general circulation model ECHAM-4: Model description and simulation of present-day climate, Rep. 218, Max-Planck-Institute for Meteorology, Hamburg, Germany, 1996.
25
Roelofs, G. J. and Lelieveld, J.: Distribution and budget of O3 in the troposphere calculated
with a chemistry – general circulation model, J. Geophys. Res., 100, 20 983–20 998, 1995.
Roelofs, G. J. and Lelieveld, J.: Model study of the influence of cross-tropopause O3transports
on tropospheric O3levels, Tellus, 49B, 38–55, 1997.
Roelofs, G. J., Lelieveld, J., Smit, H. G. J., and Kley, D.: Ozone production and transports
30
in the tropical Atlantic region during the biomass burning season, J. Geophys. Res., 102, 10 637–10 651, 1997a.
circu-ACPD
2, 943–981, 2002
On the origin of tropospheric O3 over
the Indian Ocean
A. T. J. de Laat Title Page Abstract Introduction Conclusions References Tables Figures J I J I Back Close Full Screen / Esc
Print Version Interactive Discussion
c
EGS 2002 lation model simulation of anthropogenically derived ozone in the troposphere and its
radia-tive climate forcing, J. Geophys. Res., 102, 23 389–23 401, 1997b.
Smit, H. G. J., Str ¨ater, W., Kley, D., and Profitt, M. H.: The evaluation of ECC-ozone sondes under quasi flight conditions in the environmental simulation chamber at J ¨ulich, in: Proceed-ings of Eurotrac Symposium 1994, (Eds) Borell, P. M., et al., SPB Acad., The Hague, the
5
Netherlands, pp. 349–353, 1994.
Smit, H. G. J., Gilge, S., and Kley, D.: JOSIE: The 1996 WMO international intercomparison of ozone sondes under quasi flight conditions in the environmental simulation chamber at J ¨ulich, Tech Doc. 296, World Meteorol. Org., Geneva, 1998.
Thompson, A. M., Pickering, K. E., McNamara, D. P., Schoeberl, M. R., Hudson, R. D., Kim, J.
10
H., Browell, E. V., Kirchhoff, V. W. J. H., and Nganga, D.: Where did tropospheric zone over southern Africa and the tropical Atlantic come from in October 1992? Insights from TOMS, GTE TRACE A and SAFARI 1992, J. Geophys. Res., 101, 24 251–24 278, 1996.
Tiedtke, M.: A comprehensive mass flux scheme for cumulus parameterization in large-scale models, Mon. Wea. Rev., 117, 1779–1800, 1989.
15
Yienger, J. J. and Levy, II, H.: Empirical model of global soil-biogenic NOXemissions, J.
Geo-phys. Res., 100, 11 447–11 464, 1995.
Zachariasse, M., van Velthoven, O. F. J., Smit, H. G. J., Lelieveld, J., Mandal, T. K., and Kelder, H.: Influence of stratosphere-troposphere exchange on tropospheric ozone over the tropical Indian Ocean during the winter monsoon, J. Geophys. Res., 105, 15 403–15 416, 2000.
20
Zachariasse, M., Smit, H. G. J., van Velthoven, P. F. J., and Kelder, H.: Cross-troposphere and interhemispheric transports into the tropical free troposphere over the Indian Ocean, J. Geophys. Res., 106, 28 441–28 453, 2001.
ACPD
2, 943–981, 2002
On the origin of tropospheric O3 over
the Indian Ocean
A. T. J. de Laat Title Page Abstract Introduction Conclusions References Tables Figures J I J I Back Close Full Screen / Esc
Print Version Interactive Discussion
c
EGS 2002
Table 1. Location and dates of sonde launch during the 1995 INDOEX-cruise with the American
R/V Malcolm Baldrige. Sondes were launched around noon local time
Sounding Date Latitude Longitude
6 April 2, 1995 19.5◦S 55.0◦E 7 April 4, 1995 18.0◦S 55.0◦E 8 April 5, 1995 16.0◦S 55.0◦E 9 April 6, 1995 13.6◦S 55.0◦E 10 April 7, 1995 11.7◦S 54.1◦E 11 April 9, 1995 9.6◦S 51.9◦E 12 April 10, 1995 8.3◦S 52.3◦E 13 April 11, 1995 6.7◦S 52.9◦E 14 April 12, 1995 3.7◦S 55.0◦E 15 April 13, 1995 1.0◦S 55.0◦E 16 April 14, 1995 1.3◦N 56.7◦E 17 April 15, 1995 2.9◦N 58.2◦E 18 April 16, 1995 4.5◦N 59.7◦E 19 April 17, 1995 6.7◦N 61.7◦E 20 April 18, 1995 8.2◦N 63.0◦E 21 April 20, 1995 7.6◦N 73.1◦E
ACPD
2, 943–981, 2002
On the origin of tropospheric O3 over
the Indian Ocean
A. T. J. de Laat Title Page Abstract Introduction Conclusions References Tables Figures J I J I Back Close Full Screen / Esc
Print Version Interactive Discussion
c
EGS 2002
Table 2. Location and dates of sonde launch during the First Field Phase (FFP, 1998)
INDOEX-cruise with the Indian R/V Sagar Kanya. Sondes were launched in the early afternoon or evening (local time)
Sounding Date Latitude Longitude
1 Feb 23, 1998 8.0◦N 74.0◦E 2 March 2, 1998 0.2◦S 73.5◦E 3 March 4, 1998 4.3◦S 70.2◦E 4 March 6, 1998 8.1◦S 67.3◦E 5 March 8, 1998 11.1◦S 64.5◦E 6 March 10, 1998 16.1◦S 61.0◦E 7 March 13, 1998 20.1◦S 57.3◦E 8 March 18, 1998 12.4◦S 62.5◦E 9 March 19, 1998 11.0◦S 63.3◦E 10 March 20, 1998 7.1◦S 65.2◦E 11 March 22, 1998 3.0◦N 67.3◦E 12 March 24, 1998 2.4◦N 68.5◦E 13 March 27, 1998 11.4◦N 68.8◦E 14 March 28, 1998 14.1◦N 68.3◦E
ACPD
2, 943–981, 2002
On the origin of tropospheric O3 over
the Indian Ocean
A. T. J. de Laat Title Page Abstract Introduction Conclusions References Tables Figures J I J I Back Close Full Screen / Esc
Print Version Interactive Discussion
c
EGS 2002
Fig. 1. Ship tracks of the 1995 (R/V Malcolm Baldrige) and 1998 (R/V Sagar Kanya) INDOEX
cruises. The locations of the ozone sonde launches as summarized in Tables 1 and 2 are also indicated.
ACPD
2, 943–981, 2002
On the origin of tropospheric O3 over
the Indian Ocean
A. T. J. de Laat Title Page Abstract Introduction Conclusions References Tables Figures J I J I Back Close Full Screen / Esc
Print Version Interactive Discussion c EGS 2002 1 0 100 1000 0 5 1 0 1 5 2 0 2 5 O3 (ppbv) A lt it u d e ( k m ) 180 200 220 240 260 280 300 320 0 5 1 0 1 5 2 0 2 5 Sounding 12 Sounding 7 Temperature (K) A lt it u d e ( k m )
Fig. 2. Temperature (K) and O3 (ppbv) from two profiles (No 7 and 12) taken during the 1998 pre-INDOEX campaign on board of the Indian R/V Sagar Kanya. The thin line is profile No 7, the thick line profile No 12. The horizontal axis is a logarithmic scale, similar to Folkins et al. 1999). For location and launch date, see Table 2.
ACPD
2, 943–981, 2002
On the origin of tropospheric O3 over
the Indian Ocean
A. T. J. de Laat Title Page Abstract Introduction Conclusions References Tables Figures J I J I Back Close Full Screen / Esc
Print Version Interactive Discussion c EGS 2002 0 50 100 150 0 5 10 15 20 Sonde 13 O3 (ppbv) A lt it u d e ( k m ) CO (ppbv) 0 50 100 150 0 5 10 15 20 Sonde 12 O3 (ppbv) A lt it u d e ( k m ) CO (ppbv) 0 50 100 150 0 5 10 15 20 Sonde 8 A lt it u d e ( k m ) O3 (ppbv) CO (ppbv) 00 50 100 150 5 10 15 20 Sonde 9 A lt it u d e ( k m ) O3 (ppbv) CO (ppbv) 0 50 100 150 0 5 10 15 20 Sonde 7 A lt it u d e ( k m ) O3 (ppbv) CO (ppbv) 0 50 100 150 0 5 10 15 20 Sonde 6 A lt it u d e ( k m ) O3 (ppbv) CO (ppbv) 0 50 100 150 0 5 10 15 20 Sonde 10 A lt it u d e ( k m ) O3 (ppbv) CO (ppbv) 0 50 100 150 0 5 10 15 20 Sonde 11 A lt it u d e ( k m ) O3 (ppbv) CO (ppbv)
Fig. 3a. Vertical O3profiles from the 1995 INDOEX cruise profiles No 6 to 13 (solid thin lines),
along with the corresponding O3 (dashed thin line, open circles) and CO (dashed thick lines,
ACPD
2, 943–981, 2002
On the origin of tropospheric O3 over
the Indian Ocean
A. T. J. de Laat Title Page Abstract Introduction Conclusions References Tables Figures J I J I Back Close Full Screen / Esc
Print Version Interactive Discussion c EGS 2002 0 50 100 150 0 5 10 15 20 Sonde 21 A lt it u d e ( k m ) O3 (ppbv) CO (ppbv) 0 50 100 150 0 5 10 15 20 Sonde 20 A lt it u d e ( k m ) O3 (ppbv) CO (ppbv) 0 50 100 150 0 5 10 15 20 Sonde 16 A lt it u d e ( k m ) O3 (ppbv) CO (ppbv) 00 50 100 150 5 10 15 20 Sonde 17 A lt it u d e ( k m ) O3 (ppbv) CO (ppbv) 0 50 100 150 0 5 10 15 20 Sonde 15 A lt it u d e ( k m ) O3 (ppbv) CO (ppbv) 0 50 100 150 0 5 10 15 20 Sonde 14 A lt it u d e ( k m ) O3 (ppbv) CO (ppbv) 0 50 100 150 0 5 10 15 20 Sonde 18 A lt it u d e ( k m ) O3 (ppbv) CO (ppbv) 0 50 100 150 0 5 10 15 20 Sonde 19 A lt it u d e ( k m ) O3 (ppbv) CO (ppbv)