HAL Id: hal-00296172
https://hal.archives-ouvertes.fr/hal-00296172
Submitted on 13 Mar 2007
HAL is a multi-disciplinary open access
archive for the deposit and dissemination of
sci-entific research documents, whether they are
pub-lished or not. The documents may come from
teaching and research institutions in France or
abroad, or from public or private research centers.
L’archive ouverte pluridisciplinaire HAL, est
destinée au dépôt et à la diffusion de documents
scientifiques de niveau recherche, publiés ou non,
émanant des établissements d’enseignement et de
recherche français ou étrangers, des laboratoires
publics ou privés.
hydrogen sulphide in volcanic gas plumes as inferred
from field and model investigations
A. Aiuppa, A. Franco, R. von Glasow, A. G. Allen, W. d’Alessandro, T. A.
Mather, D. M. Pyle, M. Valenza
To cite this version:
A. Aiuppa, A. Franco, R. von Glasow, A. G. Allen, W. d’Alessandro, et al.. The tropospheric
processing of acidic gases and hydrogen sulphide in volcanic gas plumes as inferred from field and
model investigations. Atmospheric Chemistry and Physics, European Geosciences Union, 2007, 7 (5),
pp.1441-1450. �hal-00296172�
Atmos. Chem. Phys., 7, 1441–1450, 2007 www.atmos-chem-phys.net/7/1441/2007/ © Author(s) 2007. This work is licensed under a Creative Commons License.
Atmospheric
Chemistry
and Physics
The tropospheric processing of acidic gases and hydrogen sulphide
in volcanic gas plumes as inferred from field and model
investigations
A. Aiuppa1,2, A. Franco1, R. von Glasow3,*, A. G. Allen4, W. D’Alessandro2, T. A. Mather5, D. M. Pyle5, and M. Valenza1,2
1Dipartimento CFTA, Universit`a di Palermo, Palermo, Italy 2INGV – Sezione di Palermo, Palermo, Italy
3Institut f¨ur Umweltphysik, University of Heidelberg, Germany
4School of Geography, Earth and Environmental Sciences, University of Birmingham, UK 5Earth Science Department, University of Oxford, UK
*now at: School of Environmental Sciences, University of East Anglia, Norwich, UK
Received: 21 September 2006 – Published in Atmos. Chem. Phys. Discuss.: 21 November 2006 Revised: 14 February 2007 – Accepted: 1 March 2007 – Published: 13 March 2007
Abstract. Improving the constraints on the atmospheric fate
and depletion rates of acidic compounds persistently emitted by non-erupting (quiescent) volcanoes is important for quan-titatively predicting the environmental impact of volcanic gas plumes. Here, we present new experimental data coupled with modelling studies to investigate the chemical processing of acidic volcanogenic species during tropospheric disper-sion. Diffusive tube samplers were deployed at Mount Etna, a very active open-conduit basaltic volcano in eastern Sicily, and Vulcano Island, a closed-conduit quiescent volcano in the Aeolian Islands (northern Sicily). Sulphur dioxide (SO2), hydrogen sulphide (H2S), hydrogen chloride (HCl) and
hy-drogen fluoride (HF) concentrations in the volcanic plumes (typically several minutes to a few hours old) were repeatedly determined at distances from the summit vents ranging from 0.1 to ∼10 km, and under different environmental conditions. At both volcanoes, acidic gas concentrations were found to decrease exponentially with distance from the summit vents (e.g., SO2 decreases from ∼10 000 µg/m3at 0.1 km from
Etna’s vents down to ∼7 µg/m3at ∼10 km distance), reflect-ing the atmospheric dilution of the plume within the acid gas-free background troposphere. Conversely, SO2/HCl,
SO2/HF, and SO2/H2S ratios in the plume showed no
system-atic changes with plume aging, and fit source compositions within analytical error. Assuming that SO2losses by reaction
are small during short-range atmospheric transport within quiescent (ash-free) volcanic plumes, our observations sug-gest that, for these short transport distances, atmospheric re-actions for H2S and halogens are also negligible. The
one-dimensional model MISTRA was used to simulate
quantita-Correspondence to: A. Aiuppa
tively the evolution of halogen and sulphur compounds in the plume of Mt. Etna. Model predictions support the hypoth-esis of minor HCl chemical processing during plume trans-port, at least in cloud-free conditions. Larger variations in the modelled SO2/HCl ratios were predicted under cloudy
con-ditions, due to heterogeneous chlorine cycling in the aerosol phase. The modelled evolution of the SO2/H2S ratios is
found to be substantially dependent on whether or not the interactions of H2S with halogens are included in the model.
In the former case, H2S is assumed to be oxidized in the
at-mosphere mainly by OH, which results in minor chemical loss for H2S during plume aging and produces a fair match
between modelled and measured SO2/H2S ratios. In the
lat-ter case, fast oxidation of H2S by Cl leads to H2S chemical
lifetimes in the early plume of a few seconds, and thus SO2to
H2S ratios that increase sharply during plume transport. This
disagreement between modelled and observed plume compo-sitions suggests that more in-detail kinetic investigations are required for a proper evaluation of H2S chemical processing
in volcanic plumes.
1 Introduction
Volcanic plumes are peculiar chemical/physical systems formed by the atmospheric dispersion of gases and particles released from both eruptive and quiescent volcanoes. While eruptive stratospheric plumes and their atmospheric impacts have been extensively studied in the past (e.g., Robock, 2000; Robock and Oppenheimer, 2003), the impacts of tro-pospheric emissions from quiescent volcanoes are far less well characterised. However it is becoming clear that these
less dramatic but persistent emissions can have local to re-gional environmental impacts which may be at least as im-portant as those of short-lived volcanic eruptions in the long-term (e.g. Delmelle, 2003; Mather et al., 2003a).
A matter of particular interest is to assess the paths and rates of chemical reactions in tropospheric volcanic plumes; these may be significantly different to those in the back-ground atmosphere, reflecting higher temperatures, humid-ity, aerosol content and possibly radical production (Gerlach, 2004). Besides CO2, which is likely to be relatively
in-ert during atmospheric dilution, volcanic degassing releases large amounts of acidic gaseous volatile species such SO2,
H2S and hydrogen halides (HCl, HF, HBr) (Symonds et al.,
1994). As they are emitted from the vent, cooled and mixed in with atmospheric gases, these reactive species are avail-able to take part in both homogeneous (gas-only) and het-erogeneous (gas-liquid-solid) reactions. Although these re-actions have been studied in detail in the laboratory, uncer-tainties remain when applying such results to the conditions in volcanic plumes. Recently, evidence for rapid reaction following emission, or during transport, has been found for HBr, which is at least partially converted to BrO following emission (Bobrowski et al., 2007; Oppenheimer et al., 2006). The recent detection of ClO and OClO in volcanic plumes (Lee et al., 2005; Bobrowski et al., 2007) suggests that simi-lar reaction mechanisms (Martin et al., 2006) may also apply to emitted HCl.
A proper evaluation of the reaction schemes involved is of fundamental importance for assessing the residence time and thus deposition rates of these acid compounds, and for quantitatively predicting the environmental impact of vol-canic gas plumes. In addition, since the determination of volcanic gas composition is increasingly accomplished by remote-sensing spectroscopic methods, knowledge of atmo-spheric processes within volcanic plumes is required to ver-ify the extent to which the composition of distal plumes, sam-pled many km downwind from a volcanic vent, is represen-tative of the source composition.
The ultimate fate of much of the sulphur dioxide in volcanic plumes is thought to be conversion into sulphate aerosols (its other sinks are dry and wet deposition), which can occur via gas phase reactions (mostly via reaction with OH radical) or more probably on the surface of solid/liquid particles in the plume (Penkett et al., 1979; Ravinshankara, 1997). Although the rates of such reactions can vary sig-nificantly depending on temperature, humidity, insulation, and aerosol loading (Martin et al., 1986; Oppenheimer et al., 1998), first order sulphur dioxide loss rates have re-cently been estimated at only ∼4% per hour in ash-free non-condensing volcanic plumes (McGonigle et al., 2004). Hy-drogen chloride and hyHy-drogen fluoride are more soluble in water than sulphur dioxide, and hence wet deposition may cause major depletion of these species from the plume (espe-cially during the night or in wet periods). Still, Horrocks et al. (2003) failed to detect any change in the plume SO2/HCl
ratio at Masaya volcano (Nicaragua), taking FTIR measure-ments simultaneously at the vents and downwind of the vol-cano (up to 40 km from source, with plume ages of up to
∼1.5 h), suggesting that there is no differential influence of tropospheric processes on plume SO2 and HCl, at least
un-der the conditions prevalent at a low altitude (600 m a.s.l.), tropical volcano (11.98◦N) such as Masaya. However, their measurements were limited to the drier season (December to April) in Nicaragua and during day time, when relative hu-midity would have been at a minimum.
Here, we test further Horrocks et al.’s (2003) suggestion that the SO2/HCl ratio in volcanic plumes is not altered by
tropospheric processing over distances of tens of kms by pre-senting results from a series of experiments carried out on Mount Etna volcano (Sicily, Southern Italy) in the 2002– 2005 period. Sulphur dioxide, HCl and HF time-averaged concentrations in the plume were determined repeatedly by the use of a network of diffusive tubes (Aiuppa et al., 2004) at distances from the summit vents ranging from 0.1 to ∼10km. Measurements were made during different seasons, ranging from cold and rainy periods (October–November 2003) to hot and dry periods (e.g., August 2004). By so doing, we at-tempt to evaluate the extent to which SO2/HCl and SO2/HF
ratios are altered during atmospheric transport in a tropo-spheric volcanic plume under a wide range of environmental conditions. We also present the first distal “diffusive” deter-minations of H2S concentrations in plumes from Mount Etna
and Vulcano Island, allowing us to assess its residence time compared to SO2. Finally, the comparison of plume data with
the model results from the MISTRA one-dimensional atmo-spheric reaction code (von Glasow et al., 2002) is used to better evaluate the chemical processing of halogen and sul-phur compounds in Mt. Etna’s plume.
1.1 Introduction to field sites
Mount Etna (Fig. 1) is the largest (summit 3.3 km a.s.l.; base 60×40 km) and most-active strato-volcano in Eu-rope (Bonaccorso et al., 2004). It is an excellent test-site for plume-chemistry investigations, because of the un-interrupted open-conduit passive degassing from four sum-mit craters and the massive release of SO2 (∼5500 T d−1;
Caltabiano et al., 2004), halogens (Francis et al., 1998; Aiuppa et al., 2005a) and H2S (Aiuppa et al., 2005b).
Al-though Etna’s plume is generally dispersed by winds at the same altitude as the emission point, it is sometimes forced by the prevailing westerly winds (Fig. 1) to flow at ground level down the volcano’s slope, leading to fumigation of its upper eastern flank (Aiuppa et al., 2004; Allen et al., 2006).
Vulcano is a closed-conduit quiescent volcano in the Aeo-lian Islands (Fig. 2). The volcanic plume is fed by degassing from many fumaroles (Tmax∼450◦C), with mean SO2 and
H2S emissions of ∼15 and ∼6 T d−1, respectively (Aiuppa
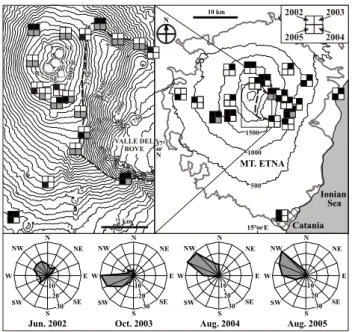
A. Aiuppa et al.: The tropospheric processing of acidic gases 1443 3000 SE NE BN VOR VALLE DEL BOVE 75 2 0 0 250 2250 00 20 1750 2 km Catania MT. ETNA Aug. 2005 Aug. 2004 Oct. 2003 Jun. 2002 Ionian Sea 10 km 15°00'E 37° 40' N N 500 1000 1500 2002 2004 2005 2003 N NE E SE S SW W NW N NE E SE S SW W NW N NE E SE S SW W NW N NE E SE S SW W NW 30 20 10 30 20 10 30 20 10 30 20 10
Fig. 1. Location of the sites where diffusive tubes were exposed
on Etna during the different measurement campaigns. The bold grey line limits the outcrop area of Etnean volcanic products, while the dashed line shows the rim of the Valle del Bove. The sum-mit craters are indicated with different initials: NE – North-East Crater; SE – South-East Crater; BN – Bocca Nuova; VOR – Vor-agine. Diffusive tubes were exposed for about one month in four campaigns on May–June 2002, October–November 2003, July– August 2004 and July–August 2005. For each sampling site, the symbol is subdivided into four sectors, each referring to a differ-ent survey. A white sector indicates no sampling; a black sec-tor indicates sampling of SO2 and halogens; a grey sector sam-pling of SO2, halogens and H2S. The wind rose diagrams
show-ing the frequency of wind provenance (directions from which the wind originated are marked) at 700 hPa during the four surveys are also shown – as based on Trapani Birgi atmospheric sounding data (http://www.weather.uwyo.edu/upperair/sounding.html).
2 Methods
2.1 Measurement techniques
Diffusive tubes have recently been shown to provide valuable information on the plume dispersion of volcanic acidic gases (Delmelle et al., 2001, 2002; Allen et al., 2002; Aiuppa et al., 2004). Diffusive tubes are passive air sampling devices that rely on the molecular diffusion of the species of interest through an entrapped air volume. A chemically-specific sor-bent (an impregnated filter designed to selectively react with and capture a certain gaseous species) is placed in the closed end of an open tube, and an inert filter positioned at the inlet end to prevent turbulent transport of gases within the device, or ingress of particles. Uptake of the species of interest by the sorbent creates a concentration gradient inside the tube and the net flux of the sorbed gas is proportional to the
am-Fig. 2. Location of the sites of exposure of diffusive tubes on
Vul-cano Island during June–July 2005.
bient concentration. The average ambient concentration can hence be calculated from the amount of the gaseous species that is captured and the exposure time using Fick’s first law of diffusion (Ferm, 2001).
The diffusive tubes used in this study for the determination of SO2, HCl and HF were polypropylene tubes using a paper
filter impregnated with NaHCO3in glycerol as sorbent (see
Aiuppa et al., 2004 for more details). After exposure, the filter was leached in water and analyzed by ion chromatogra-phy to determine the amounts of F−, Cl−and SO2−4 accumu-lated. The average HF, HCl, and SO2concentrations in the
air (precisions, ±20%, ±10% and ±5%, respectively) during the sampling periods were then calculated (see Ayers et al., 1998 for further details). The diffusive tubes used for H2S
determination (Radiello® from Fondazione Maugeri) were of the radial sampling geometry and used a porous polyethy-lene cartridge impregnated with zinc-acetate as a sorbent (for details, see http://www.radiello.it/english/h2s en.htm). The sorbed sulphide was later recovered by extraction with water, mixed with N,N-dimethyl-p-phenylenediammonium ion to yield methylene blue (measured by visible spectro-photometry).
Four field campaigns were carried out on Etna, in May– June 2002, October–November 2003, July–August 2004 and July–August 2005. In each campaign, about 20 diffusive tubes were simultaneously exposed for about 1 month around the volcano (Fig. 1). One sampling campaign was carried out during June–July 2005 at Vulcano Island (Fig. 2). Hydrogen
1 10 100 1000 10000 100000 0 1 2 3 4 5 6 7 8 9 10 Distance (km) 3 S O ( m g/ m ) 2
Fig. 3. SO2concentrations in air (in µg/m3)versus the
correspond-ing distance from Etna’s summit craters. Data for the four Etna campaigns are integrated. White circles, sites upwind of Etna’s summit vents; grey circles, sites downwind of Etna’s summit vents. Each site was assigned as upwind or downwind based on the rose diagrams of Fig. 1.
sulphide concentrations were measured at a sub-set of sam-pling sites during the 2004 and 2005 campaigns only (Fig. 1).
2.2 Model description
We used the one-dimensional model MISTRA to study the evolution of halogen and sulphur compounds in the plume of Mt. Etna. The model version that we used has been described in more detail in Bobrowski et al. (2007) and is an exten-sion of the model presented in von Glasow et al. (2002). In brief, the model includes gas phase, aerosol and cloud droplet chemistry with a focus on halogen and sulphur chemistry. Photolysis frequencies are calculated online. Vertical mixing is treated in detail in the model, whereas horizontal mixing and entrainment of ambient air into the volcanic plume is parameterized. In this paper we discuss model runs that are based on the setup that showed best agreement with measure-ments at Mt. Etna of BrO and SO2and BrO/SO2(run “60–
40”, see Bobrowski et al., 2007). The initial composition of volcanic volatiles has been calculated with a thermodynamic equilibrium model under the assumption of a mixture of 60% volcanic volatiles and 40% ambient air at about T=600◦C. Model start is at local noon and the duration of the runs is 6 h. For more details on the model and the basic setup of the runs for the modelling of volcanic plumes the reader is referred to Bobrowski et al. (2007).
In Sect. 3.2 we will discuss results from a model run where the ambient humidity has been set to 60% so that no cloud forms in the model after release of the volcanic volatiles (“cloud-free”) and a second run where the ambient humid-ity was set to 95% resulting in cloud formation after plume release (“cloudy”). This cloud has a vertical extent of 10–
50 m and is present for 70 min after plume release, which corresponds to 42 km at a wind speed of 10 m/s (see Fig. 6).
We have also conducted model runs where we included the oxidation of H2S.
3 Results and discussion
3.1 Plume measurements
Figure 3 is a plot of SO2concentrations in air at the locations
shown in Fig. 1 against the relative distances from Etna’s summit craters. This clearly demonstrates the volcanic origin of SO2, since the concentrations decrease exponentially with
distance from Etna’s summit vents, from ∼10 000 µg/m3at 0.1 km to ∼7 µg/m3at ∼10 km distance. Assuming that SO2
is virtually inert during short-term plume dispersal (McGo-nigle et al., 2004), this trend reflects an increasing atmo-spheric dilution of the plume within the SO2-free background
troposphere, and further supports the idea of recurrent plume fumigation in an area ∼10 km in diameter centred east of the volcano’s summit (Fig. 1), as first proposed by Aiuppa et al. (2004). The ∼100-fold concentration contrast between “upwind” and “downwind” sites on Etna’s flanks, confirms that plume fumigation occurs less often around Etna’s west-ern flank.
Hydrogen chloride and HF concentrations display simi-lar decreasing (e.g., dilution) trends over the same distance interval, ranging from ∼800 and ∼900 µg/m3, respectively, at 0.1 km from the vents, to below detection limit (0.6 and 0.35 µg/m3, respectively) at 10 km distance.
Molar SO2/HCl and SO2/HF ratios in air at the diffusive
tube locations of Fig. 1 are shown in Fig. 4. Large varia-tions of the ratios are observed between one campaign and another, reflecting important compositional changes at the source over time: the higher ratios in the 2002 campaign are consistent with the larger SO2/HCl and SO2/HF ratios
in the near-vent summit craters’ plume at that time (4.7 and 85, respectively; Table 1). SO2/HCl and SO2/HF in the
source plume were lower (and more homogeneous) during the 2003, 2004 and 2005 campaigns (Table 1). Equally, data from each campaign consistently show that there are no systematic changes (within the measurement errors) in the SO2/HCl ratios with distance (i.e. with plume aging) from
the vents (Fig. 4). The mean SO2/HCl ratios (Table 1) fit
source compositions within analytical uncertainty for each of the four campaigns, and suggest that, for these short trans-port distances, atmospheric reactions during plume transtrans-port for both species are either negligible or of the same rate. The scatter of SO2/HF ratios for each campaign is larger than
for SO2/HCl ratios, as is the discrepancy from the source’s
composition (Table 1). However, there is still no apparent systematic distance-ratio dependence, and the scatter in the dataset seems to be more likely related to analytical uncer-tainties in fluoride determination, with concentrations often
A. Aiuppa et al.: The tropospheric processing of acidic gases 1445
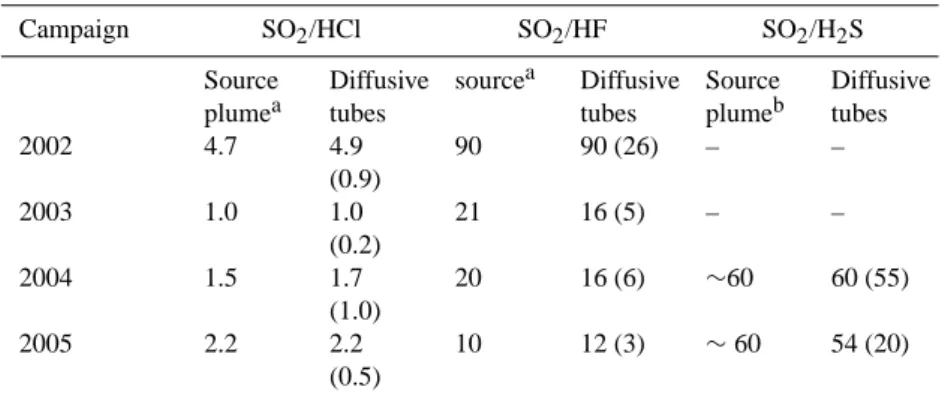
Table 1. Mean SO2/HCl, SO2/HF and SO2/H2S molar ratios from diffusive tubes for the four Etna campaigns. Standard deviations are
given in parentheses. For comparison, the characteristic molar ratios in the near-vent source plume are given for each campaign (as averages of the periodic measurements performed on Etna’s vents during each exposure period).
Campaign SO2/HCl SO2/HF SO2/H2S Source plumea Diffusive tubes sourcea Diffusive tubes Source plumeb Diffusive tubes 2002 4.7 4.9 (0.9) 90 90 (26) – – 2003 1.0 1.0 (0.2) 21 16 (5) – – 2004 1.5 1.7 (1.0) 20 16 (6) ∼60 60 (55) 2005 2.2 2.2 (0.5) 10 12 (3) ∼60 54 (20)
aMeasurements of acidic gases in the crater’s plume by filter packs (Aiuppa et al., 2005a) and this study.
bMeasured by specific electrochemical sensors according to the method described in Aiuppa et al. (2005c), and assuming equal (1:1) sulphur
contributions from North-east crater (SO2/H2S ∼20) and Voragine crater (SO2/H2S ∼100).
being very close to the detection limit. These observations are consistent with the usefulness of diffusive samplers for volcanic monitoring (Aiuppa et al., 2004).
Hydrogen sulphide concentrations, measured in a sub-set of Etna’s locations during the 2004 and 2005 cam-paigns, are plotted against corresponding SO2
concentra-tions in Fig. 5. They range between 0.3–281 µg/m3 and are positively correlated with SO2concentrations. SO2/H2S
ratios are highly scattered (Table 1), reflecting a combina-tion of poor analytical accuracy of H2S determinations (8.7%
at 2σ ; http://www.radiello.it/english/h2s en.htm), multiple H2S sources (fumarolic vs main vents, or natural vs
anthro-pogenic), or complex atmospheric chemistry. Nevertheless, mean SO2/H2S ratios from diffusive tubes for both
cam-paigns (54 and 60, respectively) are in reasonable agreement with the source plume composition (∼60; Table 1). Data from the Vulcano Island campaign (Fig. 5), showing consis-tent SO2/H2S ratios in source (2.2±1.1; Aiuppa et al. 2005c)
and distal (2.2±1.2, this study) plumes, also point to only minor alterations of sulphur speciation during medium-term plume transport (for plume ages of ∼30 min, assuming a plume travelling speed of ∼10 km/h). These results extend the earlier conclusions by Aiuppa et al. (2005b), who demon-strated that hydrogen sulfide is essentially inert in volcanic plumes on timescales of seconds to minutes.
3.2 Model results
3.2.1 Halogen and SO2chemistry
The basic features of the plume differ in the cloud-free and cloudy model runs, as can best be seen in the evolution of SO2. The evolution of liquid water content of the cloud
developing at the crater in model run “cloudy” is shown
0 1 2 3 4 5 6 7 8 0 1 2 3 4 5 6 7 8 9 10 2002 2003 2004 2005 Distance, km 2002 2003 2005 2004 1 10 100 1000 0 1 2 3 4 5 6 7 8 9 10 2002 2005 2003, 2004 SO /HF2 SO /HCl2
Fig. 4. SO2/HCl and SO2/HF molar ratios in air at the diffusive tube locations of Fig. 1, shown against the corresponding distance from Etna’s summit vents. The horizontal solid lines indicate – for each campaign - the mean SO2/HCl and SO2/HF molar ratios in the
near-vent source plume (Table 1). The diagram demonstrates contrasting compositions between the 2002 campaign (where higher SO2/HCl
and SO2/HF were measured) and 2003–2005 campaigns. It also
points to minor variations (within analytical uncertainty) of ratios with distance (e.g., with increasing plume travel times) in each cam-paign.
1 10 100 1000 10000 100000 0.1 1 10 100 1000 SO2 H2S Vulcano Island (2.2) Etna (60) Near-vent source plume 3 (mg/m ) 3 (mg/m )
Fig. 5. Scatter diagram of SO2 versus H2S concentrations (in
µg/m3), measured at a sub-set of Etna’s locations (Fig. 1) in 2004 and 2005 campaigns (symbols as in Fig. 4). Data for the 2005 Vul-cano Island campaign are also shown (triangles). For both Etna and Vulcano Island, the characteristic SO2/H2S ratios of the near-vent source plumes (numbers in parentheses; see Table 1) are indicated by the solid diagonal lines.
time in minutes 0 20 40 60 80 100 3700 3500 3300 3100 a lti tu de [ m ] LWC [g/m3] 1.6 1.4 1.2 1.0 0.9 0.8 0.7 0.6 0.5 0.4 0.3 0.2 0.1 0.0
Fig. 6. Contour plot of the liquid water content of the cloud
devel-oping at the crater in model run “cloudy”. Time is in minutes since model start (plume release is 11 min after model start) and altitude in metres.
in Fig. 6. In the cloud-free run (Fig. 7, top panel), the plume rises due to the initially high temperature of the plume (∼600◦C) and radiative heating due to absorption by the vol-canic aerosols. In the cloudy run (Fig. 8, top panel), the plume descends due to long-wave cooling of the cloud-top and by additional cooling caused by the evaporation of cloud droplets. For numerical reasons we were not able to pre-scribe the temperature of the fresh plume in the cloudy run to ∼600 ˚ C as in the cloud-free run, but only to ambient tem-peratures, therefore the plume descent is somewhat stronger than it would be if thermal buoyancy effects had been in-cluded.
Due to plume dispersal, the concentration of SO2 in the
core of the plume is higher than at the edges. The smaller concentrations at the plume base in the model are in the range measured with the diffusive tubes, which is consistent with the fact that the plume edges will be more likely to be in
con-125 100 75 50 30 25 20 15 10 5 2.5 2 1.5 0.1 log10(SO2) [log (mol mol-1)]
3700 3500 3300 3100 a lti tu de [m ] time in minutes 0 40 80 120 160 200 240 280 3700 3500 3300 3100 a lti tu de [m ] -1 -2 -3 -4 -5 -6 -7 -8 -9 -10 -11 [SO2]/[HCl]
Fig. 7. Contour plot of the evolution of the SO2and the ratio SO2 to HCl for the “cloud-free” model run. Time is in minutes since model start (plume release is 11 min after model start) and altitude in metres. Note the strongly non-linear contours for [SO2]:[HCl].
3700 3500 3300 3100 a lti tu de [m ] time in minutes 0 40 80 120 160 200 240 280 3700 3500 3300 3100 a lti tu de [m ] -2 -3 -4 -5 -6 -7 -8 -9 -10 -11 1500 1000 800 600 400 200 100 75 50 25 10 5 4 3 2 1 0.1 0.001 [SO2]/[HCl]
log10(SO2) [log (mol mol -1)]
Fig. 8. Same as Fig. 8 but for the “cloudy” model run.
tact with the ground (where the diffusion tubes are located) than the core of the plume. At the altitude of Mt Etna’s sum-mit a concentration of 1 µg(SO2)/m3roughly corresponds to
a mixing ratio of 5×10⁻¹⁰mol/mol.
In order to compare the model results with the diffusive tube measurements presented in this paper, we show the evo-lution of the SO2/HCl ratio as a function of time and altitude
for both the cloud-free and the cloudy run (see bottom panels of Figs. 7 and 8). The SO2/HCl ratio in the cloud-free runs
is constant for approximately the first 130 min after plume release and it averages at about 2, very close to the measured ratios. This matching between modelled and measured ra-tios further supports only minor hydrogen chloride partition-ing into the liquid/solid aerosol phase, at least in cloud-free
A. Aiuppa et al.: The tropospheric processing of acidic gases 1447
conditions and in the short-term (minutes). Although fluo-rine chemistry was not included in the modelling, we propose that similar considerations also apply to even less-reactive HF. Starting ∼130 min after plume release, the SO2/HCl
ra-tio rapidly increases in the model (note the strongly non-linear increments of the contour lines in Fig. 7), which is due to heterogeneous cycling of HCl on aerosols: after this time, plume dilution has decreased the gas phase concentra-tions enough to make uptake onto the aerosol phase an im-portant sink for HCl. It should be noted, however, that model ClO vertical columns underestimate the measured columns by about a factor of 40 in the early plume (see Bobrowski et al., 2006), so that some uncertainty remains as to whether chlorine chemistry is properly reproduced in the model. In the case of HCl, however, it is likely that the model captures its chemistry with some accuracy, as it is fairly un-reactive in the gas phase and its aqueous fraction is small due to the high acidity of the aerosol particles until the gas phase con-centration is reduced by dilution. This is also supported by field measurements of night- (cloudy plume with RH ≥88%) and daytime (transparent) plume SO2/HCl ratios in the
undi-luted plume at the crater rim of Masaya volcano, Nicaragua (Mather et al., 2003b).
The evolution of the SO2 to HCl ratio in the cloudy run
(see Fig. 8) is different from that in the cloud-free run. The ratio is fairly high in the cloud layers due to uptake of HCl in the cloud droplets, which contain a lot more water than aerosol particles. The lower, cloud-free part of the plume in these runs would seem more likely to ground though, and in this region the modelled ratio is consistent with the measure-ments. Even if the diffusion tubes are within a “grounded cloud”, during part of the sampling time one can expect a mixture of the modelled “cloud-free” and “cloudy” condi-tions during sampling with the diffusion tubes which would still be consistent with the field data. These modelling re-sults are in agreement with the relatively minor chlorine bulk deposition fluxes measured over the volcano perime-ter, accounting for ≤1% of total emissions from the volcano (Aiuppa et al. 2006), which argue against a substantial HCl removal from the plume.
3.2.2 H2S chemistry
We already demonstrated elsewhere (Aiuppa et al., 2005b) that the measured SO2/H2S ratios in the short-lived Etna’s
plume (plume ages of seconds to a few minutes) re-flect thermodynamic equilibrium at magmatic conditions (T∼11006◦C; P∼1–10 bars) and redox conditions buffered
by the coexisting silicate melt at about the Nickel-Nickel oxide (NNO) buffer (fO2∼10−9 bar at 1150◦C; Metrich
and Clocchiatti, 1996). Conversely, our gas-only thermody-namic equilibrium calculations with the software HSC (Out-okumpu Tech., Finland) show that under “60–40, T=600 K” conditions, the concentration of H2S in the early plume
should be negligible, due to much higher oxygen fugacity
[SO2]/[H2S] 3700 3500 3300 3100 a lti tu de [m ] time in minutes 0 40 80 120 160 200 240 280 3700 3500 3300 3100 a lti tu de [m ] 106 105 104 103 102 90 80 70 60 50 106 105 104 9000 8000 7000 6000 5000 4000 3000 2000 1000 900 800 700 600 500 400 300 200 100 [SO2]/[H2S]
Fig. 9. Contour plot of the SO2to H2S ratio for a cloud-free model
run without (top) and with halogen – H2S interactions (bottom),
respectively. Time is in minutes since model start (plume release is 11 min after model start) and altitude in metres.
(fO2∼0.08 bar) in the air-volcanic gas mixture. This is in
stark contrast to our measurements, and implies that the emit-ted H2S is not fast-oxidized upon cooling and dilution in the
high-temperature volcanic gas-air mixing region. Thus the assumption of thermodynamic equilibrium in the volcanic volatiles-ambient air mixture does not hold for H2S. We
therefore assume that the H2S concentration equals SO2/60
in the fresh plume, and this was used as input data for further modelling with MISTRA code.
Typically, H2S is assumed to be oxidized in the
atmo-sphere mainly by OH. Including only this reaction as chem-ical loss for H2S our model results very closely reproduced
the measured ratio of SO2/H2S (see Fig. 9, top panel). As
model ozone concentrations are strongly reduced in the early plume, the resulting OH concentrations are very small (see also discussion in Bobrowski et al., 2007), therefore one would expect H2S to have a long chemical lifetime in early
volcanic plumes. The halogen radicals Cl and Br, however, react very rapidly with H2S as well, leading to the
produc-tion of the hydrogen sulphide radical, SH, as in the case of H2S+OH. The rate coefficient for the reaction H2S+Cl is
fairly well known (Sander et al., 2006) but only one measure-ment has been reported for H2S+Br (Nicovich et al., 1992).
In line with recent measurements of halogen oxides (ClO, OClO, BrO) in volcanic plumes (Bobrowski et al., 2003, 2007; Lee et al, 2005), we also included the interactions of H2S and its break-down products with halogens in the model.
SH, the first break-down product of H2S, can be reduced
back to H2S by self reaction and by reaction with HBr
(Nicovich et al., 1992) and according to the model in the first few minutes after plume release the reduction by HBr is indeed more important than oxidation of H2S by Br. The
oxidation of H2S by Cl, however, is very fast leading to H2S
chemical lifetimes in the early plume of a few seconds and a drastically changing SO2to H2S ratios (see Fig. 9, bottom
panel). This is an obvious contradiction to our measurements (Fig. 5). According to thermodynamic equilibrium calcula-tions of the composition of the initial plume, there are signif-icant amounts of atomic halogens in the mixture of volcanic volatiles and ambient air (see also Gerlach, 2004 and Martin et al., 2006), so that the fast oxidation of H2S by Cl should
also proceed at night.
Possible explanations for the mismatch between modelled and field-measured SO2/H2S ratios could be that our model
strongly overestimates the Cl concentrations in the plume. This might be due to the presence of volatile organic com-pounds (VOC) in the plume in substantially greater con-centrations than the background free tropospheric trations that are included in our model. The VOC concen-trations would have to be extremely high in order to reduce Cl atom concentrations, though, as Cl atom concentrations in the model are of the order of 109molec/cm3in the first 10 min after plume release. While VOC have been shown to be actively degassed by soils and fumaroles at active vol-canoes (e.g., Schwandner et al., 2004; Frische et al., 2006), no above-background VOC levels have been reported in vol-canic plumes, to date. However, again it should be noted that a comparison of model results with observed column densi-ties of ClO, a species closely linked to Cl, showed an under-estimate of the ClO columns in the model. Even though we cannot exclude the possibility that we have neglected impor-tant chlorine reactions in the model that might lead to smaller chlorine atom concentrations, this is unlikely to yield a suffi-ciently different Cl/ClO ratio to be consistent with the mea-surements of high ClO columns (assuming that the spatial gradients are not extraordinarily high). Another possible ex-planation would be rapid reduction of SH by HCl back to H2S, as is the case for bromine. For chlorine, however, this
reaction is endothermic. Another complication with regard to H2S – halogen links is the fact that the hydrogen sulphide
radical is known to react rapidly with dihalogens (Cl2, BrCl,
Br2)producing XSH (Sander et al., 2006). The fate of XSH,
however, remains unknown and one can only speculate about reaction pathways and rate constants that would lead to a pos-sible reformation of H2S.
There is currently a significant lack of information regard-ing the possible reactions that may be involved in halogen – H2S links in volcanic plumes so we unfortunately cannot use
the model to explore our observations in more detail. Further study of the possible reactions that might be involved and their kinetics is to be encouraged.
4 Conclusions
Our combined experimental and modelling investigations support volcanogenic HCl and HF being essentially inert (their chemical processing being negligible compared to their reservoir within the plume) during short-term plume trans-port, as already hypothesised for SO2 (McGonigle et al.,
2004). We suggest that HCl heterogeneous cycling into the aerosol phase, which is expected to be the main atmospheric sink for chlorine under plume conditions, is relatively minor under low relative humidity conditions, when chlorine parti-tioning into the liquid phase is limited by the high acidity of the aerosol particles (at least until the gas phase concentra-tion is reduced by diluconcentra-tion). Chlorine heterogeneous cycling may be more effective under cloudy conditions, due to HCl uptake in cloud droplets. However, even under these con-ditions, the virtually-constant SO2/HCl plume ratios
mea-sured during rainy periods (e.g., October 2003), and the rela-tively minor chlorine bulk deposition fluxes measured over the volcano perimeter, accounting for ≤1% of total emis-sions from the volcano (Aiuppa et al., 2006), argue against a substantial HCl removal from the plume. Our measurements also show that SO2/H2S ratios are constant (within
analyt-ical uncertainty) for plume travel distances of up to several kilometres from the summit vents, suggesting that H2S is
also conserved during short-range transport (i.e. for plume travel times of tens of minutes). This suggestion is supported by model calculations only when H2S-halogens interactions
are neglected. At this stage we can only pose open ques-tions with regard to H2S in the plume but are unable to
an-swer them without further information about the possible re-actions involved: (1) Which rere-actions are able to preserve H2S during cooling and dilution within the high-temperature
(>600◦C) volcanic gas-air mixing region? (2) What is the fate of XSH? (3) What other possibly halogen related reac-tions could be able (like HBr) to reduce SH to H2S?
Acknowledgements. TAM acknowledges the Royal Society and
the Natural Environment Research Council, UK and the Lever-hulme Trust for funding. RvG’s work is funded by the Deutsche Forschungsgemeinschaft (DFG): Emmy-Noether Junior Research Group MarHal, GL 353-1/1,2. S. Bellomo, L. Brusca, M. Longo, F. Parello, and R. Di Paola are acknowledged for help in the field work.
Edited by: M. Ammann
References
Aiuppa, A., Bellomo, S., D’Alessandro, W., Federico, C., Ferm, M., and Valenza, M.: Volcanic plume monitoring at Mount Etna by diffusive (passive) sampling, J. Geophys. Res., 109, D21308, doi:10.1029/2003JD004481, 2004.
Aiuppa, A., Federico, C., Franco, A., Giudice, G., Gurri-eri, S., Inguaggiato, S., Liuzzo, M., McGonigle, A. J. S.,
A. Aiuppa et al.: The tropospheric processing of acidic gases 1449
and Valenza M.: Emission of bromine and iodine from Mount Etna volcano, Geochem. Geophys. Geosyst., 6, Q08008, doi:10.1029/2005GC000965, 2005a.
Aiuppa, A., Inguaggiato, S., McGonigle, A. J. S., O’Dwyer, M., Oppenheimer, C., Padgett, M. J., Rouwet, D., and Valenza M.: H2S fluxes from Mt. Etna, Stromboli and
Vul-cano (Italy) and implications for the global volcanic sulfur budget, Geochim. Cosmochim. Acta, 69-7, 1861–1871, 2005, doi:10.1016/j.gca.2004.09.018, 2005b.
Aiuppa, A.., Federico, C., Giudice, G., and Gurrieri, S.: Chemical mapping of a fumarolic field: La Fossa Crater, Vulcano Island (Aeolian Islands, Italy), Geophys. Res. Lett., 32(13), L13309, 10.1029/2005GL023207, 12 July 2005, 2005c.
Aiuppa, A., Bellomo, S., Brusca, L., D’Alessandro, W., Di Paola, R., and Longo, M.: Major-ion bulk deposition around an ac-tive volcano (Mt. Etna, Italy), Bull Volcanol, 68(3), 255–265, doi:10.1007/s00445-005-0005-x, 2006.
Allen, A. G., Oppenheimer, C., Ferm, M., Baxter, P. J., Hor-rocks, L. A., Galle, B., McGonigle, A. J. S., and Duffell, H. J.: Primary sulfate aerosol and associated emissions from Masaya Volcano, Nicaragua, J. Geophys. Res., 107(D23), 4682, doi:10.1029/2002JD002120, 2002.
Allen, A. G., Mather, T. A., McGonigle, A. J. S., Aiuppa, A., Delmelle, P., Davison, B., Bobrowski, N., Oppenheimer, C., Pyle, D. M., and Inguaggiato, S.: Sources, size distribution and downwind grounding of aerosols from Mt. Etna, J. Geophys. Res., 111, D10302, doi:10.1029/2005JD006015, 2006.
Ayers, G. P., Keywood, M. D., Gillet, R. W., Manins, P. C., Malfroy, H., and Bardsley, T.: Validation of passive diffusion samplers for SO2and NO2, Atmos. Environ., 32, 3593–3600, 1998.
Bobrowski, N., H¨onninger, G., Galle, B., and Platt, U.: Detection of bromine monoxide in a volcanic plume, Nature, 423 , 273–276, 2003.
Bobrowski, N., von Glasow, R., Aiuppa, A., Inguaggiato, S., Louban, I., Ibrahim, O. W., and Platt, U.: Halogen Chemistry in Volcanic Plumes, J. Geophys. Res., in press, 2007.
Bonaccorso, A., Calvari, S., Coltelli, M., Del Negro, C., and Fal-saperla, S. (Eds): Mt. Etna: Volcano Laboratory AGU Geophys-ical Monograph Series, 143, 2004.
Caltabiano, T., Burton, M., Giammanco, S., Allard, P., Bruno, N., Mur`e, F., and Romano, R.: Volcanic Gas Emissions From the Summit Craters and Flanks of Mt. Etna, 1987–2000, in: Mt. Etna: Volcano Laboratory AGU Geophysical Monograph Series, edited by: Bonaccorso, A., Calvari, S., Coltelli, M., Del Negro, C., and Falsaperla, S., 143, 111–128, 2004.
Delmelle, P.: Environmental impacts of tropospheric volcanic gas plumes, in Volcanic degassing, edited by: Oppenheimer, C., Pyle, D. and Barclay, J., Geological Society Special Publications, 213, 381–399, 2003.
Delmelle, P., Stix, J., Bourque, C. P. A., Baxter, P. J., Garcia Al-varez, J., and Barquero, J.: Dry deposition and heavy acid load-ing in the vicinity of Masaya Volcano, a major sulfur and chlo-rine source in Nicaragua, Environ, Sci. Tecnol., 35, 1289–1293, 2001.
Delmelle, P., Stix, J., Baxter, P. J., Garcia-Alvarez, J., and Barquero, J.: Atmospheric dispersion, environmental effects and poten-tial health hazard associated with the low-altitude gas plume of Masaya volcano, Nicaragua, Bull. Volcanol., 64, 423–434, 2002. Ferm, M.: The theories behind diffusive sampling, Paper presented
at International Conference Measuring Air Pollutants by Diffu-sive Sampling, Montpellier, France 26–28 September 2001, 31– 40, 2001.
Francis, P., Burton, M. R., and Oppenheimer, C.: Remote measure-ments of volcanic gas compositions by solar occultation spec-troscopy, Nature, 396, 567–570, 1998.
Frische, M., Garofalo, K., Hansteen, T. H., and Borchers, R.: Fluxes and origin of halogenated organic trace gases from Momotombo volcano (Nicaragua), Geochem. Geophys. Geosys., 7, Q05020, doi:10.1029/2005GC001162, 2006.
Gerlach, T. M.: Volcanic sources of tropospheric ozone-depleting trace gases, Geochem. Geophys. Geosyst., 5, Q09007, doi:10.1029/2004GC000747, 2004.
Horrocks, L. A., Oppenheimer, C., Burton, M. R., and Duffell, H. J.: Compositional variation in tropospheric volcanic gas plumes: evidence from ground-based remote sensing, in Volcanic de-gassing, edited by C. Oppenheimer, D. Pyle and J. Barclay, Geo-logical Society Special Publications, 213, 349–369, 2003. Lee, C., Kim, Y. J., Tanimoto, H., Bobrowski, N., Platt, U., Mori, T.,
Yamamoto, K., and Hong, C. S.: High ClO and ozone depletion observed in the plume of Sakurajima volcano, Japan. Geophys. Res. Lett., 32 , 21809, doi:10.1029/2005GL023785, 2005. Martin, D., Ardouin, B., Bergametti, G., Carbonelle, J.,
Faivre-Pierret, R., Lambert, G., and Le Cloarec, M. F.: Geochemistry of sulfur in Mt. Etna plume, J. Geophys. Res., 91, 12 249–12 254, 1986.
Martin, R. S., Mather T. A., and Pyle, D.M .: Modeling the chemistry of high temperature mixtures of magmatic and at-mospheric gases, Geochem. Geophys. Geosyst., 7, Q04006, doi:10.1029/2005GC001186, 2006.
Mather, T. A., Pyle, D. M., and Oppenheimer, C.: Tropospheric Volcanic Aerosol, in Volcanism and the Earth’s Atmosphere, Geophysical Monograph 139, edited by: Robock, A. and Op-penheimer, Am. Geophys. Union, Washington, D.C. 189–212, 2003a.
Mather, T. A., Allen, A. G., Oppenheimer, C., Pyle, D. M., and Mc-Gonigle, A. J. S.: Size-resolved characterisation of soluble ions in the particles in the tropospheric plume of Masaya volcano, Nicaragua: Origins and plume processing, J. Atmos.Chem., 46(3), 207–237, 2003b.
McGonigle, A. J. S., Delmelle, P., Oppenheimer, C., Tsanev, V. I., Delfosse, T., Williams-Jones, G., Horton, K., and Mather, T. A.: SO2depletion in tropospheric volcanic plumes, Geophys. Res.
Lett., 31, L13201. doi:10.1029/2004GL019990, 2004.
M´etrich, N. and Clocchiatti, R.: Sulfur abundance and its specia-tion in oxidized alkaline melts, Geochim. Cosmochim. Acta, 60, 4151–4160, 1996.
Nicovich, J. M., Kreutter, K. D., van Dijk, C. A., and Wine, P. H.: Temperature- Dependent Kinetics Studies of the Reac-tions Br(2P3,2)+H2S ⇓ ♦ SH+HBr and Br(2P3,2)+CH3SH ⇓ ♦
CH3S+HBr. Heats of Formation of SH and CH¬S Radicals, J. Phys. Chem., 96, 2518–2528, 1992.
Oppenheimer, C., Francis, P., and Stix, J.: Depletion rates of SO2 in tropospheric volcanic plumes, Geophys. Res. Lett., 25, 2671– 2674, 1998.
Oppenheimer, C., Tsanev, V. I., Braban, C. F., Cox, R. A., Adams, J. W., Aiuppa, A., Bobrowski, N., Delmelle, P., Barclay, J., and McGonigle, A. J. S.: BrO formation in volcanic plumes, Geochimica Cosmochimica Acta, 70, 2935–2941, 2006.
Penkett, S. A., Jones, B. M. R., Brice, K. A., and Eggleton, A. E. J.: The importance of atmospheric ozone and hydrogen perox-ide in oxidising sulphur dioxperox-ide in cloud and rainwater, Atmos. Environ., 13, 123–137, 1979.
Ravishankara, A. R.: Heterogeneous and multiphase chemistry in the troposphere, Science, 276, 1058–1065, 1997.
Robock, A.: Volcanic Eruptions and Climate, Rev. Geophys., 38, 191–220, doi:10.1029/1998RG000054, 2000
Robock, A. and Oppenheimer, C.: Volcanism and the Earth’s atmosphere, AGU Geophysical monograph, 139, doi:10.1029/139GM03, 2003.
Sander, S. P., Friedl, R. R., Golden, D. M., Kurylo, M. J., Moort-gat, G. K., Keller-Rudek, H., Wine, P. H., Ravishankara, A. R., Kolb, C. E., Molina, M. J., Finlayson-Pitts, B. J., Huie, R. E., and Orkin, V. L.: Chemical Kinetics and Photochemical Data for Use in Stratospheric Modeling. Technical Report JPL Publication 06-2, Jet Propulsion Laboratory, Pasadena, CA, 2006.
Schwandner, F. M., Seward, T. M., Gize, A. P., Hall, P. A., and Dietrich, V. J.: Diffuse emission of organic trace gases from the flank and crater of a quiescent active volcano (Vulcano, Aeolian Islands, Italy), J. Geophys. Res., 109(D4), D04301, doi:10.1029/2003JD003890, 2004.
Symonds, R., Rose, W. I., Bluth, G. J. S., and Gerlach, T. M.: Volcanic-gas studies: methods, results and applications, in: Volatiles in Magmas, edited by: Carroll, M. R. and Halloway, J. R., Rev. Mineralogy, 30, 1–66, 1994.
von Glasow, R., Sander, R., Bott, A., and Crutzen, P. J.: Model-ing halogen chemistry in the marine boundary layer. 1. Cloud-free MBL, J. Geophys. Res., 107 , 4341, doi:10.1029/2001JD000 942, 2002.