HAL Id: hal-00304230
https://hal.archives-ouvertes.fr/hal-00304230
Submitted on 4 Jun 2008HAL is a multi-disciplinary open access
archive for the deposit and dissemination of sci-entific research documents, whether they are pub-lished or not. The documents may come from teaching and research institutions in France or abroad, or from public or private research centers.
L’archive ouverte pluridisciplinaire HAL, est destinée au dépôt et à la diffusion de documents scientifiques de niveau recherche, publiés ou non, émanant des établissements d’enseignement et de recherche français ou étrangers, des laboratoires publics ou privés.
Evolution of NOx emissions in Europe with focus on
road transport control measures
V. Vestreng, L. Ntziachristos, A. Semb, S. Reis, I.S.A. Isaksen, L. Tarrasón
To cite this version:
V. Vestreng, L. Ntziachristos, A. Semb, S. Reis, I.S.A. Isaksen, et al.. Evolution of NOx emissions in Europe with focus on road transport control measures. Atmospheric Chemistry and Physics Discus-sions, European Geosciences Union, 2008, 8 (3), pp.10697-10747. �hal-00304230�
ACPD
8, 10697–10747, 2008 European road transport control measures V. Vestreng et al. Title Page Abstract Introduction Conclusions References Tables Figures ◭ ◮ ◭ ◮ Back CloseFull Screen / Esc
Printer-friendly Version Interactive Discussion
Atmos. Chem. Phys. Discuss., 8, 10697–10747, 2008 www.atmos-chem-phys-discuss.net/8/10697/2008/ © Author(s) 2008. This work is distributed under the Creative Commons Attribution 3.0 License.
Atmospheric Chemistry and Physics Discussions
Evolution of NO
x
emissions in Europe
with focus on road transport control
measures
V. Vestreng1, L. Ntziachristos2, A. Semb3, S. Reis4, I. S. A. Isaksen5, and L. Tarras ´on1
1
Air Pollution Section, Research Dept., Norwegian Meteorological Institute, Oslo, Norway
2
Lab of Applied Thermodynamics, Aristotle University Thessaloniki, Thessaloniki, Greece
3
Norwegian Institute for Air Research, Kjeller, Norway
4
Centre for Ecology and Hydrology, Edinburgh, Scotland
5
Dept. of Geosciences, University of Oslo, Oslo, Norway
Received: 17 March 2008 – Accepted: 7 May 2008 – Published: 4 June 2008 Correspondence to: V. Vestreng (vigdis.vestreng@met.no)
ACPD
8, 10697–10747, 2008 European road transport control measures V. Vestreng et al. Title Page Abstract Introduction Conclusions References Tables Figures ◭ ◮ ◭ ◮ Back CloseFull Screen / Esc
Printer-friendly Version Interactive Discussion
Abstract
European emission trends of nitrogen oxides since 1880 and up to present are pre-sented here and are linked to the evolution of road transport emissions. Road trans-port has been the dominating source of NOx emissions since 1970, and contributes with 40% to the total emissions in 2005. Five trend regimes have been identified be-5
tween 1880 and 2005. The first regime (1880–1950) is determined by a slow increase in fuel consumption all over Europe. The second regime (1950–1980) is characterized by a continued steep upward trend in liquid fuel use and by the introduction of the first regulations on road traffic emissions. Reduction in fuel consumption determines the emission trends in the third regime (1980–1990) that is also characterized by impor-10
tant differences between Eastern and Western Europe. Emissions from road traffic continue to grow in Western Europe in this period, and it is argued here that the reason for this continued NOx emission increase is related to early inefficient regulations for NOx in the transport sector. The fourth regime (1990–2000) involves a turning point for road traffic emissions, with a general decrease of emissions in Europe during that 15
decade. It is in this period that we can identify the first emission reductions due to technological abatement in Western Europe. In the fifth regime (2000–2005), the eco-nomic recovery in Eastern Europe imposes increased emission from road traffic in this area. Western European emissions are on the other hand decoupled from the fuel con-sumption, and continue to decrease. The implementation of strict measures to control 20
NOx emissions is demonstrated here to be a main reason for the continued Western European emission reductions. The results indicate that even though the effectiveness of European standards is hampered by a slow vehicle turnover, loopholes in the type-approval testing, and an increase in diesel consumption, the effect of such technical abatement measures is traceable in the evolution of European road traffic emissions 25
ACPD
8, 10697–10747, 2008 European road transport control measures V. Vestreng et al. Title Page Abstract Introduction Conclusions References Tables Figures ◭ ◮ ◭ ◮ Back CloseFull Screen / Esc
Printer-friendly Version Interactive Discussion
1 Introduction
The historical trend in the anthropogenic emission levels of nitrogen oxides (NOx=NO+NO2) is increasingly important for our understanding, hence our ability, to optimize abatement of air pollution and reduce the adverse effects of these pollutants on ecosystems, human health and climate, on local, regional and global scales. 5
The anthropogenic NOxemissions are dominated by combustion processes in road transport with a 40% share in 2005, followed by power plants (22%), industry (16%), off-road transport (15%) and the residential sector (7%) (Vestreng et al., 2007a). An-thropogenic emissions in Europe are at least four times larger than the natural emis-sions from lightning, soil emisemis-sions and forest fires (Simpson et al., 1999). European 10
anthropogenic emissions of NOx contribute to about 30% of global NOx emissions in 1990, when excluding ships and biomass burning (Olivier et al., 1998; Cofala et al., 2007; Vestreng et al., 2006; Schultz et al., 2007). The evolution of emissions in Europe in the last 15 years (1990–2005) contrasts with the situation in Asia, Latin America, Middle East and Africa, where less policy regulations are in place and NOx emissions 15
are increasing (Naja et al., 2003; Cofala et al., 2007).
Much effort has already been invested in order to abate NOx emissions in Europe, both at national and at European-wide level. The first UNECE regulations to control emissions from motor vehicles (ECE-R15) were already being discussed in the 1950s and came into force in 1970 (UNECE, 1958; Berg, 2003). They were designed to 20
reduce the emissions of carbon monoxide (CO) and hydrocarbons (HC) due to incom-plete combustion. The early European legislation can be viewed as a response to the US initiatives, which had at that time already introduced air pollution control policies to address the degradation of air-quality in Los Angeles, California. Much later, and within the framework of the Convention of Long-range Transboundry Air Pollution (LR-25
TAP), two Protocols regulating NOxentered into force; the 1988 Sofia Protocol sets a limit to national annual emissions or transboundary flux of nitrogen oxides at the 1987 level, while the effect-based 1999 Gothenburg Protocol sets fixed emission ceilings
ACPD
8, 10697–10747, 2008 European road transport control measures V. Vestreng et al. Title Page Abstract Introduction Conclusions References Tables Figures ◭ ◮ ◭ ◮ Back CloseFull Screen / Esc
Printer-friendly Version Interactive Discussion
for the year 2010 (UNECE, 2004). The EU National Emission Ceilings (NEC) Direc-tive (EC, 2001) defines slightly more ambitious 2010 emission ceilings for some of the Member States than the Gothenburg Protocol. The reason for this is possibly that the NEC was designed to deliver slightly different environmental objectives compared to Gothenburg Protocol in terms of ecosystem protection. The European Commis-5
sion has also issued a number of Directives and instruments aiming to control NOx emissions from specific sectors. These are principally the Large Combustion Plant Directive (Directives 88/609/EEC and 2001/80/EC), emission limits for engines used in non-road mobile machinery (Directive 97/68/EC), the Waste Incineration Directive (Directive 2000/76/EC) and the Euro standards for road vehicles (Directive 70/220/EC 10
and revisions). The Euro standards for road transport emissions in Europe define the maximum limits of exhaust emissions from new vehicles sold in EU member states, but do not apply to vehicles already on the roads. No use of specific technologies is man-dated to meet the standards, though available technology is considered in the policy development. Different Euro limits have been implemented between 1992 and 2005, 15
and standards to be applied in 2010 have already been agreed.
Emissions from road transport have been determining NOx emission levels for decades. Engine-out NOx emissions consist mainly of NO (90–95%). NO is mainly formed by two mechanisms, basically the thermal (Zeldovich) and the prompt (Feni-more) mechanisms. The thermal mechanism is activated above 1600◦C and is respon-20
sible for more than 90% of emissions from road transport. Reis et al. (2000) showed that road traffic may contribute substantially to exceedances of ozone indicators for both health and forests in Europe. Further, Carslaw et al. (2007) demonstrated the risk for the EU hourly limit of nitrogen dioxide (200 µg/m3) not to be met by 2010 in European cities due to the recent developments in road transport. Globally, road trans-25
port is responsible for substantial increase in the concentration of tropospheric ozone (5–15%) not only in the vicinity of the source but also in remote areas (Granier and Brasseur, 2003; Matthes, 2007).
ACPD
8, 10697–10747, 2008 European road transport control measures V. Vestreng et al. Title Page Abstract Introduction Conclusions References Tables Figures ◭ ◮ ◭ ◮ Back CloseFull Screen / Esc
Printer-friendly Version Interactive Discussion
evolved since the 1880s and investigates to what extent the decrease in emissions after 1990 can be linked to policy regulations. Our analysis links NOxemission trends in Europe to the evolution of fuel consumption as well as to the changes in vehicle technology. It further distinguishes between the Eastern and Western European re-gions, where differences in the level of penetration of policy measures have an impact 5
on the evolution of the emissions. Although the analysis covers a 125 years time span, the main focus is on the last 15 years, when European NOx emissions have begun to decrease. The methodology developed is presented in Sect. 2 which also documents the data sources used in the analysis. Data quality is discussed in Sect. 3. Results on European trends in NOx emissions are presented in Sect. 4, and the discussion 10
on the effectiveness of policy measures is given in Sect. 5. Finally, conclusions are summarized in Sect. 6. Emissions from international shipping at European waters are analyzed in a forthcoming paper (Jonson et al., in preparation) and are thus not included here. With respect to the terminology adopted, NOx emission figures corre-spond to NO2-equivalents, except in cases where primary NO2emissions are explicitly 15
discussed.
2 Methodology and data used
A European NOx emission inventory that spans over 125 years has been compiled here to provide further insight in the evolution of European road traffic emissions. The inventory relies on available information on 1) activity data, 2) emission factors, 3) 20
abatement level, and 4) the level of policy penetration. Such information is largely variable from period to period and for the different European countries and areas, and determines to a large extent the accuracy of the final results. Concise information on the information sources and an evaluation of the uncertainty associated with each source is also included in the following.
ACPD
8, 10697–10747, 2008 European road transport control measures V. Vestreng et al. Title Page Abstract Introduction Conclusions References Tables Figures ◭ ◮ ◭ ◮ Back CloseFull Screen / Esc
Printer-friendly Version Interactive Discussion
2.1 1880–1985: EURONOX inventory
We have estimated anthropogenic fossil fuel and residential wood combustion emission by European country and sector every 5 years since 1880. The underlying activity data corresponds to the European historical country borders in the time span considered, and we distinguish between three different periods: 1880–1915, 1920–1945 and 1950– 5
1985. The emission estimation methodology differs only for the periods 1880–1945 and 1950–1985. An advantage of this study with respect to previous global estimates (e.g. van Aardenne et al., 2001; Schultz et al., 2007) is that we have applied emission factors which vary with time and by country.
Fuel consumption in the period 1880–1945 is calculated from energy and indus-10
try statistics collected by Mitchell (1981) and supplemented with information from the World Power Conferences (1948). According to international consumption and produc-tion statistics, fuel consumpproduc-tion in this period is dominated by solid fuel use. Detailed activity data and reliable emission factors are not available for this period, thus we de-rive the emissions by scaling 1950 emission sectors per country backwards in time, 15
based on the solid and liquid fuel consumption. We underline that one main implication is that possible important changes in the average emission factor for coal combustion during this period are not considered in our emission estimates.
In addition to the emissions from fossil fuel combustion, we also estimated biomass emissions in the residential sector. The coverage of wood consumption per country 20
is rather incomplete in international statistics, particularly before 1950. In addition, we considered that underreporting of wood consumption by countries could be an issue. Therefore we made two different estimates, one based on an extrapolation of OECD activity data (OECD, 2004), and a second one assuming that each person living in rural areas consumes 1 m3wood per year, with a conversion factor of 440 kg wood/m3 (Lun-25
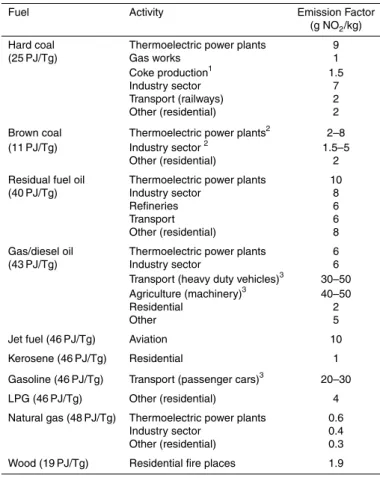
nan et al., 1991) and a historical rural population dataset (Marti-Henneberg and Tapi-ador, 2008). For both sets of activity data we used an emission factor of 100 g NO2/GJ (IPCC, 2003) equivalent to 1.9 g/kg wood, using a heating value of 19 GJ/ton for wood
ACPD
8, 10697–10747, 2008 European road transport control measures V. Vestreng et al. Title Page Abstract Introduction Conclusions References Tables Figures ◭ ◮ ◭ ◮ Back CloseFull Screen / Esc
Printer-friendly Version Interactive Discussion
(Sternhufvud et al., 2004). The results from this evaluation are addressed in Sect. 4. With regard to the period 1950–1985, we distinguished between the originally OECD and non-OECD countries, based on the availability of activity data. A detailed break-down of activity data is published in the OECD Energy Statistics (OECD, 1966, 2004), and we estimated NOx emissions from about thirty different sub-sectors aggregated 5
per SNAP sector (Energy Production from Power-plants-S1, Residential-S2, Industry-S3 and S4, Road transport-S7 and Off-road machinery-S8). For the non-OECD coun-tries we used the production figures of electric power in thermal power plants from the UN Energy Statistics (UNECE, 1976, 1980 and 1981), to deduce the amounts of lignite and other fuels used in electric power plants. For most countries it has been assumed 10
that mainly lignite was used in electric power plants. However, hard coal needs also to be included in energy budget of Poland and Hungary, while the Former Soviet Union (USSR) and Romania have been also using coal and natural gas, according to the statistics.
Coke production figures were used to deduce the amount of coal used for coke. The 15
remaining coal was distributed between the industrial and the residential sector. For the non-OECD countries, gasoline was assumed to be consumed only in cars, or in other internal combustion engines. It was also assumed that gas oils must have been too expensive to be used except in internal combustion engines of cars, trucks, off-road equipment and machinery, and in agriculture. In general, these uses are assumed to 20
account for 80% of the gas oil consumption.
The emission factors used for this period are shown in Table 1 and are broadly based on the work by Pacyna et al. (1991), reviewing a large selection of country specific emission factors from national and international programmes, with a special attention on Eastern Europe. The emission factors from Pacyna (1991) are representative of 25
1985. We have altered these emission factors to reflect changes over time and be-tween countries. Further improvements have been carried out for emissions in the transport sector which is the main focus in our study. These improved emission factors are mainly based on the work by Samaras and Zierock (1996). Finally, in order to
facil-ACPD
8, 10697–10747, 2008 European road transport control measures V. Vestreng et al. Title Page Abstract Introduction Conclusions References Tables Figures ◭ ◮ ◭ ◮ Back CloseFull Screen / Esc
Printer-friendly Version Interactive Discussion
itate crude conversion of the emission factors used in this study to other units, we have also indicated average calorific values in brackets in Table 1.
One main point is that the emission factors for motor vehicles increase with time during the period 1950 to 1985. This is to reflect the fact that the development of new gasoline engines over this period led to less fuel-enriched mixtures, lower scaveng-5
ing losses, and higher compression rates to improve fuel efficiency and to control CO and HC emissions that were the focus at the time (UNECE, 1958). As a side-effect of improved combustion, engines led to increased (thermal) NOx emissions to the atmo-sphere. According to Samaras and Zierock (1996), emission factors of 20.4 g/kg were applicable for gasoline cars without emission controls, i.e. vehicles produced before 10
1970 (Pre ECE R-15) but for vehicles with non-catalyst control (i.e. improved combus-tion) the emission factors increased to 36.7 g/kg (Table 1 footnote 3).
An increase in emission factors also occurred for diesel engines during this period, according to the US-AP42 (US EPA, 1991). The low emission factors for diesel en-gines are typical of enen-gines with indirect injection. This design is not favoured for 15
modern, large trucks, which have direct-injection engines and higher compression ra-tios. The effective compression ratio may be further increased by turbo-charging, which further promotes the formation of NOx. Emissions from for heavy duty vehicles (HDV) were not regulated until 1988 with the introduction of the ECE 49 Regulation. The lower limit of the emission factor range for HDVs in Table 1 (30 g/kg) is comparable 20
to Conventional HDVs included in COPERT, when these are converted per fuel mass used, (http://lat.eng.auth.gr/copert) and, further, to the uncontrolled NOxemission fac-tors in the GAINS database (http://www.iiasa.ac.at/web-apps/apd/gains) developed at IIASA. Measurement studies more often concern US and more recent vehicle fleets (e.g. Kirchstetter et al., 1999; Yanowitz et al., 2000; Kristensson et al., 2003; Schmid et 25
al., 2000; Kohler et al., 2004), but Ekstr ¨om et al. (2004) report on-road optical remote sensing measurements in Sweden per vehicle technology class which support the up-per limits of the emission factor ranges both for gasoline passenger cars and heavy duty vehicles in Table 1.
ACPD
8, 10697–10747, 2008 European road transport control measures V. Vestreng et al. Title Page Abstract Introduction Conclusions References Tables Figures ◭ ◮ ◭ ◮ Back CloseFull Screen / Esc
Printer-friendly Version Interactive Discussion
The emission factors we have assigned to HDVs are lower in Eastern European (24–40 g/kg) than Western European countries (30–50 g/kg), to reflect the differences in vehicle technologies following the implementation of the ECE-R15 regulations in Western Europe. In addition, some Eastern European countries used to have a high proportion of 2-stroke engines which resulted in even lower average NOx emission 5
factors. In the extreme case of Former East Germany, more than 50% of the vehicles used to have 2-stroke engines, and the resulting emission factor for gasoline cars is consequently estimated at a much lower value (6–10 g/kg) than for the other countries included in this study (20–30 g/kg). While these simple considerations do not provide detailed and accurate inventories for each country, they may still give useful estimates 10
of regional and temporal trends.
For stationary sources we do not include any variation of emission factors with time. We assign country specific emission factors for brown coal in thermoelectric power plants and in the industry according to fuel quality and combustion technology in the respective countries (UNECE, 1981; McInnes, 1996). This implies that emission factors 15
for power plants are generally higher in Eastern Europe compared to Western Europe. The highest emission factor is assigned to Former Czechoslovakia (8 g/kg), followed by Albania, Bulgaria, Former USSR and Yugoslavia (7 g/kg), Poland (6 g/kg), Former East Germany, Hungary, Romania, Austria, Denmark and France (5 g/kg), Spain (4 g/kg), former West Germany Italy, Portugal and Turkey (3 g/kg) and Greece (2 g/kg). Due to 20
lack of information about differences between countries in the industry sector, we have applied a uniform emission factor of 3 g/kg for the industry sector in all Eastern Eu-ropean countries. Emission factors for Western EuEu-ropean industries are about 1 g/kg lower than those listed above for power plants.
It is worth noting that we do not include the gas associated with the production of 25
coke from coal, hence available for combustion (e.g. coke oven gas or blast furnace gas from the iron and steel industry) in separate sectors. It is instead included in the emission factor for coke production itself, and this is why we apply an emission factor for coke production orders of magnitude larger than Pacyna et al. (1991). Combustion
ACPD
8, 10697–10747, 2008 European road transport control measures V. Vestreng et al. Title Page Abstract Introduction Conclusions References Tables Figures ◭ ◮ ◭ ◮ Back CloseFull Screen / Esc
Printer-friendly Version Interactive Discussion
in the residential sector is assumed to occur mainly in small domestic boilers, and the emission factor chosen for combustion in oil refineries is taken from Takacs et al. (2004).
Emissions from international shipping and aviation are not included in this study. Fur-ther we do not include emissions not directly related to fuel consumption like nitric acid 5
and fertilizer production. According to Pacyna et al. (1991), these are minor sources (0.5% contribution around 1980), as is agricultural burning of straw and stubble (less than 1%). Emissions from waste, which, according to data reported to the LRTAP Con-vention, contribute less than 1% to the national total in the 1980s is not included. No attempt has been made to include NO from soils although some authors (e.g. Stohl et 10
al., 1996) argue that the emissions are mainly from arable land and should be therefore considered as anthropogenic.
2.2 1980–2005: EMEP NOxinventory
For data on NOx emissions after 1980 this study relies mainly on data from the EMEP (Cooperative Programme for Monitoring and Evaluation of the Long-range 15
Transmission of Air Pollutants in Europe) programme. The EMEP inventory consists as far as possible of official data reported annually by 51 Parties to the Conven-tion on Long-range Transboundary Air PolluConven-tion (LRTAP). The emission data is com-piled at national level in accordance with the UNECE Emission Reporting Guidelines (UNECE, 2003) and the EMEP/CORINAIR Guidebook (http://reports.eea.europa.eu/ 20
EMEPCORINAIR4/en). The national emission estimates are accompanied by an In-formative Inventory Report (IIR) documenting the uncertainties in the data used and possible deviations from the recommended methodologies in the Guidebook. These emissions are annually reviewed and evaluated, to check for errors and identify ar-eas where improvements may be necessary (e.g. Vestreng et al., 2007a). Since the 25
adoption of the new reporting emission reporting Guidelines in 2002, the official re-porting of data for the road transport sector includes valuable information per vehicle type i.e. Passenger cars, Light-duty vehicles, Heavy-duty vehicles, and Mopeds and
ACPD
8, 10697–10747, 2008 European road transport control measures V. Vestreng et al. Title Page Abstract Introduction Conclusions References Tables Figures ◭ ◮ ◭ ◮ Back CloseFull Screen / Esc
Printer-friendly Version Interactive Discussion
motorcycles. Emission data available at this level of detail is mainly restricted to the period from 1990 onwards. Several countries report data on a more aggregated level up to 2000, i.e. total Road Transport (SNAP 7). The lack of detailed emission data in the 1980s and partly in the 1990s, has limited parts of our analysis to the aggregated SNAP 7 level. In addition to emission data, national reporting includes activity data for 5
the historical years 1990, 1995, 2000 and 2005. These official activity data reported by countries have been used for the study of emission trends in the period 1990–2005. In the absence of reported data, our analysis for the period 1990–2005 relies on trends in fuel consumption and implied emission factors from the GAINS database. Historic fuel consumption data in GAINS are extracted from national and international energy 10
statistics. For the period 1980 to 1990, we include fuel consumption data from the sources outlined above for the EURONOX inventory.
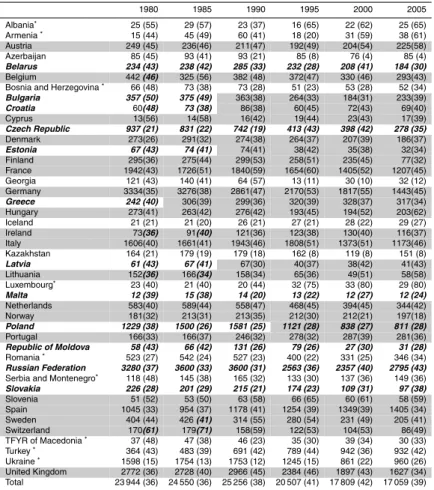
Table 2 presents national NOx emission trends and gives an overview of the com-pleteness of official emissions in the EMEP inventory between 1980 and 2005. The relative share of emissions from road transport (in brackets) is also listed. The emis-15
sions are based on officially reported data, to the extent possible. Countries which passed the EMEP review are highlighted with grey background in Table 2; a total of nineteen countries. The table identifies also a second group of countries for which re-ported data had to be completed by interpolation and extrapolation in order to achieve full emission trends for the period. These twelve countries are marked in bold ital-20
ics. For the remaining countries, emissions were derived from other sources. The main source for non-offical emission estimates in the EMEP inventory is data from the RAINS/GAINS model (http://www.iiasa.ac.at/web-apps/apd/gains) developed at IIASA. These emissions are not completely independent from those officially reported in that IIASA, through bi-lateral consultations, may include data provided by the countries 25
themselves. The RAINS/GAINS model is now capable of reproducing national emis-sions for NOxfor almost all Parties with an uncertainty margin of less than 5% (UNECE, 2007). Because there are a few countries for which neither official nor RAINS/GAINS data are available, EDGAR emission data (http://www.mnp.nl/edgar) are also included.
ACPD
8, 10697–10747, 2008 European road transport control measures V. Vestreng et al. Title Page Abstract Introduction Conclusions References Tables Figures ◭ ◮ ◭ ◮ Back CloseFull Screen / Esc
Printer-friendly Version Interactive Discussion
The EDGAR inventory is a global inventory but it does not have the same level of de-tailed vehicle classification as the RAINS/GAINS model. There are nine countries for which RAINS data have been used and these are marked with a star in Table 2. The emission estimates for the remaining four countries rely on EDGAR emission data. The coverage of reported emissions is about 40% in the 1980s, increasing to nearly 60% 5
after 1990. The level of confidence is considered to be higher for the reported and reviewed emission data, due to country specific insight and the detailed input to the calculations.
3 Data quality
As indicated from the discussion above, the level of accuracy of the data used all 10
through the NOxinventory from 1880 to 2005 increases as we approach recent times. In this section we document the uncertainties in the EMEP and EURONOX inventories, and justify the merging of these two inventories.
3.1 Uncertainties in the EMEP inventory
There are recognised uncertainties in the selection of emission factors and even though 15
national statistics of activity data as compiled from e.g. data reported by individual fa-cilities, registration offices and different surveys are in most cases reliable, there is also an element of uncertainty in this basic input to the national emission calculations. Discrepancies between actual and apparent national emission estimates are also in-troduced when emission data are reported, in line with the reporting Guidelines, based 20
on fuel sold rather on fuel used. This is because the amount of fuel sold in a country may be strongly influenced by “fuel tourism”. This is a term used for retail purchase of fuel in one country for consumption abroad, mainly due to fuel price differences. Although emissions associated to the combustion of this fuel do not occur in the coun-try where the fuel was sold, the UNECE reporting Guidelines require Parties to report 25
ACPD
8, 10697–10747, 2008 European road transport control measures V. Vestreng et al. Title Page Abstract Introduction Conclusions References Tables Figures ◭ ◮ ◭ ◮ Back CloseFull Screen / Esc
Printer-friendly Version Interactive Discussion
these emissions as national emissions. The effect of this fuel tourism is shown to have opposite and equally large effect for countries with high “green taxes” as discussed in Sect. 5 in the case of Germany. The implication is that while the European emission trend for NOx may be correctly reflected, the national (road transport) emission trends for several European countries may be affected by the tax and transit levels.
5
The uncertainty level for national inventories included in the EMEP inventory is based on information given in the Informative Inventory Reports (IIR) accompanying the of-ficial submissions emissions under the LRTAP Convention. Based on a review of this information from a limited number of countries, the uncertainty in national emissions is considered to be between 8% and 23% for Western Europe and around 25% for 10
Eastern Europe. The EMEP inventory contains in addition emission estimates from the RAINS/GAINS model, and according to Sch ¨opp et al. (2005), the uncertainty in these emissions are comparable to those reported by the countries. Uncertainty esti-mates for individual sectors are not reported by the Parties, but Sch ¨opp et al. (2005) indicate that the sector uncertainty is higher, and might be nearly three times larger 15
for emissions from gasoline passenger cars and diesel heavy duty trucks. Kuhlwein and Friedrich (2000) estimate the statistical error in transport NOx emissions in West Germany to be 16–22%, comparable to the results for United Kingdom estimated by Sch ¨opp et al. (2005). The above uncertainty ranges are applicable from 1990 onwards (Vestreng et al., 2006). Quantitative uncertainty estimates for the 1980s are not avail-20
able, but they are likely to be larger, due to the lower coverage of reported emissions and absence of published non-official estimates. In addition, recalculation of emission data by many Parties are only performed from 1990 onwards, hence the accuracy in the 1980s emissions may not benefit from methodological improvements in emission estimation.
25
A complementary way to assess the validity of emission data is to combine model and observation data. The general downward trend in EMEP emission data from 1990 onwards have been confirmed by a recent model study by Jonson et al. (2006). The study concludes that even though the EMEP model tends to overpredict winter
concen-ACPD
8, 10697–10747, 2008 European road transport control measures V. Vestreng et al. Title Page Abstract Introduction Conclusions References Tables Figures ◭ ◮ ◭ ◮ Back CloseFull Screen / Esc
Printer-friendly Version Interactive Discussion
trations and underpredict summer concentrations compared to measurements, NO2 levels and seasonal patterns are well captured. Further, Fagerli and Aas (2008) show that the reduction in EMEP NOxemissions between 1990 and 2003 are comparable to the downward trend in measurements of nitrate in precipitation.
A trend study by Konovalov et al. (2008) applying inversion techniques with GOME 5
and SCIAMACY measurements between 1996 and 2004, broadly confirms that the NOx emission trends in Europe have been decreasing, and further indicates that the quality of the EMEP inventory has increased over the last few years. Our evaluation of regional differences in inventory uncertainties is in agreement with the above study, where particularly large differences between the EMEP and satellite data are found 10
in Balkan countries, Georgia, Russia and Turkey. It is however important to consider that there are limitations both in the model and in the observations when such top-down methodologies are applied to derive emission trends, and we suspect that the lack of reduction in emissions seen for Italy in Konovalov et al. (2008) could also be due to limitations in the vertical extent of the chemical transport model applied for the 15
calculations.
3.2 Uncertainties in the EURONOX inventory
The quality of the EURONOX inventory is much influenced by availability and accuracy of the activity data. There are some gaps in the statistical activity data, but in general the quality of the emissions is better from 1950 onwards than before 1950, when less 20
detailed data was available and emissions had to be extrapolated backwards in time. Also, the uncertainty is higher for Eastern than for Western European countries, due to the lack of activity data in specific consumption sectors. There are also uncertain-ties linked to the selection of emission factors for different sectors and the choice of method, e.g. more generalized emission factors. Emission measurements from sta-25
tionary sources have only become available in the last 30 years, while measurements of mobile sources came even later. The quality of the emission estimates is hence expected to increase as we approach recent times.
ACPD
8, 10697–10747, 2008 European road transport control measures V. Vestreng et al. Title Page Abstract Introduction Conclusions References Tables Figures ◭ ◮ ◭ ◮ Back CloseFull Screen / Esc
Printer-friendly Version Interactive Discussion
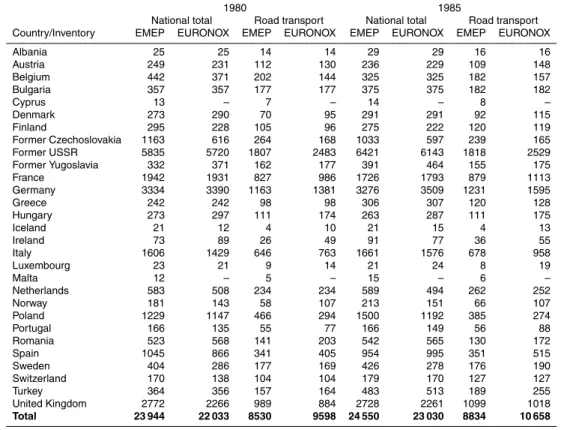
The comparability between the EURONOX and EMEP inventories has been as-sessed for the two common years, 1980 and 1985. Table 3 shows differences in national total and road transport emissions per country in both inventories. The agree-ment on the national total levels is generally good, with an underestimation of the European total in EURONOX relative to EMEP by 8% and 6% in 1980 and 1985, re-5
spectively. The better agreement in 1985 is probably because the emission factors applied are more representative for 1985 than for 1980. The general overestimation indicates that the emission factors do not reflect any of the emission controls already effective in the 1980s. Particularly large differences between reported and estimated emissions occur for Czechoslovakia, where we apparently underestimated the emis-10
sions by a factor 2. This occurs in spite of our use of emission factors which take into account both the very high energy content of Bohemian lignite and the combus-tion technology in the Czechoslovakian power plants. If the reported Czechoslovakian NO2emissions are correct, the NO2/capita ratio in 1980 would have been 74 kg/capita, i.e. far outside the NO2/capita range of 20–45 kg elsewhere in Europe, and suggests 15
that the sum of the reported Czech and Slovakian NO2emissions are too high. Kop ´aek and Vesl´y (2005) have estimated the Czechoslovakian emission to about 710 Gg, thus is more of support of our calculations. The differences in emission estimates for Swe-den are also quite large (factor 1.5). The use of gas oils in off-road machinery could explain the underestimation relative to the official emission in this case. Such large 20
differences will be discussed with the national emission experts during the forthcoming reviews.
The comparability is lower when sector data are considered, but the differences are still mostly within the uncertainty range indicated by Sch ¨opp et al. (2005). In contrast to the national total emissions, road transport is generally increasingly overestimated by 25
the EURONOX inventory, indicating that the emission factors applied might have been too high for some countries. The differences are however particularly large for some of the Eastern European countries, and here the discrepancies in sector emissions could also be attributed to the lack of detailed activity data statistics. While it is clear that
ACPD
8, 10697–10747, 2008 European road transport control measures V. Vestreng et al. Title Page Abstract Introduction Conclusions References Tables Figures ◭ ◮ ◭ ◮ Back CloseFull Screen / Esc
Printer-friendly Version Interactive Discussion
much more detailed information about the conditions in each country would have been desirable when developing the EURONOX inventory, the agreement with the EMEP data is considered sufficient to merge the two inventories in 1980, by scaling the EU-RONOX inventory to the relevant EMEP sectors. In order to account for the sources not included in the EUONOX inventory, we scaled the residential sector also together 5
with the EMEP agricultural and waste emissions.
3.3 Comparison with other estimates
The combined EURONOX and EMEP inventory is compared to independent invento-ries both at national (anthropogenic) total and at road-transport levels. The preferred option would have been to make the comparison by country, but the other inventories 10
were not available in such detail. Sch ¨opp et al. (2003) has compiled a NOx inventory based on a study by Dignon and Hameed (1989) between 1880 and 1960. The Dignon and Hameed (1989) inventory is merged with estimates from an old version of the RAINS model from 1960 onwards. The European NOx trend presented in Sch ¨opp et al. (2003) differs considerably from our work in that emissions are consistently higher 15
in Sch ¨opp et al. (2003) over the whole 1880–2005. The difference between the in-ventories is particularly large in the 1950s, and amount to nearly 40% in 1960 at the European level. Dignon and Hameed (1989) derive emissions by regression analysis from total fuel consumption. It is likely that our refined approach, with application of representative emission factors in distinct fuel consumption sectors, is the main reason 20
for the large discrepancy between these two inventories.
A global inventory published by van Aardennne et al. (2001) is available for the years 1890 to 1990 in ten-year intervals. The road-transport emissions are not separately documented but are included in the fossil fuel combustion sector. National and road-transport data per decade between 1960 and 2000 were made available to us on a 25
regional level for the more recent RETRO inventory (Schultz et al., 2007). EDGAR data (http://www.mnp.nl/edgar) are available per country and sector in five-year in-tervals between 1990 and 2000. Comparison with these three inventories has been
ACPD
8, 10697–10747, 2008 European road transport control measures V. Vestreng et al. Title Page Abstract Introduction Conclusions References Tables Figures ◭ ◮ ◭ ◮ Back CloseFull Screen / Esc
Printer-friendly Version Interactive Discussion
made on the regional “OECD Europe” and “East Europe” level, as defined by EDGAR (http://www.mnp.nl/edgar). The comparison is made from 1920 onwards as such re-gional comparisons are hampered by differences in country borders, particularly before 1920.
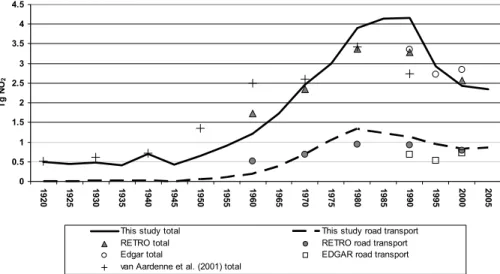
The OECD emissions presented in Fig. 1 represent between 97% (1920) and 55% 5
(2005) of the total European emissions according to our inventory. Our work and the van Aardenne et al. (2001) study compare well both in terms of trend and national emis-sions level over the whole hundred year time span (Fig. 1). Van Aardenne et al. (2001) emissions are slightly lower (less than 20%) compared to our work in 1970 and 1980. Since detailed activity data is available for this period, the difference is apparently due 10
to lower emission factors applied in the van Aardenne et al. (2001) inventory. The RETRO inventory defines the peak in total emissions in 1980, contrasting both our work and the work by van Aardenne et al. (2001). The RETRO national total estimates are lower than this study, the van Aardenne et al. (2001) and the EDGAR inventories for all years but 2000, where the inventories coincide. The underestimation in the RETRO 15
inventory compared to EMEP can only be partly explained by the incompleteness in the RETRO inventory with respect to national navigation, railway, waste treatment and disposal, and cement manufacturing. The difference in trend between the RETRO and the other inventories between 1980 and 2000 seems to be due to application of more efficient abatement in stationary sources, as the trend in road transport compares fairly 20
well both by our work and the EDGAR inventory. Based on these considerations, we conclude that our work is closer to the van Aardenne et al. (2001) and EDGAR esti-mates than the RETRO emissions at the total OECD level, even though the RETRO inventory for the road transport sector are similar to ours.
The much larger relative differences in emission level (more than 100% in some 25
years) and trends for both total and road transport emissions in “East Europe” confirm that the uncertainties are larger in this area (Fig. 2). The comparison indicates an over-estimation of emission totals in our study between 1980 and 1990 comparable to the anticipated too high reported emissions from the Czech Republic and Slovakia
previ-ACPD
8, 10697–10747, 2008 European road transport control measures V. Vestreng et al. Title Page Abstract Introduction Conclusions References Tables Figures ◭ ◮ ◭ ◮ Back CloseFull Screen / Esc
Printer-friendly Version Interactive Discussion
ously discussed. Road transport emissions increase in the EDGAR inventory between 1995 and 2000, contrasting the EMEP emissions. This increase is reflected in the to-tals, and results in an overestimation of the EDGAR emissions in year 2000 compared both to our study and to the RETRO emissions. The increase in transport emissions in EDGAR follows the trend in fuel consumption in this area, and does not seem to take 5
into account that emissions have decreased in line with the implementation of Euro standards in countries like Poland and the Czech Republic as discussed below. The RETRO road transport trend is much weaker than in our work, indicating that emission factors vary less with time.
4 Results on European emission trends 1880–2005
10
4.1 European total trends
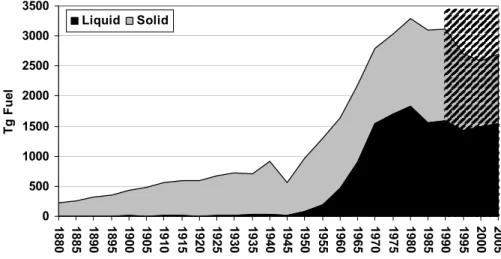
Figure 3 shows the trends in solid and liquid fuel consumption from 1880 to 2005 as compiled for this study. The total fuel consumption increased by more than a factor of ten over a period of a hundred years (1880–1980). Before 1950, solid fuel was the main energy carrier in Europe, and the consumption increased steadily from 1880 onwards; 15
the increase only interrupted by the economic depressions in the 1930s and later during the Second World War. Liquid fuel consumption showed a dramatic increase after 1950, among other reasons due to the availability of oil imported from the Middle East. The results presented here trace the relative importance of liquid fuel consumption in comparison with solid fuel use. Between 1950 and 1970 the consumption of liquid fuel 20
increased by a factor 18, and has exceeded the solid fuel consumption in all years since 1970. While European solid fuel consumption continued to increase until to the end of the 1980s, the increase in liquid fuel consumption ceased between 1970 and 1980, decreased thereafter until about 2000, and then increased again. The stabilisation and decrease in liquid fuel consumption after the 1970s is a result of the high oil prices 25
ACPD
8, 10697–10747, 2008 European road transport control measures V. Vestreng et al. Title Page Abstract Introduction Conclusions References Tables Figures ◭ ◮ ◭ ◮ Back CloseFull Screen / Esc
Printer-friendly Version Interactive Discussion
consumption in Eastern European countries. Solid fuel consumption drops sharply between 1990 and 2000 and increases thereafter. The decline in solid fuel is mainly due to decrease in hard coal all over Europe. In addition the consumption of brown coal went down in the EU area.
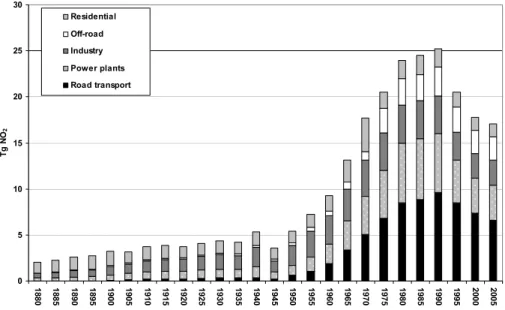
The trends in European NOxemission related to these fuel consumption results are 5
presented in Fig. 4, where also trends per sector are included. The sectors included in this analysis broadly follow the SNAP categorization, i.e. road transport, energy production from power plants, industry, off-road and residential. NOx emissions from residential wood combustion (not shown separately in Fig. 4) only contribute in appre-ciable amounts to the total NOx emissions around the turn of the 19th century when 10
the contribution is estimated to be around 14%. From 1900 and onwards emissions from biomass have been minor (1–9%). Our results indicate that the residential wood consumption statistics are reasonable compared to our “rule of thumb” estimate.
National shipping and domestic aviation is included in the off-road sector. Agriculture and waste, being in general minor NOxsources, have been merged with the residential 15
sector. This distinction of sectors clearly shows the dominant effect of road transport in emissions over the last 35 years. Based on the developments in road transport, we have distinguished five emission trend regimes between 1880 and 2005. In the first regime, 1880–1950, the historical total NO2emission trend follows the moderately growing fuel consumption. Between 1950 and 1980 (the second regime), NOx emis-20
sions grew steeply by a factor of 4.4, i.e. almost twice as fast as the sulphur emission increase during this same period (Vestreng et al., 2007b). The NOxemission trend was strongly related to the increase in road transport emissions during this period, as indi-cated in Fig. 4. Already in 1970 the road transport emissions became the single most important source of NOx with a share of nearly 30% of total emissions. The growth 25
in the second and third largest sources (power plants and industry) was considerably less. The large change in the residential and off-road sectors between 1970 and 1975 shown in Fig. 4 was due to a reduction in the domestic consumption of residual fuel oil and an increase in diesel consumption in the agricultural sector. While we find the
ACPD
8, 10697–10747, 2008 European road transport control measures V. Vestreng et al. Title Page Abstract Introduction Conclusions References Tables Figures ◭ ◮ ◭ ◮ Back CloseFull Screen / Esc
Printer-friendly Version Interactive Discussion
decrease in residual oil for heating plausible, we suspect that the detailed statistics we have used on diesel consumption prior to 1970 might be defective.
In the third regime, 1980–1990, the share of NOx emissions from road transport is large (about 40%), and has remained relatively constant at the European level for the last 25 years (Table 2 and Fig. 4). Total NOx emissions peaked in 1990, partly due 5
to continued increase in road transportation activity up to this point in time, and partly to the fact that emissions from stationary sources remained relatively stable between 1980 and 1990. The fourth regime, 1990–2000, is characterized by a steep decline in NOxemissions. The highest share of road transport to the total emissions (42%) is found around year 2000, and does not coincide with the peak in total NOx emissions. 10
This is due to the slower reduction rate of road-transport emissions (22%) relative to emissions from power plants (42%) and the industry (33%), between 1990 and 2000. As a result of the combined reductions, the total NOx emissions monotonically de-creased by 32% between 1990 and 2005. The largest reductions took place in the first half of the 1990s. The reasons of this decline are different in different parts of Eu-15
rope ad will be explained in the next section. Finally, in the fifth emission trend regime, 2000–2005, the downward emission trend has flattened out.
4.2 Trend differences between European countries in the last twenty-five years We focus our analysis on the last three emission trend regimes, i.e. 1980–2005 for two main reasons. First, large changes in the emission trends can at least partly be asso-20
ciated to the technological development and policy regulations in this period. Second, the emission data uncertainty should be lower than in the period before 1980, as indi-cated in Sect. 3, and this may lead to more solid conclusions. The analysis particularly addresses road-transport, which is the most significant sector and a number of policy regulations have been developed to abate NOx emissions from vehicles. The effec-25
tiveness of these regulations in Eastern and Western European countries is separately assessed.
ACPD
8, 10697–10747, 2008 European road transport control measures V. Vestreng et al. Title Page Abstract Introduction Conclusions References Tables Figures ◭ ◮ ◭ ◮ Back CloseFull Screen / Esc
Printer-friendly Version Interactive Discussion
and road transport emissions (percentage contribution in brackets) are highlighted in Table 2. The largest contributors are the Russian Federation, United Kingdom and Germany. The total NOxemissions in Europe increased by 5% from 1980 to 1990 due to increased emissions in most countries but a few notable exceptions like Germany and France where emissions from power plants and the industry were reduced. 5
NOx emissions decreased in most countries between 1990 and 2005, but there are substantial differences in the emission trends depending on the socio-economic and political situation in each country. A large reduction appears between 1990 and 1995 (Fig. 4) due to the disintegration of the Soviet Union in 1991. As a result of the eco-nomic recession, the reduction in NOx emissions from the power plants and the indus-10
try was twice as large in the east as in the west, despite the introduction of specific abatement measures in the latter.
Except for the effect of this outstanding political situation, the NOx emission trend over the period 1990 to 2005 has been dominated by changes in road transport. How-ever, there are large differences between the east and the west. In Western Europe, 15
road transport has been the dominant NOxemission source over the whole period 1980 to 2005, while power plants were the most important NOx source in Eastern Europe until 1995. For example, the road transport contribution in 1990 varied from less than 20% of total NOxin Ukraine and Kazakhstan to about 60% in France and Switzerland. As a result, 70% of the total European road transport NOx emissions in 1990 came 20
from Western Europe. In 2005, this share dropped to 63% mainly due to reductions in Western European emissions, but also due to increase in emissions in the recovering economies in Eastern Europe.
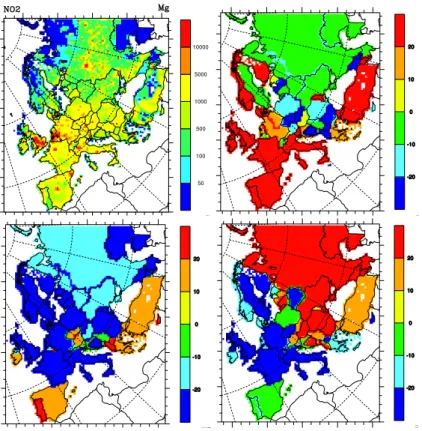
Due to the dominant character of road transport emissions, Fig. 5 presents the trends in road transport NOx emission, separately for the periods 1980–1990, 1990–2000 25
and 2000–2005 together with a reference map of emissions in 2005 (upper left map). The legend accompanying the difference maps (−20% to +20%) has been chosen to highlight the main differences, but the percentage differences might in certain cases exceed ±50% in any of the three periods considered.
ACPD
8, 10697–10747, 2008 European road transport control measures V. Vestreng et al. Title Page Abstract Introduction Conclusions References Tables Figures ◭ ◮ ◭ ◮ Back CloseFull Screen / Esc
Printer-friendly Version Interactive Discussion
4.2.1 1980–1990
Road transport emissions in Europe increased by 13% in the period 1980–1990 de-spite a 10% reduction in Eastern Europe (cold colours in the upper right map of Fig. 5). The reduction in the east is linked to decreased fuel consumption due to income de-terioration, as a consequence of the inefficiency in resource allocation (investments) 5
(Gros and Steinherr, 1991). Exceptions to this general picture, where emissions in-creased, are Armenia, the Republic of Moldova, Hungary, Slovenia, Croatia and Es-tonia. While the explanation for the increased emissions in Hungary can readily be linked to the increase in gasoline consumption, the situation is not clear for the Former Yugoslav and USSR Republics. Fuel consumption data for individual Former Yugoslav 10
and USSR Republics have not been available to us for the period 1980–1990, thus firm conclusions regarding the reasons behind the apparent increase in emissions can-not be drawn. Based on the rather stable fuel consumption trend in both the Former USSR and Yugoslavia between 1980 and 1990, it is not unlikely that fuel consumption increased in some of these Republics and decreased in other parts of this region. 15
In most of Western Europe and Turkey, road transport emissions increased between 1980 and 1990 (warm colours in the upper right map of Fig. 5). The overall increase was 27% in Western Europe. Fuel consumption went down or stabilized also in this region due to the high oil prices following the oil crisis in the 1970s. At the same time, early non-catalyst controls introduced with the different steps of UNECE Regulation 20
No. 15 (1970–1983) were associated with an increase in NOxemissions from vehicles (Berg, 2003). Due to relatively slow fleet turnover, as further discussed in the next section, the introduction of the ECE-R15 regulation maybe responsible for the over-all increase between 1980 and 1990. In some Western European countries though, road transport emissions decreased between 1980 and 1990. These are Sweden, 25
Belgium, Luxembourg, Austria, Switzerland, Cyprus and Malta. The fuel consumption went down also in these counties. A possible explanation for the emission decrease could be the early introduction of diesel passenger cars. In the case of Turkey, the
ACPD
8, 10697–10747, 2008 European road transport control measures V. Vestreng et al. Title Page Abstract Introduction Conclusions References Tables Figures ◭ ◮ ◭ ◮ Back CloseFull Screen / Esc
Printer-friendly Version Interactive Discussion
increased emissions are due to a substantial (80%) increase in gasoline consumption.
4.2.2 1990–2000
In the period 1990–2000, road transport emissions decreased by 23% in Europe, and reductions were evident both in the east and the west (Fig. 5, lower left map). In East-ern Europe, the decrease in emissions is associated with a decrease in fuel consump-5
tion in former Soviet republics, Romania and Bulgaria. A country’s transport volume is closely linked to its GDP, and the overall decrease in road transport is an effect of the restructuring of the economies after the disruption of the Soviet Union in 1991. Russia is an important trade partner, so the depression also affected countries outside the Union. Further, the infrastructure in this region which was already rather poor fur-10
ther decayed during this period (EEA, 2007). Decreased emissions in other Eastern European countries are linked to decreased emission factors, rather than decreased fuel consumption. The share of the high-polluting car fleet built in Eastern Europe de-creased in these areas between 1990 and 2000 as the increase in the stock of vehicles is due to imports of cleaner cars from Western Europe. This development took place 15
also in the Czech Republic, but here the increased share of lower NOx emitting cars only damped the increase in emissions. Albania and The Former Yugoslav Repub-lic of Macedonia increase their emissions due to increased fuel consumption, without an accompanying decrease in emission factors. The 7% decrease in road transport emissions reported by Croatia cannot be explained without assuming a decrease in 20
emission factors, as both GAINS and IEA report increased fuel consumption in the transportation sector in Croatia between 1990 and 2000.
In Western Europe, the introduction of improved vehicle technologies and stringent inspection systems related to the Euro standards has been the primary force in re-ducing NOx road traffic emissions in the period 1990–2000, despite economic growth 25
and increases in fuel consumption. All countries but Portugal, Spain, Greece, Turkey, Cyprus, Malta, Austria, Ireland and Luxembourg reduced their emissions (Fig. 5 lower left map). These nine countries which increased emissions between 1990 and 2000
ACPD
8, 10697–10747, 2008 European road transport control measures V. Vestreng et al. Title Page Abstract Introduction Conclusions References Tables Figures ◭ ◮ ◭ ◮ Back CloseFull Screen / Esc
Printer-friendly Version Interactive Discussion
can be divided in three groups based on the possible causes for the emission growth. The high age of the vehicle fleet combined with increasing number of vehicles may explain the lack of reductions in the first group, containing Portugal, Spain and Greece. In the second group with Turkey, Cyprus and Malta the main reason for emission in-crease is that the Euro standards were not applied at the same time as in the rest 5
of Europe. Increase in emissions reported from Austria, Ireland and Luxembourg are caused by fuel tourism as defined in the previous sections. Austria and Ireland provide road transport emissions both according to fuel sold and fuel used. Their estimates for NOx emissions calculated on the basis of fuel used show a decreasing trend between 1990 and 2000, opposing the data reported as requested by the UNECE Guidelines 10
according to fuel sold. The reason for the increased emission in Austria is a large increase in emissions from heavy duty vehicles (Anderl et al., 2007). In Ireland, the reason is that fuel is less expensive in Ireland than in the United Kingdom during this period. UK fuel prices apply to Northern Ireland, thus drivers tank in Ireland (DEHLG, 2006).
15
4.2.3 2000–2005
In the period 2000–2005, road transport emissions in Europe continue to decrease by 11%, albeit less than in the preceding decade (23%). Fuel consumption in the traffic sector increased in all European countries except in Germany. In Germany high tax on fuel combined with improvements in vehicle technology, result in a considerable 20
decline in diesel consumption as further discussed in Sect. 5. The situation from the 1980s (Fig. 5 upper right map) with decreasing emissions in the east and increased emissions in west is reversed in this period (Fig. 5 lower right map).
Increase in emissions from Eastern Europe follows the increase in fuel consumption (Fig. 5 lower right map). The recovering of the economy is responsible for the emis-25
sion growth, and it is illustrative that loans for transport from the European Bank for Reconstruction and Development to the EECCA countries have mostly financed roads after year 2000. This contrasts with the previous periods when rail and port projects
ACPD
8, 10697–10747, 2008 European road transport control measures V. Vestreng et al. Title Page Abstract Introduction Conclusions References Tables Figures ◭ ◮ ◭ ◮ Back CloseFull Screen / Esc
Printer-friendly Version Interactive Discussion
dominated (EEA, 2007). The EECCA countries have their own car industry, so new western technologies will not necessarily become standard. Another reason why emis-sions in EECCA countries increase may be related to use of lead as an additive to the fuel. Lead additives destroy the catalysts, and are not completely abandoned due both to lack of regulations and to a claimed black market for leaded gasoline. In addition 5
to this, the price of fuel is low and even subsidised in some countries (EEA, 2007). In Belarus, emission decreased between 2000 and 2005. There is no essential produc-tion of cars except for heavy duty vehicles here. Produced lorries comply with Euro 2 and later standards and passenger cars are imported. Import of cars which not comply with certain Euro standards are not directly prohibited, but the older cars are imposed 10
higher tax. The situation with respect to how the introduction of Euro standards has influenced the emission trend is mixed for the EU-10 countries. While Hungary, Latvia, Lithuania and Slovakia report an increase in emissions between 2000 and 2005, due to less effective implementation of the Euro Standards, decrease in emissions are seen in Poland, Czech Republic, Estonia and Slovenia. In addition, Croatia which according 15
to the Belgrade report (EEA, 2007) implemented the Euro standards from year 2000 decreased their emissions.
Contrasting the general increase in Eastern European emissions, the decrease in emission continues in Western Europe between 2000 and 2005. The only countries where emissions increased were Turkey and Austria. In Turkey emissions increased 20
because of lack of abatement measures and Austria due to fuel tourism.
5 Effectiveness of policy regulations in the transport sector
As indicated in Figs. 3 and 4, the European road transport emissions have been de-coupled from the liquid fuel consumption since 1995. This section investigates to what extent the decrease in NOx transport emissions can be associated to the introduction 25
of the Euro standards for both passenger cars and heavy duty vehicles. By convention, these standards are denoted with Arabic numbers for passenger cars and light duty
ACPD
8, 10697–10747, 2008 European road transport control measures V. Vestreng et al. Title Page Abstract Introduction Conclusions References Tables Figures ◭ ◮ ◭ ◮ Back CloseFull Screen / Esc
Printer-friendly Version Interactive Discussion
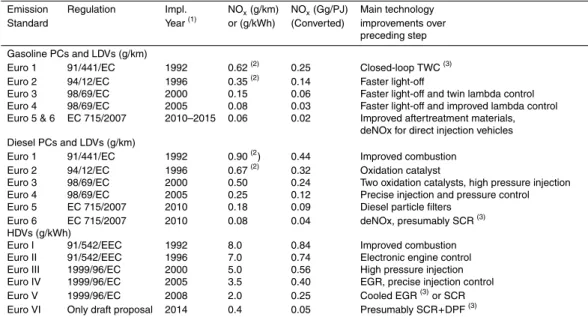
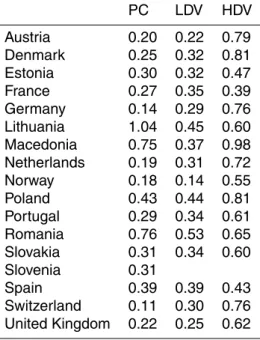
vehicles (e.g. Euro 1, 2, . . . ) and Latin numbers for heavy-duty vehicles (e.g. Euro I, II, . . . ). Table 4 shows the NOxrelevant emission standards per vehicle category and the associated emission control technology in the European Union after 1992. To facilitate comparison with reported implied emission factors, emission standards in PJ/Tg are also included.
5
The analysis here investigates to what extent emission factors calculated on the ba-sis of officially reported road transport emissions and activity data (implied emission factors) comply with the Euro standards. This information is only available from 1990 to 2005 for ten Western European countries (Austria, Denmark, France, Germany, Netherlands, Norway, Portugal, Spain, Switzerland and United Kingdom) and can be 10
retrieved from the EMEP database (http://webdab.emep.int). These ten countries rep-resent more than 50% of total European emission from road transport in 1990, and they are considered to represent the situation in Western Europe. For Eastern Europe, relevant data are available for 2005 for seven countries (Estonia, Lithuania, Macedo-nia, Poland, RomaMacedo-nia, Slovakia and Slovenia). Therefore, a separate analysis has also 15
been undertaken for this particular year.
5.1 Trends in emissions and fuel consumption by country and vehicle class
The fuel types considered here are gasoline and diesel. The reported consumption of hydrogen is negligible and also the reported consumption of compressed natural gas (CNG) and liquefied natural gas (LNG) is very low to affect the trends. In addition, 20
the fuel consumption in mopeds and motorcycles is small compared to other vehicles categories and therefore these have not been considered in the following analysis. It is a limitation to our analysis that the reported emissions do not distinguish between gasoline and diesel use in vehicles. The implied emission factors are thus calculated based on total emissions and fuel consumption for each vehicle class. We argue that 25
our conclusions are robust, albeit we cannot calculate IEFs separately for PCs and LDVs. The reason is that, although the reduction efficiency for NOx in gasoline PC is quite high even for the first generation catalysts, there were relatively few catalysts
ACPD
8, 10697–10747, 2008 European road transport control measures V. Vestreng et al. Title Page Abstract Introduction Conclusions References Tables Figures ◭ ◮ ◭ ◮ Back CloseFull Screen / Esc
Printer-friendly Version Interactive Discussion
installed in 1990. This implies that we can assume emission factors to be higher for gasoline than diesel PC over most of the period 1990 to 2005. Thus our combined IEFs can be considerer lower than the IEFs for gasoline vehicles alone.
In Western Europe, the overall trend in fuel consumption shows that petrol consump-tion decreased (20%), while diesel consumpconsump-tion increased (90%) between 1990 and 5
2005. The shift to diesel is the impact of the European Automobile Manufacturers As-sociation’s commitment on the reduction of CO2emissions from passenger cars (Com-mission Recommendation 1999/125/EC) (ACEA, 2007). This agreement promoted the use of diesel passenger cars because they have up to 30% higher fuel efficiency than gasoline cars of similar size. The net fuel consumption in road transport increased 10
about 23% from 1990 to 2005. Passenger cars consumed by far the largest share of fuel (60%), followed by heavy duty vehicles (28%) and LDVs (12%). The promotion of diesel cars via the ACEA Commitment greatly benefited the curtailment of greenhouse gases. At the same time, it should not be forgotten that diesel passenger cars emit as much as three times higher NOxemissions per kilometre than gasoline cars of the 15
same emission standard. Just to put it into perspective, assuming that the increase in fuel consumption would have originated from increase in petrol rather than diesel consumption (thus diesel consumption remaining at the 1990 levels), this would have led to some 1/3 lower NOxemissions in 2005.
With respect to road transport emissions of NOx, these decreased by 44% between 20
1990 and 2005 in Western Europe, despite the increase in fuel consumption. The emission reductions were largest for PC (63%) followed by HDV (21%) and LDV (2%). Figure 6 compares the trends in total fuel consumption from 1990 to 2005 with indi-vidual trends for gasoline and diesel consumption and with the total NOx emissions for passenger cars in selected Western European countries. NOxPC emissions decrease 25
monotonically while diesel consumption substantially increases (by nearly 200%) and gasoline consumption moderately decreases (by 19%). There is a clear decoupling of emission and fuel consumption of passenger cars already since 1990, as result of the developments in vehicle emission control technologies.
ACPD
8, 10697–10747, 2008 European road transport control measures V. Vestreng et al. Title Page Abstract Introduction Conclusions References Tables Figures ◭ ◮ ◭ ◮ Back CloseFull Screen / Esc
Printer-friendly Version Interactive Discussion
For HDV the situation is more complex. Fuel consumption increased in all countries between 1990 and 2005, except in Germany, where HDV consumption decreased by 30% between 2000 and 2005. This substantial decrease in diesel sold is not likely due to technological developments alone, but also due to the high tax on diesel in Germany. The high fuel prices in Germany prevent transit traffic refuelling, and pro-5
mote fuel tourism to other neighbouring countries. Emissions from HDV between 1990 and 2005 decreased in all countries, except in Spain and Portugal and Austria, where emissions increased, by more than 200% in the case of Austria. Austria is a counter case to Germany, in that some 30% of the diesel sold is consumed outside the country. The onset of emission reduction from HDV comes almost ten years later than the cor-10
responding turning point of passenger cars emission. The main reason for the delay in HDV emission reduction is the inefficiency of Euro II standards in addressing NOx. With regard to LDVs, their fuel consumption increased in all countries. Their emission levels have remained relatively stable compared to the emission trends in PC and HDV, with slight increases or decreases in equally many countries. The above results show 15
that the implementation of Euro standards has contributed to a decoupling of emissions and fuel consumption of all vehicle classes in Western Europe since 1990.
5.2 Trends in implied emission factors
We have derived implied emission factors (IEF) between 1990 and 2005 based directly on reviewed officially reported emissions and total (gasoline plus diesel) fuel consump-20
tion. In this way we can compare the average emission level of the whole fleet in each country, with the emission levels expected when developing the Euro standards. The results for Western Europe are presented in Fig. 7, which shows that the implied emission factors decrease for all vehicle classes from 1990 to 2005. The average IEF reductions for all countries examined in this period are 67%, 42% and 35% for PC, 25
LDV, and HDV respectively. The periods with largest IEF reductions vary with vehi-cle class and country. For PC, the largest IEF reductions (35%) occurred between 1995 and 2000 while max reductions for HDVs (20%) appeared five years later (2000