HAL Id: hal-02358970
https://hal.archives-ouvertes.fr/hal-02358970
Submitted on 12 Nov 2019HAL is a multi-disciplinary open access
archive for the deposit and dissemination of sci-entific research documents, whether they are pub-lished or not. The documents may come from teaching and research institutions in France or abroad, or from public or private research centers.
L’archive ouverte pluridisciplinaire HAL, est destinée au dépôt et à la diffusion de documents scientifiques de niveau recherche, publiés ou non, émanant des établissements d’enseignement et de recherche français ou étrangers, des laboratoires publics ou privés.
Green-aromatic production in typical conditions of
fluidized catalytic cracking
Joana F.R. Pinto, Yiu Lau Lam, Marcelo Maciel Pereira, Hugo Cruchade,
Alexander Sachse, Ludovic Pinard
To cite this version:
Joana F.R. Pinto, Yiu Lau Lam, Marcelo Maciel Pereira, Hugo Cruchade, Alexander Sachse, et al.. Green-aromatic production in typical conditions of fluidized catalytic cracking. Fuel, Elsevier, 2019, 254, pp.115684. �10.1016/j.fuel.2019.115684�. �hal-02358970�
1
Green-aromatic production in typical
1
conditions of fluidized catalytic cracking
2 3
Joana Pintoa, Yiu Lau Lama and Marcelo Maciel Pereiraa*
4
a
Instituto de Química – Universidade Federal do Rio de Janeiro, Rio de 5
Janeiro, RJ, Brazil 6
7
Hugo Cruchadeb, Alexander Sachseb, and Ludovic Pinardb
8
b
Institut de Chimie des Milieux et Matériaux de Poitiers (ICM2P), UMR 7285 9
CNRS, 4 Rue Michel Brunet, Bâtiment B27, 86073 Poitiers Cedex – France. 10 11 * [email protected] 12 13 Abstract 14
The production of green hydrocarbons in the standard refinery has significant 15
potential to reduce our reliance on oil and shorten the path to sustainability. 16
Second-generation biomass can help to achieve this objective yet presents 17
important drawbacks. It is majorly composed of reactive compounds and features 18
low density. These features could be overcome by previously transforming the 19
biomass by ketalization reaction into a bio-crude mainly composed by ketal-sugar 20
derivatives. In this work, a representative compound of the bio-crude class, i.e. 21
1,2:3,5-di-O-isopropylidene-α-d-xylofuranose (DX) were used in up to 50 wt.% 22
mixtures in n-hexane was converted in a laboratory scale fluidized catalytic 23
cracking (FCC) reactor. A commercial and a simplified FCC catalyst were used. 24
2 Converting a mixture of 30% DX in n-hexane in the presence of a commercial 25
catalyst gave 42.3% aromatics in the liquid product, while pure n-hexane gave 26
merely 8.9%. The use of deactivated catalysts further reduced the coke yield to 27
half of the fresh one. The nature of the coke on the spent catalyst is exclusively 28
composed by carbon and hydrogen, demonstrating that DX is easily deoxygenated. 29
The n-hexane conversion slight reduced in the presence of DX, and did not reduce 30
the stability of the catalyst through micropore blocking. This work demonstrates 31
that adding DX allows to contributes to high bio-aromatic production in FCC and 32
that products distribution is remarkably affected by the type of catalyst used. 33
34
Keywords: Bio-aromatics; Bio-gasoline; FCC; Biomass; Bio-refinery.
35 36
1 – Introduction 37
The green hydrocarbon production in the standard refinery offers great 38
advantages over current alternative approaches to shorten our path to 39
sustainability. Firstly, hydrocarbons have one of the highest combustion enthalpies 40
per volume[1], the higher energy density is a key advantage to reduce 41
transportation costs. Secondly, no new or modifications of legislation are 42
necessary. Thirdly, a giant production and distribution structure of oil industry is 43
available. Finally, besides the great potential to reduce the carbon emission, the 44
possibility to introduce bio-feeds in the refinery may add a stabilizing factor for 45
the oil industry. 46
There are three main strategies adopted to convert second generation 47
biomass into fuel: organic reaction combined with aqueous phase transformation 48
[2, 3], gasification to CO and H2 followed by the Fischer-Tropsch process [4, 5]
3 and thermo-conversion comprising bio-oil production and its transformation in the 50
refinery [6-8]. The first strategy requires a new production structure which is not 51
compatible with existing refineries. The second needs high temperature during 52
gasification [9] and high energetic inputs to revert the entropy involved in the gas 53
formation[5], therefore hindering the application to produce conventional fuel. 54
Nevertheless, it should be pointed out that these two approaches could be used to 55
produce valuable products. The third has several drawbacks, since typical bio-oil 56
contains highly acidic and undesirable products (poly-aromatic and phenol-57
derivative compounds) that require the addition of significant amounts of 58
hydrogen before their use in standard refineries [7, 10]. This limits the amount of 59
bio-oil to only 5 wt.% in the co-process with gasoil in FCC [11]. Consequently, 60
the economic considerations hinderthe application of green hydrocarbons as 61
refinery feedstock. One further option is the co-process of ethanol and bio-oil 62
derivatives [12, 13], however, ethanol itself is a fuel already. 63
An alternative route that can potentially overcome the above limitations is 64
the transformation of biomass into a bio-crude by ketalization reaction (using the 65
idea of protective reaction from organic chemistry) [14] followed by catalytic 66
conversion either in a FCC or a hydro conversion unit in fixed-bed 67
reactors.[15] The proposed bio-crude is composed of ketal-sugar derivatives like 68
1,2:3,5-di-O-isopropylidene-α-d-xylofuranose (DX), 1,2-O-isopropylidene-α-D-69
xylofuranose, 1,2:5,6-di-O--D-Isopropylideneglucofuranose,
1,2:3,5-Di-O-70
isopropylidene-α-D-xylofuranose and more complex ketal-derivative compounds 71
[16]. Recently this idea to produce such a bio-crude allowed to avoid degradation 72
of carbohydrates during the depolymerisation reaction of wood, however the 73
authors did not realize the potential of this approach to provide an appropriate feed 74
4 that could be converted in the regular refineries[17]. Our vision of circular 75
economy is presented in figure 1: 76
77
Figure 1: Circular economy for converting second generation biomass into 78
green-hydrocarbons. Sugarcane bagasse, the residue of ethanol and sugar industry, 79
is used as second generation biomass. Emphasis on DX conversion in fluidized 80
catalytic cracking. Firstly, biomass is converted under mild conditions into a bio-81
crude composed mainly of sugar ketals, among them DX which is a representative 82
compound. The FCC process transforms mixtures of DX in n-hexane (up to 83
50wt.% DX) at 500 ºC in the presence of a commercial catalyst based on faujasite 84
into green mono-aromatics that can be directly used as petrochemicals or mixed 85
with regular fuels like gasoline or jet-fuel. 86
The catalytic cracking of n-hexane is widely used to characterize acid 87
catalysts [18-21] as this linear molecule shows accessibility to medium or even 88
small pores and its conversion requires strong acid sites. The activation of weak σ 89
carbon-carbon and carbon-hydrogen bonds in hydrocarbons was demonstrated 90
under superacidic conditions 21. The extent of the n-hexane reaction rate for the 91
given amount of tetrahedral aluminium in the zeolites can be explained by the 92
Haag’s hypothesis of protolytic cracking 22
. 93
In this work, DX, a representative compound of bio-crude, was mixed with 94
up to 50 wt.% in n-hexane. These feeds were converted in a laboratory fluidized 95
catalytic reactor under conditions similar to typical FCC processes, in the presence 96
of a commercial and a simplified catalyst, both used and fresh. The simplified 97
catalyst was also deactivated by hydrothermal treatment. The tests were compared 98
with studies conducted under similar conditions with pristine n-hexane. 99
5 100 2 – Experimental 101 Preparation of 1,2:3,5-di-O-isopropilidene-β-D-xylofuranose (DX). A 102
suspension of the respective anhydrous xylose, (10g) in acetone (volume) 103
was stirred vigorously under ice bath. Sulfuric acid (98%, 0.4 mL) was added 104
in three portions at 5 min intervals, while the temperature was kept at 5-10 105
°C. After the addition of the sulfuric acid, the vigorous stirring was continued 106
for 5 h, allowing the temperature to rise up gradually to 20-25 °C. The 107
solution was cooled again (under ice bath) and neutralized with 50% sodium 108
hydroxide solution under stirring. The addition was made slowly to avoid 109
heating. A small amount of sodium hydrogen carbonate was added to 110
maintain the solution near neutrality. The salts were removed by filtration 111
and the acetone solution was concentrated under reduced pressure. The DX 112
was extracted in n-hexane and crystalized after evaporation of n-hexane. 113
114
Nitrogen physisorption was carried out at 77 K on a Micromeritics ASAP 2420 115
apparatus. Prior to analysis, the samples were pretreated at 573 K under vacuum 116
for 15 h. Coked samples were outgassed at 423 K for 1 h to avoid coke 117
elimination. The micropore volumes (Vmicro) were calculated using the t-plot
118
method. The pore size distributions were determined using the density functional 119
theory (DFT) model applied on the adsorption branch. The total pore volume was 120
calculated at p/p0 = 0.9. The mesopore volume (Vmeso) was determined by the
121
difference between the total pore volume and the micropore volume. 122
6 X-ray Diffraction (XRD) was performed using a Rigaku Ultima IV 123
diffractometer (Cu Kα λ =0.1542 nm) at a scanning rate of 0.02o s-1 in 2 θ ranges
124
from 5 to 80o. A fixed power source was used (40 kV, 20 mA). 125
Fourier transform Infrared spectra (FT-IR) of pyridine adsorbed samples were 126
recorded on a Nicolet Magna 550-FT-IR spectrometer with a 2 cm−1 optical 127
resolution. The zeolites were first pressed into self-supporting wafers (diameter: 128
1.6 cm, ≈ 20 mg) and pretreated from room temperature to 723 K (heating rate of 129
1.5 K min-1 for 5 h under a pressure of 1.33 10−4 Pa) in an IR cell connected to a 130
vacuum line (samples with coke were outgassed at 363 K for 1 h and 423 K for 1 h 131
and these conditions were used to minimize degradation and elimination of 132
molecules presented in the coke, thus close to the coke formed in situ in the spent 133
catalyst). Pyridine adsorption was carried out at 423 K. After establishing a 134
pressure of 133 Pa at equilibrium, the cell was evacuated at 623 K to remove all 135
physisorbed species. The amounts of pyridine adsorbed on the Brønsted and Lewis 136
sites were determined by integrating the band areas at 1545 cm-1 and 1454 cm−1 137
respectively and using the following extinction coefficients measured at 293 K: 138
1545 = 1.13 and 1454 = 1.28 cm mol−1 [22].
139
The fluidize catalytic cracking unit used to convert the new bio-feed in this 140
study is presented in Figure S1 [23]. The tests were carried out by using 10 mL of 141
feed (pristine n-hexane and mixtures of DX up to 50 wt.% in n-hexane) injected 142
over 1 min, and 20 g of the catalyst was used in the catalytic bed. Before the 143
reaction, the catalyst was activated in a nitrogen atmosphere for 12 hours at 773 K. 144
Nitrogen flow was calibrated at room temperature, and nitrogen flow at 200 ml 145
min-1 (estimated at 773K using the state equation of ideal gas) was used to fluidize 146
the catalyst. The reactor was operated in between 693-773 K considering the 147
7 height of the fluidized catalytic bed (Figure S2). Cat-A is a fresh commercial FCC 148
catalyst supplied for this work by Petrobras, and was used with particle diameter 149
115 - 200 mesh equivalent to a particle size diameter of 0.125-0.08 mm 150
respectively, but the composition is unknown. Also, a model FCC catalyst (Cat-B) 151
with the following composition: USY, SiO2, Al2O3 and Kaolin of 40, 20, 25 and 15
152
wt.% respectively was used 25. For both catalysts, the catalytic results of DX and 153
n-hexane mixtures were analysed and discussed by comparing with those observed 154
in pristine n-hexane experiment. 155
The products from the cracking reactions were analyzed off-line. The 156
liquid fraction was analyzed by both GCMS and CGFID. The GCMS system is an 157
Agilent Technologies 7890A CG coupled to a 5975C MS in electron impact mode, 158
an Agilent HP-5MS column was used and the oven temperature kept at 303 K for 159
7 min followed by a ramp to 443 K for 40 min, helium was used as carrier gas. At 160
the inlet, a split ratio of 20:1, 14 psi pressure and 563 K was used. All samples 161
were injected without dilution. 162
The n-hexane amount in the liquid fraction was quantified using the 163
GCMS, n-hexadecane was used as an internal standard, the calibration profile is 164
presented in Figure S3. This procedure was used to determine the n-hexane 165
conversion. The liquid products were obtained by subtracting the liquid mass by 166
the mass of non reacted n-hexane and according to the material balance adjusted as 167
presented in Table S1. The proportions of aromatic and non-aromatic yields were 168
determined by chromatography (the chromatographic factors used for aromatics 169
were presented in Table S2 and for non-aromatics the same as that of n-hexane). 170
The amount of gas produced during the reaction was determined by the 171
difference of water displaced during the reaction and the one in a pure nitrogen 172
8 flow (always quantified before reaction). The gas composition was determined by 173
taking a sample of the gas inside the water Erlenmeyer as presented in Figure S1 174
and the analyses were repeated three times. Saturated salt water was used to 175
prevent gas solubilisation. The gas composition (H2, CO, CO2 methane and 176
hydrocarbon up to C4) was analysed using an Agilent Technologies MicroGC 490. 177
The amount of coke in the spent catalysts was determined through 178
thermogravimetric analysis (Netzsch TG-IRIS). The samples were heated from 179
308 to 523 K at a rate of 10 °C min-1 under N2 atmosphere. The temperature was
180
kept at 523 K for 30 min, after which the atmosphere was changed to synthetic air 181
(20.9% O2 in N2) and the temperature increased to 973 K at a rate 10 K min-1 and
182
then maintained at 973 K for 30 min. The amount of coke in the catalyst 183
corresponded to the weight loss at temperatures higher than 523 K and the coke 184
yield was estimated comparing this value (considering the amount of catalyst in 185
each reaction) to the total feed introduced into the reactor. 186
The chemical composition of coke was determined using the established 187
methodology detailed in ref [26]. In order to release the molecules trapped in the 188
zeolite pores, the zeolite framework was mineralized at room temperature with a 189
51% aqueous hydrofluoric acid (HF) solution. The coke molecules soluble in 190
methylene chloride were subsequently analyzed by GC-MS (Thermo Electron 191
DSQ with a DB5ms column). To determine the relative amount of gas and liquid 192
products and coke, the above mentioned amounts determined were summed up 193 and considered as 100% 194 195 196 197
9 198
3 – Results and Discussion 199
200
Catalyst characterization
201
The textural and the acidic properties, of the commercial (Cat-A) and a 202
simplified FCC catalyst [24] (Cat-B) are reported in Table 1. Both catalysts present
203
very similar silica and alumina composition, and their diffraction patterns feature 204
characteristic peaks corresponding to FAU zeolite and kaolinite (12 and 25° 2) 205
diffraction planes (Figure S4). 206
The nitrogen adsorption and desorption isotherms at 77 K, Figure 1, of 207
Cat-A and Cat-B exhibit the typical shape expected for microporous materials 208
(type I isotherm), with an important nitrogen uptake at low relative pressure (< 209
0.15) followed by a plateau (0.15-0.90). At relative pressures close to saturation, 210
the isotherms feature an upward turn ascribable to nitrogen condensation within 211
secondary porosity due to the previous steaming of the Y zeolite to achieve USY. 212
Isotherms of both catalysts feature a H4 hysteresis loop at a relative pressure close 213
to 0.45, which is typical of steamed Y zeolite and indicates the presence of some 214
constricted and occulted mesopores in which desorption occurs through 215
cavitataion. The micropore volumes were calculated by Harkins-Jura t-plot and 216
amount to 0.13 cm3 g-1 for both catalysts. Considering that a typical FAU structure 217
features ~ 0.3 cm3 g-1 of microporous volume, it is possible to estimate that Cat-A 218
and Cat-B are composed of approximately 40 wt.% of the crystalline zeolite phase. 219
Hence, the commercial and simplified FCC catalysts feature similar textural 220
properties. 221
10 223
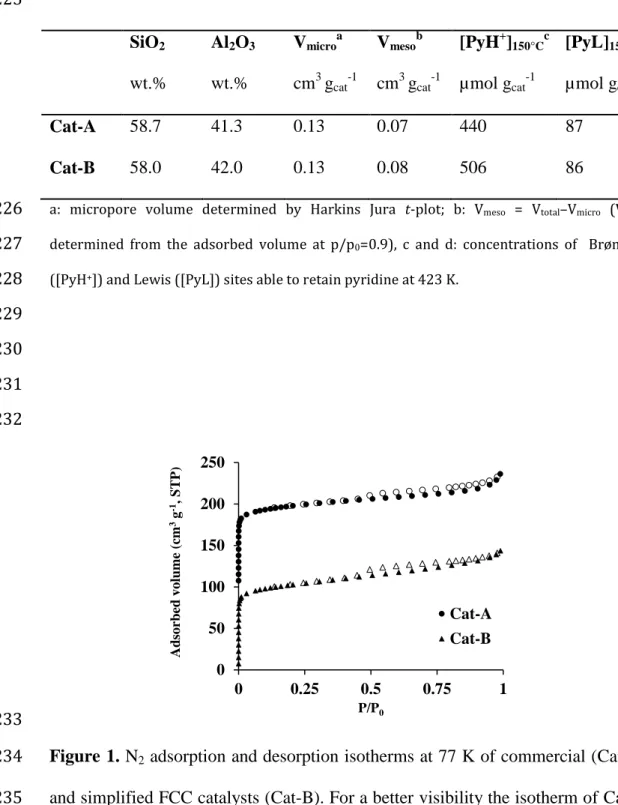
Table 1: Selected textural and acidic properties of Cat-A and Cat-B. 224 225 SiO2 wt.% Al2O3 wt.% Vmicroa cm3 gcat-1 Vmesob cm3 gcat-1 [PyH+]150°Cc µmol gcat-1 [PyL]150°Cd µmol gcat-1 Cat-A 58.7 41.3 0.13 0.07 440 87 Cat-B 58.0 42.0 0.13 0.08 506 86
a: micropore volume determined by Harkins Jura t-plot; b: Vmeso = Vtotal–Vmicro (Vtotal:
226
determined from the adsorbed volume at p/p0=0.9), c and d: concentrations of Brønsted
227
([PyH+]) and Lewis ([PyL]) sites able to retain pyridine at 423 K.
228 229 230 231 232 233
Figure 1. N2 adsorption and desorption isotherms at 77 K of commercial (Cat-A)
234
and simplified FCC catalysts (Cat-B). For a better visibility the isotherm of Cat-A 235
was shifted by + 100 cm3 g-1 along the Y axis. 236 237 0 50 100 150 200 250 0 0.25 0.5 0.75 1 Ad sorbed vol ume ( cm 3g -1, ST P) P/P0 Cat-A Cat-B
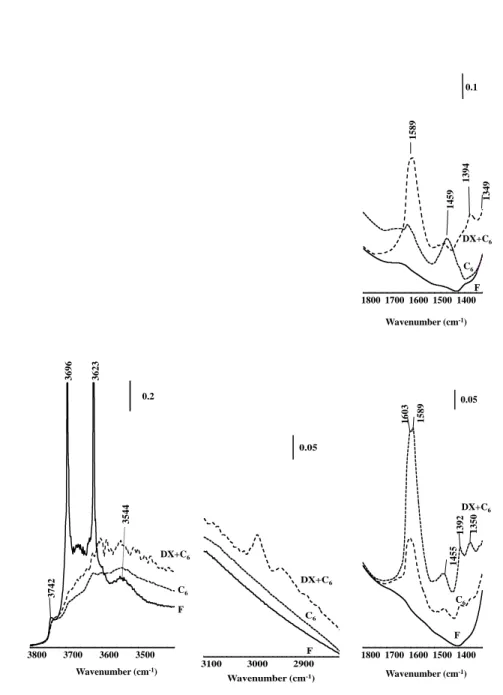
11 FTIR spectroscopy was used to gather insights on the hydroxyl groups 238
located on the catalyst surface. The IR spectra of Cat-A and Cat-B are presented in 239
Figure 2. The ν(OH) region shows two narrow and intense bands centered at 3696
240
and 3623 cm-1, which can be ascribed to kaolinite with an ordered structure.27 A 241
band of less intensity at 3743 cm-1 can be assigned to isolated external silanols, 242
and two bands at 3660-3640 cm-1 and 3537-3544 cm-1 can be related to bridging
243
OH in supercages and hexagonal prisms, respectively (Figure 2). For FAU, all 244
bridging OH groups, even those within the sodalite cages, interact with pyridine. A 245
small portion of silanol is strong enough to retain pyridine. On the commercial 246
catalyst (Cat-A), the employed binder features no acidic properties whereas on the 247
simplified FCC catalyst (Cat-B), some OH of the kaolinite are able to interact with 248
the organic base (Figure S4). The concentration of the Brønsted acid sites (BAS), 249
is slightly lower on Cat-A (440 µmol g-1) than on Cat-B (506 µmol g-1). The 250
concentrations of Lewis acid sites are similar on both catalysts (ca 86-87 µmol g -251
1
). Thus, Cat-B should be more active in cracking reactions compared to Cat-A. It 252
is difficult to deduce the framework Si/Al ratio, as the amount of residual Na and 253
other factors may lead to a misleading estimation. 254 Cat-A 3537 3623 3696 3743 3500 3600 3700 3800 0.1 Wavenumber (cm-1) DX+C6 C6 F 2900 3000 3100 Wavenumber (cm-1) 0.1 F C6 DX+C6
12 Cat-B
255
Figure 2. Evolution of bands in regions 3800-3400 cm-1, 3100- 2700 cm-1 and 256
1800-1300 cm-1 on commercial (Cat-A) and simplified (Cat-B) FCC catalysts. F:
257
fresh, DX+n-C6 and n-C6: spent catalysts.
258 259 260 261 262 C6 1349 1394 1459 1589 1400 1500 1600 1700 1800 Wavenumber (cm-1) 0.1 F DX+C6 C6 3544 3623 3696 3742 3500 3600 3700 3800 Wavenumber (cm-1) 0.2 DX+C6 C6 F F 2900 3000 3100 Wavenumber (cm-1) 0.05 DX+C6 C6 1350 1392 1455 1589 1603 1400 1500 1600 1700 1800 Wavenumber (cm-1) 0.05 F C6 DX+C6
13 Product distribution and Material balance.
263
The material balance was checked by adding the masses of coke, liquid, 264
and gas fractions produced during the reaction with the mass of the feed. All tests 265
showed material balance around 100% (a range of 96-112 was observed) as 266
presented in Table 2 and the error in the individual fractions vary approximately 267
10% (Table S3). For each test, three samples of the spent catalyst were analysed to 268
determine the amount of coke formed, and no differences were observed. 269
270 271
Table 2. Products of transformation of DX and n-hexane mixtures: gas, liquid and 272
coke in wt.% in relation to feed and coke amount on the spent catalyst in wt.% of 273
the catalyst. 274
275
Feed (g) DX% Gas Liquid Coke Total Coke% in cat.
Cat-A 6.55 0 (n-C6) 25 75 11 111 3.4 6.78 10 20 76 16 112 5.2 7.29 30 23 63 16 102 5.9 7.79 50 26 49 22 97 8.0 Cat-B 6.55 0 (n-C6) 42 43 11 96 3.4 7.29 30 39 39 15 96 5.3 Cat-B-DH 6.55 0 (n-C6) 14 79 1 94 0.4 7.29 30 9 81 8 98 2.8 276
Liquid fraction. The liquid phase was the main fraction obtained by converting 277
pure n-hexane and n-hexane/DX mixtures in the presence of Cat-A. In contrast, 278
14 Cat-B favours the gas fraction and both gas and liquid fractions showed 279
comparable values. Higher gas fraction is related to higher catalytic activity as 280
expected based on the catalysts properties presented in Table 1. With the 281
introduction of 10% of DX in the presence of Cat-A, no effect was observed in the 282
liquid yield and the gas yield slightly decreased. Further increase in DX 283
concentration to 30% slightly reduced liquid yield. Merely for the 50wt.% DX 284
mixture a significant decrease in the liquid yield and increase in the coke yield 285
occurred. The conversion of 30% of DX and n-hexane in the presence of Cat-B 286
(that is more active than Cat-A) showed minor differences in both gas and liquid 287
yields when compared with pristine n-hexane. The Cat-B-DH deactivated showed 288
50% reduction in coke yield, lower gas and higher liquid compared to the fresh 289
Cat-B. By comparing these results it is clear that the catalyst controls the product 290
yield distribution and suggests that further improvement in ketal sugar-derivative 291
conversion is expected by diligent catalyst design. The FCC catalyst plays a 292
central role in hydrocarbon conversion [25, 26] and likewise for the DX 293
conversion. 294
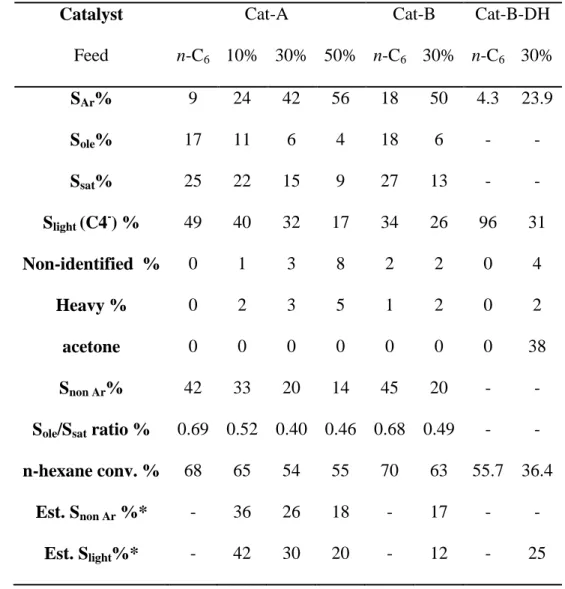
The liquid fraction is separated into six main classes as presented in Table 295
3. Detailed quantitative results of selectivity are presented in Tables-S4 to -S7 and 296
an example of a chromatogram is presented in Figure S5. The products that were 297
identified were categorised in their respective classes. A very small amount of the 298
products that could not be assigned was included in the non-identified product 299
fraction. Practically no oxygenated compounds were identified in the liquid 300
fraction in any of the tests of fresh catalyst summarized in Table 2. The 50% DX 301
in n-hexane mixture showed the highest number of non-identified products. Heavy 302
compounds were barely observed in all tests in the presence of Cat-A and not 303
15 detected in the presence of Cat-B. For Cat-B-DH large amounts of acetone were 304 produced. 305 306 307 308
16 309
Table 3: Liquid products obtained from the conversion of pure n-hexane 310
and mixtures with 10, 30 and 50 wt.% DX. Products (in wt.% of the liquid phase) 311
in the liquid phase are separated by class SAr (aromatic compounds), Sole (olefin
312
containing five or more carbons), Ssat (paraffins containing five or more carbons),
313
Slight (compounds containing four or less carbons), non-identified (products not
314
identified and oxygenates), Heavy (poly-aromatic), and Snon Ar (Sole + Ssat).
315 316
Catalyst Cat-A Cat-B Cat-B-DH
Feed n-C6 10% 30% 50% n-C6 30% n-C6 30% SAr% 9 24 42 56 18 50 4.3 23.9 Sole% 17 11 6 4 18 6 - - Ssat% 25 22 15 9 27 13 - - Slight (C4-) % 49 40 32 17 34 26 96 31 Non-identified % 0 1 3 8 2 2 0 4 Heavy % 0 2 3 5 1 2 0 2 acetone 0 0 0 0 0 0 0 38 Snon Ar% 42 33 20 14 45 20 - -
Sole/Ssat ratio % 0.69 0.52 0.40 0.46 0.68 0.49 - -
n-hexane conv. % 68 65 54 55 70 63 55.7 36.4
Est. Snon Ar %* - 36 26 18 - 17 - -
Est. Slight%* - 42 30 20 - 12 - 25
317
* Both Est. Snon Ar and Est. Slight% were estimated assuming that these classes were produced
318
exclusively by n-hexane (the estimate was obtained removing non converted n-hexane in the liquid
319
phase, multiplied by the selectivity of its transformation in pristine form).
17 321
DX was fully converted in all tests and n-hexane conversion slightly 322
decreased in DX mixtures in the presence of fresh catalysts. Also the mixture of 323
30wt% DX in n-hexane showed lower conversion decrease in the presence of Cat-324
B compared to Cat-A. 325
The aromatic compounds are mainly alkyl-mono-aromatics such as 326
toluene, xylene up to three and four alkyl carbons (detail distribution is presented 327
in Tables-S4 to S7). The conversion of n-hexane in the presence of A and Cat-328
B afforded 9% and 18% of aromatics, respectively. It can be rationalized that the 329
superior acidity of Cat-B favours sequential reactions to aromatic compounds. 330
Likewise, Cat-B shows excessive cracking to light hydrocarbons increasing the 331
gas yield (as presented in Table 2). 332
As a result of the introduction of 10% of DX in n-hexane, the aromatic 333
content remarkably increased (3-fold) compared to pristine n-hexane. The 334
aromatic content increased almost linearly with the DX concentration (Figure 3-a). 335
Cat-B showed higher contents of aromatic compounds for both pristine n-hexane 336
and 30% DX in n-hexane in comparison to Cat-A. The non-aromatic fraction 337
(Figure 3-a) is composed of olefins and paraffins. Previous results, using labeled 338
DX in xylofuranose carbons, showed the absence of labeled carbon in paraffins 339
and olefins. Thus these compounds were almost exclusively derived from n-340
hexane conversion[15]. Yet, the contribution of isopropylidene groups cannot be 341
ruled out. 342
To support the consideration of the origin of the non-aromatics, values for 343
the non-aromatic fraction, presented in Table 3, were estimated based on the 344
following two assumptions: 1 – it is exclusively produced by n-hexane; 2 – the 345
18 yield was determined (as explained in the experimental section) and the selectivity 346
of n-hexane conversion was not affected by the presence of DX. The estimated 347
contribution of n-hexane and the measured values are similar for both catalysts, 348
which supports the conclusion that these products are mainly related to the n-349
hexane conversion as previously noted[14]. 350
351
352
19 354
Figure 3: (a) selectivity of total aromatics and non-aromatics as wt.% of 355
the liquid products for converted mixtures of DX in hexane and pristine n-356
hexane in the presence of Cat-A and Cat-B. (b) Aromatic selectivity as wt.% of 357
each products of the total liquid products obtained by pristine n-hexane and 358
mixture with 30% DX in the presence of Cat-A, Cat-B and Cat-B-DH. (c) 359
Aromatic selectivity as wt.% of each product type of the total liquid products in 360
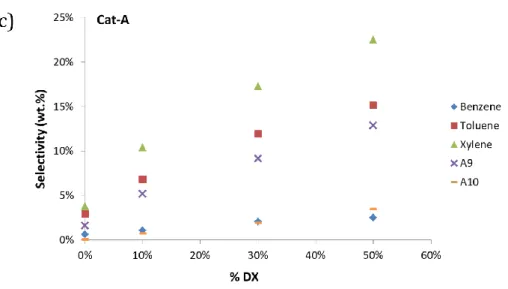
function of DX concentration in the presence of Cat-A. 361
362
The distribution of aromatic compounds obtained in n-hexane and 30wt.% 363
DX in n-hexane are presented in figure 3-b. This distribution was slightly affected 364
by the type of catalyst, for instance toluene selectivity was favoured in the 365
presence of Cat-B, while mono aromatics containing C9 were favoured in the 366
presence of Cat-A. For the same catalyst (Cat-A), an increase of DX in the mixture 367
increased the aromatics but the relative amount of benzene, toluene and xylenes 368
was maintained, while alkyl-aromatic containing nine carbons and more were 369
slightly affected as presented in figure 3-C. This complex variation of the catalysts 370
20 on the type of aromatic cannot be clarified under high conversion regime and will 371
be further explored in later works. 372
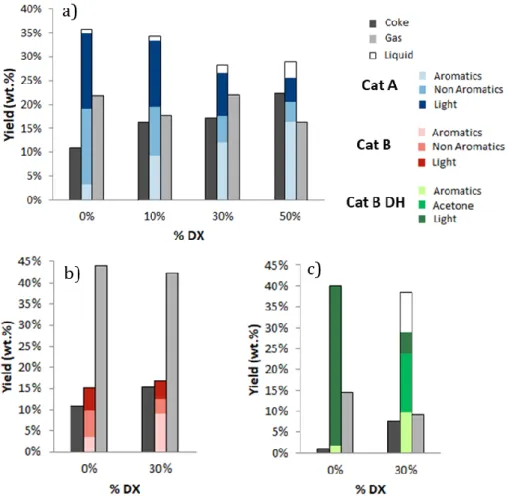
The yields (in wt.% of total feed) of coke, aromatic, non-aromatic and gas 373
in the presence of Cat-A are presented in figure 4-a. Mono-aromatic yield 374
continually increased with an increase of DX concentration while non-aromatic 375
and gas yields decreased. Particularly, the higher decrease in liquid fraction 376
observed for the 50%DX mixture was compensated by the higher aromatic 377
selectivity. Gas yield did not follow a tendency and coke yield increased which is 378
discussed in the section devoted to coke formation. The conversion in the presence 379
of Cat-B showed high yield of gas. In contrast, gas and coke yields remarkably 380
decreased in the presence of Cat-B-DH. Both Cat-B and Cat-B-DH showed similar 381
aromatic yield. The remarkable effect of the catalyst on the product distribution 382
constitutes a major advance and suggest that advanced catalyst development is a 383
promising solution to further increase the aromatic yields. 384
21 385
Figure 4: Yield (wt.% of total products) of coke, aromatics, non-aromatics and 386
gas in the presence of Cat-A (a), Cat-B (b) and Cat-B-DH (c). 387
388
The remaining products in the liquid phase are solely related to light 389
compounds (Slight). It is worth to mentionthat it is difficult to precisely determine
390
the amount of light products as they are partially distributed in both the liquid and 391
gas phase. The light products can be further solubilized in the aqueous NaCl 392
phase, in the apparatus for the gas displacement measurement. An estimated 393
contribution of n-hexane to the formation of light products, similar to the one 394
made for the non-aromatics, resulted in very similar values to those measured for 395
each test in the presence of Cat-A, but different values in the presence of Cat-B. 396
The olefin/saturated ratio (Sole/Ssat) presented in Table 3 decreased in the
397
mixture of 10%DX in the presence of Cat-A, and further reduced in the 30% 398
22 DX/n-hexane in the presence of Cat-A compared to pristine n-hexane. Further 399
increase to 50%DX did not lead to changes in conversion, yet Sole/Ssat ratio
400
increased. In the presence of Cat-B this ratio also reduced in the presence of DX 401
compared with pristine n-hexane. This complex variation of (Sole/Ssat) may not
402
only be due to the influences of DX on the conversion of n-hexane but further on 403
the reaction path of n-hexane. This will be further explored by refining the product 404
analysis in later works. 405
406
Gas fraction. The gas composition contains hydrocarbons of up to four carbons, 407
hydrogen, CO and CO2 as presented in Table 4. The CO and CO2 ratio is similar
408
for all tests. CO2 and CO could be dissolved in the apparatus for the gas
409
measurement and the uncertainties in the experimental setup limits specific 410
conclusions on the evolution of deoxygenation from DX. Likewise, material 411
balance regarding oxygen cannot be provided so far. Similarly, the experimental 412
set up (that does not avoid entirely the condensation of light hydrocarbons at 258 413
K) may cause uncertainties in the quantification of heavier compounds in the gas 414
phase. Gas phase products of pristine n-hexane are comparable to results observed 415
in the literature [27, 28], mainly C3 and C4 products are formed followed by
416
ethylene and ethane and a small amount of methane and hydrogen. The last two 417
are related to the protolysis of the σ carbon(primary)-carbon and carbon-hydrogen 418
bonds of n-hexane respectively by the zeolite acid sites [29]. Methane selectivity 419
progressively increased by increasing the DX concentration in the presence of Cat-420
A and was not affected in the presence of Cat-B. Both ethylene and propylene also 421
slightly increased, in contrast, both propane and butane concentrations decreased 422
with increasing DX concentration. 423
23 Among all products, the most notable is that the propane selectivity 424
reduced in the presence of DX. The combined effect on olefin and propane 425
resulted in a remarkable increase in the ratio of olefin/paraffin from pristine n-426
hexane to 50%DX/n-hexane mixture as presented in table 4. To reduce the 427
influence of n-hexane conversion on propane selectivity only tests with similar 428
conversion were compared in the following discussion. The n-hexane conversion 429
slightly decreased comparing pure n-hexane with 10%DX, yet propane selectivity 430
decreased from 61 to 53. The mixtures of 30 and 50% DX in n-hexane showed the 431
same n-hexane conversion and even a higher decreased was observed in propane 432
selectivity. Cat-B showed similar results. As propane is mainly produced by n-433
hexane, the obtained results indicate that DX affects the n-hexane conversion path. 434
435
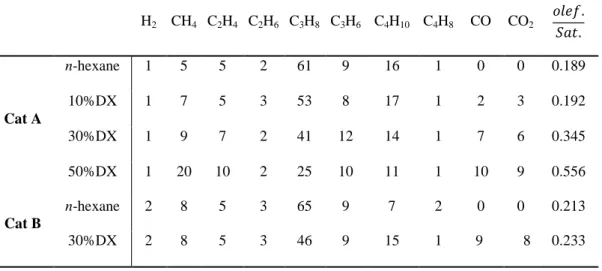
Table 4: Gas composition of DX and n-hexane experiments for Cat-A and Cat-B. 436 Gas (%molar) H2 CH4 C2H4 C2H6 C3H8 C3H6 C4H10 C4H8 CO CO2 Cat A n-hexane 1 5 5 2 61 9 16 1 0 0 0.189 10%DX 1 7 5 3 53 8 17 1 2 3 0.192 30%DX 1 9 7 2 41 12 14 1 7 6 0.345 50%DX 1 20 10 2 25 10 11 1 10 9 0.556 Cat B n-hexane 2 8 5 3 65 9 7 2 0 0 0.213 30%DX 2 8 5 3 46 9 15 1 9 8 0.233 437 438
Coke fraction. As shown in Figure 4c and Table 2, the coke yield ranges from 10 439
to 20% for fresh catalysts and reduces considerably to less than 10% for the 440
deactivated catalyst. Coke yield increased with the increase in DX in the feed 441
24 mixture. However, the increase in coke on catalysts for a 30%DX mixture 442
compared to pure n-hexane was only 2.5 wt% or less. A commercial FCC unit 443
operates in the temperature range of 773-808 K and the reaction occurs within 444
short contact times, i.e., 3 to 7 seconds [30, 31]. In general, a spent FCC catalyst 445
exhibits 1wt.% of coke on the catalyst. This represents an amount of 5-10 (wt.%) 446
of the feed being converted into coke for a catalyst/feed ratio (in wt.) in the range 447
of 5 to 10. In our experiments, the catalyst/feed ratio was three times lower and the 448
contact time was 60 seconds. These condition are regularly applied in laboratory 449
fluidized units[32, 33] and responsible for the large amount of coke formation 450
when compared to real FCC units. Hence, the coke yield for fresh catalyst in 451
laboratory units should be compared only with test effectuated under same 452
conditions. 453
Preliminary results of deactivation were obtained in the Cat-B-DH that 454
indicated a reduction of 50% of the coke yield. However, high amount of acetone 455
was observed. Hence, the deactivation treatment and test condition should be 456
improved. 457
On the commercial and synthesized FCC catalyst, the coke content 458
increases proportionally with the weight percent of DX in n-hexane (Figure 4a). 459
Indeed, many studies have shown that the co-feeding strategy of oxygenates such 460
as phenol[34, 35], m-cresol[36] and bio-oil[37]with hydrocarbons increases the 461
coke yield, which is ascribable to the strong adsorption of oxygenated molecules 462
on zeolite acid sites. The FCC units are designed to handle coke on the catalyst to 463
a certain extent. Yet excessive coke formation, as observed during the processing 464
of oxygenated feeds[38], could limit the amount or even hinder the co-processing 465
of renewable feeds. The relative small amount of coke using fresh catalyst and the 466
25 decrease using deactivated catalyst to convert a model feed containing a high 467
concentration of DX is a very encouraging result. 468
Infrared spectra of spent catalysts obtained through different feed 469
composition (n-C6 and 30% DX/n-C-6) are presented in Figure 2. The bands of
470
carbonaceous compounds deposited on zeolites were observed in two domains. In 471
the region of 2700-3100 cm-1 corresponding to the CH stretching modes of 472
aromatic and paraffinic groups, and 1300-1700 cm-1 ascribable to CC stretching 473
modes of unsaturated (olefin, polyenyl, aromatic and polyaromatic) groups and 474
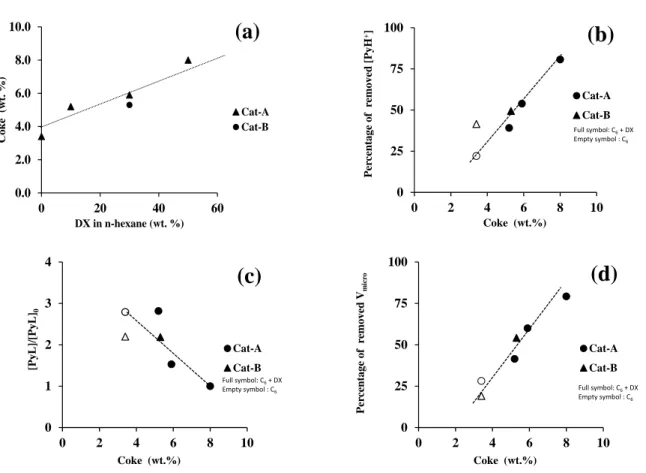
CH bending of paraffinic groups (Figure 2). The band at 1459 cm-1 can be 475
attributed to coke precursor molecules with a limited number of aromatic rings 476
(NAR) to 2 and 3 [39]. The bands at 1603, 1589, 1392 and 1350 cm-1 are related to
477
polyaromatic coke (NAR 4)[40]. On all spent catalysts, the absence of CH
478
stretching modes, as their low intensity for the spent Cat-B after n-C6 conversion,
479
indicates a low degree of alkylation of the coke molecules. In the presence of DX 480
in the feed, the intensity of the bands of the polyaromatic compounds were more 481
intense, which indicates a coke formation with higher complexity. Yet, the 482
increased intensity may partly be due to higher content (Table 2, Figure 2). 483
The composition of coke trapped within the zeolite pores, i.e. internal coke, 484
was determined by mineralizing the zeolite matrix and subsequently analyzing the 485
organic residue by liquid-liquid extraction with CH2Cl2. A minor fraction of coke
486
molecules was insoluble in methylene chloride. Even at low coke content, the 487
recovered coke molecules consist mainly of polyaromatic compounds with an NAR
488
from at least 4 (pyrene, Mw: 202 g mol-1, d: 1.27) and up to 7 (coronene, Mw: 300
489
g mol-1, d: 1.37). The estimated average molar mass and density of the coke 490
trapped in the micropores is 250 g mol-1 and 1.3, respectively. The presence of DX 491
26 in the feed, even at high concentrations, has no impact on the chemical 492
composition of coke. Thus, no evidence of oxygenated trapped products was 493
found. Yet, several studies pointed out that two pathways of coke formation occur 494
in the co-feeding of hydrocarbons and oxygenates. The oxygenate pathway, 495
forming polyphenols residues with more aliphatic and oxygenated nature[41, 496
42]from aldol condensation[43] and the hydrocarbon pathway, forming
497
polycondensed aromatic structures. It is surprising that applying a temperature 498
close to real FCC the test favours the hydrocarbons pathways in the coke 499
composition even with of high content of oxygenates in the feed[37, 44]. 500
Apparently, the coke formed by DX cracking differs to the one formed by catalytic 501
cracking of fast pyrolysis bio-oil that is partially oxidized [45] . 502
The decrease of the Brønsted acid sites and of the micropore volume is 503
proportional to the coke content (Figure 5b and Figure 5d). Taking the above 504
determined average molar mass for the coke molecules trapped inside the 505
micropores into consideration, the number of coke molecules corresponds to the 506
amount of the deactivated Brønsted acid sites (Figure 5a). Moreover, the real 507
(calculated from estimated density) and apparent (measured by N2 physisorption)
508
micropore volumes occupied by coke molecules (Figure 5b) are identical, 509
suggesting that the majority of the coke is trapped within the micropores and not 510
on the external surface. Indeed the silanol groups located on the external (or 511
mesopore-) surface, were not impacted by coke deposition (Figure 2). The 512
decrease of the OH groups (3696 and 3623 cm-1)of the binder can occur at high 513
temperature during the cracking reaction and yield to the formation of Lewis acid 514
sites (LAS). After n-hexane cracking, their concentration is twice to three times 515
higher than that of the fresh catalysts (Figure 3d). Their concentration decreases 516
27 with the coke content as function of the DX concentration. This decrease probably 517
concerns only the LAS located in the zeolite crystal, which accessibility to 518
pyridine decreases with increasing coke content in the micropores. DX co-feeding 519
increased coke formation, however, without affecting its toxicity and hence the 520
coking mode (i.e. poisoning). 521
522
Figure 5. Coke content as a function of DX concentration for n-hexane cracking 523
(a), percentage of removed Brønsted acid sites, (b) proportion of Lewis acid sites 524
(c) and microporous volume (d) on the spent catalyst as a function of the coke 525 content. 526 527 0.0 2.0 4.0 6.0 8.0 10.0 0 20 40 60 Coke (w t. % ) DX in n-hexane (wt. %) Cat-A Cat-B
(a)
0 25 50 75 100 0 2 4 6 8 10 Per cent age of r em oved [PyH +] Coke (wt.%) Cat-A Cat-B Full symbol: C6+ DX Empty symbol : C6(b)
0 1 2 3 4 0 2 4 6 8 10 [PyL]/ [PyL] 0 Coke (wt.%) Cat-A Cat-B Full symbol: C6+ DX Empty symbol : C6(c)
0 25 50 75 100 0 2 4 6 8 10 Per cent age of r em oved Vm icr o Coke (wt.%) Cat-A Cat-B Full symbol: C6+ DX Empty symbol : C6(d)
28 Figure 6. Coking mode: (a) number of deactivated Brønsted acid sites as a 528
function of the number of coke molecules; (b) apparent volume occupied by coke 529
molecules as a function occupied pore volume deduced by nitrogen physisorption. 530
531
Consideration on mutual DX and n-hexane interactions 532
Hydrocarbon chemistry over acid catalysts is governed by bimolecular 533
reactions [26, 28, 46] and particularly by hydrogen transfer reactions32. For 534
instance, hydrogen transfer reaction between olefins and naphthenes leads to the 535
formation of more refractory paraffins [47, 48]. Primarily, hydrocarbon is 536
activated by protolytic reaction on both σ C-H and C-C bonds,[29] 23. Sequentially 537
to the carbenium ion several bimolecular reactions could occur, particularly at 538
moderate conversion the interconversion of olefins54 and products (as function of 539
the zeolite structure) 55 undergoes sequential reactions until formation of 540
aromatics, poly-aromatics and coke37. n-Hexane reaction on acid catalysts such as 541
Y and ZSM-5 affords products containing mainly 3 and 2-4 carbons related to both 542
mono- and bi-molecular reactions 31. The olefin to paraffin ratio in the gas phase is 543
a typical index for bimolecular hydrogen transfer reaction. The present results 544
showed that with similar n-hexane conversion, gas phase olefin/saturated ratio 545 y = 0.99x R² = 0.94 0.000 0.025 0.050 0 0.025 0.05 [PyH +] 0 -[PyH +] co k ed , (m ol g -1) ncoke (mol g-1) Cat-A Cat-B Full symbol: C6+ DX Open symbol : C6
(a)
y = 0.95x R² = 0.93 0.00 0.05 0.10 0.15 0 0.05 0.1 0.15 V0 -V co k ed , (c m 3g -1) Vcoke (cm3g-1) Cat-A Cat-B Full symbol: C6+ DX Empty symbol : C6(b)
29 increased and propane selectivity decreased by increaseing the DX concentration 546
in the feed mixture. 547
Despite of large decrease in Brønsted acid sites and micro porous volume 548
due to coke deposit, DX was entirely converted using both fresh and deactivate 549
catalysts and n-hexane conversion only slightly decreased in the mixture feed 550
compared to that observed in n-hexane. The higher DX reactivity is expected base 551
on higher basicity due to nobonded electron pair of its oxygen atoms. Indeed n-552
hexane is poorly reactive as expected by the lower σ C-C and C-H basicity. Yet it 553
is worth to mention that in the mixture of 30%DX/n-hexane the n-hexane 554
conversion decreased only 20 and 10% of in the presence of Cat-A and –B, 555
respectively. Hence, it appears that DX (a more active molecule) could be 556
primarily activated, then, n-hexane (a less active molecule) could participate in the 557
catalytic-turnover mainly initiated by DX. 558
The mutual interaction between n-hexane and DX (and their products) 559
could manifest beyond a mere competition of acid sites during co-processing. The 560
competition by acid sites was proposed to justify the reduction of gasoil 561
conversion during the co-processing with pyrolysis bio-oils. We will continue 562
investigating this hypothesis through designed experiments with feed variations, 563
detail analysis of activity and overall product distribution. 564
4 – Outlook 565
From a fundamental point of view, the distribution of reaction products, the 566
amount and properties of the coke and other observations from the DX and n-567
hexane reactions indicate possible mutual influences of DX on n-hexane and vice 568
versa. Further studies are required to confirm whether bi-molecular reactions, such 569
as hydrogen transfer, between hydrocarbons and most probably oxygenated 570
30 intermediates occur. The in the presence of hydrocarbons enhanced deoxygenation 571
could be related to the decrease of coke formation in the tests using bio-crude and 572
gasoil mixture as previously reported [14]. 573
Comparing the results achieved through using various catalysts and 574
deactivated catalysts indicated that the catalyst playes an mayor role in the co-575
process. This reinforces that ketal compounds are promising and could be 576
selectively converted into fuel in the refinery by a proper choice of catalyst and 577
process conditions. 578
Finally, this work proves that transforming second generation biomass into 579
crude composed by sugar ketal derivatives represents a sound strategy for bio-580
aromatic production for petrochemical application. However, it is important to 581
point out that n-hexane is not a representative compound of gasoil for co-582
processing in FCC operation. It is remarkably less reactive compared to a typical 583
industrial feed. It is expected, that by co-processing DX to a gasoil feed, a more 584
important ratio of DX could be used without impacting gasoil conversion. The 585
results of this extension work will soon be reported. 586
587
5 – Conclusion 588
A representative compound of a bio-crude composed of ketal-sugar 589
derivative, the 1,2:3,5-di-O-isopropylidene-α-d-xylofuranose (DX), was converted 590
in the presence of n-hexane in fluidized catalytic cracking (FCC) using typical 591
FCC catalysts. 592
DX was fully converted and mainly into bio-aromatics of the gasoline 593
range. Our results indicate that important amounts of DX can be co-fed to n-594
hexane. n-Hexane conversion during co-process was slightly decreased in the 595
31 presence of DX. The coke yield on catalysts was low even in the laboratory 596
catalytic unit, which usually leads to higher coke formation compared to 597
commercial units. The formed coke did not contain detectable amount of 598
oxygenated residue. The result suggests that DX would afford lower coke yield 599
when compare to other type of bio-feed used in FCC in the same conditions. 600 601 602 5-Acknowledgment 603
Joana Pinto thanks CAPES for the scholarship, Marcelo Pereira thanks 604
Petrobras for the catalyst, CNPq, and Faperj. We appreciate the technical 605
assistance of both Hugo Rodrigues and Dr. Praveen Lawrence. 606
The authors acknowledge financial support from the European Union 607
(ERDF) and "Région Nouvelle Aquitaine". 608
609
6- References 610
[1] E.S. Domalski, Selected values of heats of combustion and heats of 611
formation of organic compounds containing the elements C,H,N,O,P, and S, 612
J.Phys Chem., 1, number 2 (1972) 221-277. 613
[2] G.W. Huber, R.D. Cortright, J.A. Dumesic, Renewable Alkanes by Aqueous-614
Phase Reforming of Biomass-Derived Oxygenates, angew Chem Int Ed, 43 615
(2004) 1549 –1551. 616
[3] J.S. Luterbacher, Jacqueline M. Rand, David Martin Alonso, Jeehoon Han, J. 617
Tyler Youngquist, Christos T. Maravelias, Brian F. Pfleger, James A. Dumesic, 618
Nonenzymatic Sugar Production from Biomass Using Biomass-Derived g-619
Valerolactone, Science, 343 ( 2014) 277-280. 620
32 [4] G.W. Huber, S. Iborra, A. Corma, Synthesis of Transportation Fuels from 621
Biomass: Chemistry, Catalysts and Engineering, Chemical Reviews, 106 622
(2006) 4044-4098. 623
[5] G. Jiménez-García, R. Maya-Yescas, Differences between Fisher–Tropsch 624
synthesis of either gasoline or diesel based on changes of entropy and free 625
energy, Fuel, 149 (2015) 184-190. 626
[6] J.D. Adjaye, N.N.Bakhshi, Production of Hydrocarbons by catalytic 627
upgrading of a fast pyrolysis bio-oil. Part I: Conversion over various catalysts, 628
Fuel Processing Technology, 45 (1995) 161-183. 629
[7] M.C. Samolada, W. Baldauf, I.A. Vasalos, Production of a bio-gasoline by 630
upgrading biomass flash pyrolysis liquids via hydrogen processing and 631
catalytic cracking, Fuel, 77 (1998) 1667-1675. 632
[8] M.S. Talmadge, R.M. Baldwin, M.J. Biddy, R.L. McCormick, G.T. Beckham, 633
G.A. Ferguson, S. Czernik, K.A. Magrini-Bair, T.D. Foust, P.D. Metelski, C. 634
Hetrick, M.R. Nimlos, A perspective on oxygenated species in the refinery 635
integration of pyrolysis oil, Green Chemistry, 16 (2014) 407-453. 636
[9] Z. Wang, T. He, J. Qin, J. Wu, J. Li, Z. Zi, G. Liu, J. Wu, L. Sun, Gasification of 637
biomass with oxygen-enriched air in a pilot scale two-stage gasifier, Fuel, 150 638
(2015) 386-393. 639
[10] R.H. Venderbosch, A.R. Ardiyanti, J. Wildschut, A. Oasmaa, H.J. Heeres, 640
Stabilization of biomass-derived pyrolysis oils, Journal of Chemical 641
Technology & Biotechnology, 85 (2010) 674-686. 642
[11] A.d.R. Pinho, M.B.B. de Almeida, F.L. Mendes, V.L. Ximenes, L.C. 643
Casavechia, Co-processing raw bio-oil and gasoil in an FCC Unit, Fuel 644
Processing Technology, 131 (2015) 159-166. 645
33 [12] S. Wang, Q. Cai, J. Chen, L. Zhang, L. Zhu, Z. Luo, Co-cracking of bio-oil 646
model compound mixtures and ethanol over different metal oxide-modified 647
HZSM-5 catalysts, Fuel, 160 (2015) 534-543. 648
[13] S. Wang, Q. Cai, X. Wang, L. Zhang, Y. Wang, Z. Luo, Biogasoline 649
Production from the Co-cracking of the Distilled Fraction of Bio-oil and 650
Ethanol, Energy & Fuels, 28 (2013) 115-122. 651
[14] N. Batalha, A.V.d. Silva, M.O.d. Souza, B.M.C.d. Costa, E.S. Gomes, T.C. Silva, 652
T.G. Barros, M.L.A. Gonçalves, E.B. Caramão, L.R.M.d. Santos, M.B.B. Almeida, 653
R.O.M.A.d. Souza, Y.L. Lam, N.M.F. Carvalho, L.S.M. Miranda, M.M. Pereira, 654
Gasoline from Biomass through Refinery-Friendly Carbohydrate-Based Bio-655
Oil Produced by Ketalization, CHEMSUSCHEM, 7 (2014) 1627–1636. 656
[15] N. Batalha, J. Pinto, H. Ferreira, D.C. Baptista, L.S.M. Miranda, M.M. 657
Pereira, Biohydrocarbons Production under Standard Refinery Conditions by 658
means of a Representative Ketal Compound of Biocrude, Energy Technology, 659
5 (2016) 428-441. 660
[16] R. Garrett, T.G. Barros, M.O. de Souza, B.M.C. da Costa, M.M. Pereira, L.S.M. 661
Miranda, Unveiling the chemical composition of sugar cane biocrudes by 662
liquid chromatography-tandem mass spectrometry, Energy & Fuels, 29 663
(2015) 8082-8087. 664
[17] Y.M. Questell-Santiago, R. Zambrano-Varela, M. Talebi Amiri, J.S. 665
Luterbacher, Carbohydrate stabilization extends the kinetic limits of chemical 666
polysaccharide depolymerization, Nature Chemistry, (2018). 667
[18] A.D.F. Ferreira, A.J. Maia, B. Guatiguaba, M.H. Herbst, P.T.L. Rocha, M.M. 668
Pereira, B. Louis, Nickel-doped small pore zeolite bifunctional catalysts: A way 669
34 to achieve high activity and yields into olefins, Catalysis Today, 226 (2014) 670
67-72. 671
[19] B.G. Anderson, R.R. Schumacher, R.v. Duren, A.P. Singh, R.A.v. Santen, An 672
attempt to predict the optimum zeolite based catalyst forselective cracking of 673
naphtha-range hydrocarbons to light olefins, Journal of Molecular Catalysis A: 674
Chemical, 181 (2002) 291–301. 675
[20] A.J. Maia, B. Louis, Y.L. Lam, M.M. Pereira, Ni-ZSM-5 catalysts: Detailed 676
characterization of metal sites for proper catalyst design, Journal of Catalysis, 677
269 (2010) 103-109. 678
[21] M. Guisnet, L. Pinard, Characterization of acid-base catalysts through 679
model reaction, Catalysis Reviews, 60 (2018) 337-436. 680
[22] C. Miranda, J. Urresta, H. Cruchade, A. Tran, M. Benghalem, A. Astafan, P. 681
Gaudin, T.J. Daou, A. Ramírez, Y. Pouilloux, A. Sachse, L. Pinard, Exploring the 682
impact of zeolite porous voids in liquid phase reactions: The case of glycerol 683
etherification by tert-butyl alcohol, Journal of Catalysis, 365 (2018) 249-260. 684
[23] J.F. Pinto, L.S.M. Miranda, P.M. Marcelo, Petroleum Refining and Oil Well 685
Drilling. , in: K.F. Olson (Ed.) Problems, process and industry prospects, Nova 686
Science Publishers, Nova York, 2017, pp. 314. 687
[24] F.V. Pinto, A.S. Escobar, B.G. de Oliveira, Y.L. Lam, H.S. Cerqueira, B. Louis, 688
J.P. Tessonnier, D.S. Su, M.M. Pereira, The effect of alumina on FCC catalyst in 689
the presence of nickel and vanadium, Applied Catalysis A: General, 388 690
(2010) 15-21. 691
[25] S.J. Miller, C.R. Hsieh, Octane Enhancement in Catalytic Cracking by Using 692
High-Silica Zeolites, in: M.L. Occelli (Ed.) Fluid Catalytic Cracking II. Concepts 693
in Catalyst Design-American Chemical Society, 1991, pp. 96-108. 694
35 [26] H. Abrevaya, Cracking of naphtha range alkanes and naphthenes over 695
zeolites, Studies in Surface Science and CAtalysis, 170 (2007) 1244-1251. 696
[27] T.F. Narbeser, H. Vinek, J.A. Lercher, Monomolecular Conversion of light 697
Alkanes over H-ZSM-5, Journal of Catalysis, 157 (1995) 388-395. 698
[28] A. Corma, A.V. Orchillés, Current views on the mechanism of catalytic 699
cracking, Microporous and Mesoporous Materials, 35-36 (2000) 21-30. 700
[29] B. Louis, M.M. Pereira, F.M. Santos, P.M. Esteves, J. Sommer, Alkane 701
activation over acidic zeolites: the first step, Chemistry, 16 (2010) 573-578. 702
[30] P. O’Connor, Catalytic Cracking: The Future of an Evolving Process, in: 703
M.L. Occelli (Ed.) Fluid Catalytic Cracking VII: Materials, Methods and Process 704
Innovations, Elsevier B.V.2007, pp. 227-250. 705
[31] E.T.C. Vogt, G.T. Whiting, A.D. Chowdhury, B.M. Weckhuysen, Zeolites and 706
Zeotypes for Oil and Gas Conversion, elsevier2015. 707
[32] A. Corma, L. Sauvanaud, FCC testing at bench scale: New units, new 708
processes, new feeds, Catalysis Today, 218-219 (2013) 107-114. 709
[33] J.C. Kayser, VERSATILE FLUIDIZED BED REACTOR, Kayser Technology, 710
Inc., Houston, Tex., United States 2000, pp. 13. 711
[34] I. Graça, J.D. Comparot, S. Laforge, P. Magnoux, J.M. Lopes, M.F. Ribeiro, 712
F.R. Ribeiro, Effect of phenol addition on the performances of H–Y zeolite 713
during methylcyclohexane transformation, Applied Catalysis A: General, 353 714
(2009) 123-129. 715
[35] I. Graça, A. Fernandes, J.M. Lopes, M.F. Ribeiro, S. Laforge, P. Magnoux, F. 716
Ramôa Ribeiro, Effect of phenol adsorption on HY zeolite for n-heptane 717
cracking: Comparison with methylcyclohexane, Applied Catalysis A: General, 718
385 (2010) 178-189. 719
36 [36] P. Sirous Rezaei, H. Shafaghat, W.M.A.W. Daud, Origin of catalyst 720
deactivation in atmospheric hydrogenolysis of m-cresol over Fe/HBeta, RSC 721
Advances, 5 (2015) 51278-51285. 722
[37] Á. Ibarra, E. Rodríguez, U. Sedran, J.M. Arandes, J. Bilbao, Synergy in the 723
Cracking of a Blend of Bio-oil and Vacuum Gasoil under Fluid Catalytic 724
Cracking Conditions, Industrial & Engineering Chemistry Research, 55 (2016) 725
1872-1880. 726
[38] M.M. Pereira, L. Benoit, Carbon dioxide, chemical valorization, and 727
mitigation in the refinery, in: S.L. Suib (Ed.) New and Future Developments in 728
Catalysis: Catalysis for remediation and environmental concerns, 729
Elsevier2013, pp. 535-562. 730
[39] H.S. Cerqueira, P. Ayrault, J. Datka, M. Guisnet, Influence of coke on the 731
acid properties of a USHY zeolite, micro and mesoporous material, 38 (2000) 732
197-205. 733
[40] N. Chaouati, A. Soualah, M. Chater, M. Tarighi, L. Pinard, Mechanisms of 734
coke growth on mordenite zeolite, Journal of Catalysis, 344 (2016) 354-364. 735
[41] M. Ibáñez, B. Valle, J. Bilbao, A.G. Gayubo, P. Castaño, Effect of operating 736
conditions on the coke nature and HZSM-5 catalysts deactivation in the 737
transformation of crude bio-oil into hydrocarbons, Catalysis Today, 195 738
(2012) 106-113. 739
[42] B. Valle, P. Castaño, M. Olazar, J. Bilbao, A.G. Gayubo, Deactivating species 740
in the transformation of crude bio-oil with methanol into hydrocarbons on a 741
HZSM-5 catalyst, Journal of Catalysis, 285 (2012) 304-314. 742
[43] R.S. Weber, M.V. Olarte, H. Wang, Modeling the Kinetics of Deactivation of 743
Catalysts during the Upgrading of Bio-oil, Energy & Fuels, 29 (2014) 273-277. 744
37 [44] Á. Ibarra, A. Veloso, J. Bilbao, J.M. Arandes, P. Castaño, Dual coke 745
deactivation pathways during the catalytic cracking of raw bio-oil and 746
vacuum gasoil in FCC conditions, Applied Catalysis B: Environmental, 182 747
(2016) 336-346. 748
[45] L. Gueudré, N. Thegarid, L. Burel, B. Jouguet, F. Meunier, Y. Schuurman, C. 749
Mirodatos, Coke chemistry under vacuum gasoil/bio-oil FCC co-processing 750
conditions, Catalysis Today, 257 (2014) 200-212. 751
[46] A.J. Maia, B.G. Oliveira, P.M. Esteves, B. Louis, Y.L. Lam, M.M. Pereira, 752
Isobutane and n-butane cracking on Ni-ZSM-5 catalyst: Effect on light olefin 753
formation, Applied Catalysis A: General, (2011) 58-64. 754
[47] A. Humphries, D.H. Harris, P. O'Connor, Chapter 2 The Nature of Active 755
Sites in Zeolites: Influence on Catalyst Performance, Studies in Surface 756
Science and Catalysis, 76 (1993) 41-82. 757
[48] G. Bellussi, F. Mizia, V. Calemma, P. Pollesel, R. Millini, Oligomerization of 758
olefins from Light Cracking Naphtha over zeolite-based catalyst for the 759
production of high quality diesel fuel, Microporous and Mesoporous 760 Materials, 164 (2012) 127-134. 761 762 763 764 765 766 767 768 769
38 770
771 772