HAL Id: hal-00299374
https://hal.archives-ouvertes.fr/hal-00299374
Submitted on 10 Oct 2006
HAL is a multi-disciplinary open access
archive for the deposit and dissemination of
sci-entific research documents, whether they are
pub-lished or not. The documents may come from
teaching and research institutions in France or
abroad, or from public or private research centers.
L’archive ouverte pluridisciplinaire HAL, est
destinée au dépôt et à la diffusion de documents
scientifiques de niveau recherche, publiés ou non,
émanant des établissements d’enseignement et de
recherche français ou étrangers, des laboratoires
publics ou privés.
Probabilistic seismic hazard map for Bulgaria as a basis
for a new building code
S. D. Simeonova, D. E. Solakov, G. Leydecker, H. Busche, T. Schmitt, D.
Kaiser
To cite this version:
S. D. Simeonova, D. E. Solakov, G. Leydecker, H. Busche, T. Schmitt, et al.. Probabilistic seismic
hazard map for Bulgaria as a basis for a new building code. Natural Hazards and Earth System
Science, Copernicus Publications on behalf of the European Geosciences Union, 2006, 6 (6),
pp.881-887. �hal-00299374�
www.nat-hazards-earth-syst-sci.net/6/881/2006/ © Author(s) 2006. This work is licensed under a Creative Commons License.
and Earth
System Sciences
Probabilistic seismic hazard map for Bulgaria as a basis for a new
building code
S. D. Simeonova1, D. E. Solakov1, G. Leydecker2, H. Busche2, T. Schmitt2, and D. Kaiser2
1Bulgarian Academy of Sciences, Geophysical Institute, Seismological Department, Sofia, Bulgaria 2Institute for Geosciences and Natural Resources, Hannover, Germany
Received: 20 July 2006 – Revised: 20 September 2006 – Accepted: 20 September 2006 – Published: 10 October 2006
Abstract. A seismic hazard map proposed as part of a new
building code for Bulgaria is presented here on basis of the recommendations in EUROCODE 8.
Seismic source zones within an area of about 200 km around Bulgaria were constructed considering seismicity, neotectonic and geological development. The most time con-suming work was to establish a homogeneous earthquake catalogue out of different catalogues.
The probabilistic seismic hazard assessment in terms of in-tensities is performed following Cornell (1968) with the pro-gram EQRISK (see McGuire, 1976), modified by us for use of intensities. To cope with the irregular isoseismals of the Vrancea intermediate depth earthquakes a special attenuation factor is introduced (Ardeleanu et al., 2005), using detailed macroseismic maps of three major earthquakes.
The final seismic hazard is the combination of both contri-butions, of zones with crustal earthquakes and of the Vrancea intermediate depth earthquakes zone. Calculations are done for recurrence periods of 95, 475 and 10 000 years.
1 Introduction
Bulgaria, situated in the Balkan Region as a part of the Alpine-Himalayan seismic belt, characterized by high seis-micity, is exposed to a high seismic risk. From plate-tectonic point of view, the Balkan Region is an element of the con-tinental margin of Eurasia and is located between the stable part of the European continent to the north and the ophiolitic sutures to the South. South of the sutures, fragments of the passive continental margin of Africa crop out (Boyanov et al., 1989). The neotectonic movements on the Balkan Re-gion are controlled by the extensional collapse of the late Alpine orogen, and are influenced by the extension behind
Correspondence to: G. Leydecker
the Aegean arc and by the complicated vertical and horizon-tal movements in the Pannonian region (Zagorchev, 1992).
Over the centuries, Bulgaria has experienced strong earth-quakes. In historical aspect, it is worth mentioning the 1818 (VIII-IX MSK) and the 1858 (IX MSK, MS≈6.3)
earth-quakes near the capital Sofia. Some of Europe’s strongest earthquakes in the 20th century occurred on the territory of Bulgaria. At the beginning of the last century (from 1901 to 1928) five earthquakes with magnitude MS≥7.0 occurred
there. Strong seismic activity took place in SW Bulgaria dur-ing 1904 to 1906. The seismic sequence started on 4 April 1904 with two catastrophic earthquakes within 23 minutes (the first quake with MS=7.1 considered as a foreshock and
the second one, the main shock, with MS=7.8 and
epicen-tral intensity Iepic=X). Along the Maritza valley (central part
of Bulgaria), a sequence of three destructive earthquakes curred in 1928. However, such large earthquakes did not oc-cur in Bulgaria since that time. The 1986 earthquake of mag-nitude MS=5.7 in central northern Bulgaria (near the town
Strazhitza) is the strongest quake after 1928. Moreover, the seismicity of the neighboring areas, from Greece, Turkey, former Yugoslavia and Romania (especially the Vrancea in-termediate depth earthquakes), contribute to the seismic haz-ard in Bulgaria.
During the last decades, several papers have been pub-lished about the seismic hazard in Bulgaria. Bonchev et al. (1982) proposed a seismic zoning of Bulgaria based on an analysis incorporating the seismicity and most of the ge-ological and geophysical data available at that time. Their study resulted in seismic hazard maps for Bulgaria in terms of MSK-1964 intensities for 100, 1000 and 10 000 years re-turn periods; the map for 1000 years rere-turn period is in-cluded in the current building code of Bulgaria. Orozova-Stanishkova and Slejko (1994), considering different prob-abilistic approaches and extremely detailed zonation (that does not seem opportune with the present knowledge of the regional seismotectonics), provide seismic hazard estimates
882 S. D. Simeonova et al.: Probabilistic seismic hazard map for Bulgaria for both intensity and peak ground acceleration (PGA) for
100 years return period. Van Eck and Stoyanov (1996) per-formed a PSHA for southern Bulgaria. They proposed a zonation model based on the hypothesis that southern Bul-garia and northern Greece can be considered as one seismo-tectonic unit related to that of the Aegean Sea. Probabilistic seismic hazard estimates for southern Bulgaria in terms of PGA and 0.01 annual probability of exceedance were pre-sented in that study. A probabilistic seismic hazard map in terms of PGA for Sofia area for a 1000 year return period was published by Solakov et al. (2001). Their hazard analysis is based on a simplified seismogenic model, derived from the seismic zoning of Bulgaria.
In all these preceding papers only magnitude-frequency relations are used and the epicentral or site intensities for given distances are estimated using magnitudes. In contrast, in the present paper the intensity-frequency relations and the distance dependent site intensities are computed as a function of observed epicentral intensities (MSK-1964), based on a new homogeneous catalogue for the whole area. Among the papers mentioned above, only Bonchev et al. (1982) have performed hazard analysis for the whole territory of Bul-garia for different probabilities of exceedance, but not for a 475 years return period as recommended in EUROCODE 8 (EC8).
In the present study seismic hazard maps for Bulgaria are presented in terms of macroseismic intensities in agreement with EC8. As recommended in EC8, the maps are calculated for a 475 years return period (probability of exceedance of 10% in 50 years) and for a 95 years return period (proba-bility of exceedance of 10% in 10 years). A special fea-ture of our paper is that the irregular macroseismic effects of the Vrancea intermediate depth earthquakes are directly included in the seismic hazard calculations. An appropriate spatial treating of Vrancea intermediate depth earthquakes is of great importance for an adequate hazard assessment, be-cause these earthquakes dominate the hazard of large parts of Northern Bulgaria.
2 Earthquake catalogue
The area within a radius of about 200 km surrounding Bul-garia encompasses the territories of southern Romania, the eastern parts of Albania and former Yugoslavia, the northern parts of Greece, Turkey and Aegean Sea, and the Marmara Sea.
The seismicity for the area bordered by 39◦N–49◦N and 19◦E–30◦E is mainly compiled from the catalogues for Cen-tral and Southeastern Europe (Shebalin et al., 1998) and for Greece and surrounding area (Papazachos et al., 2000). The data were checked and complemented with data from the fol-lowing catalogues:
– Christoskov et al. (1979): Bulgaria, centuries V B.C. –
XIX AD;
– Grigorova et al. (1979): Bulgaria and adjacent areas,
1900–1977;
– Solakov and Simeonova (1993): Bulgaria, 1981–1990; – Papazachos et al. (2005): Mediterranean and
surround-ing area, 1901–2004;
– K´arn´ık (1996): Europe and the Mediterranean, 1800–
1990.
A homogeneous catalogue was obtained by checking and correcting epicentral intensity Iepic (MSK-1964),
surface-wave magnitude MS, and epicentral coordinates. In the
com-piled catalogue the size of an earthquake is given in terms of intensity Iepic, and of magnitude MS whenever possible.
As a Poisson model for the seismicity is assumed, only independent events should be included in the analyses. The fore- and aftershocks were removed by using a space-time . More specifically, in the case of more than one earthquake within 10 days and 50 km distance only the strongest event is used for the statistics; the others are considered as statisti-cally dependent and rejected from the catalogue. The earth-quake catalogue thus obtained of the considered area consists of nearly 2750 events with epicentral intensity Iepic≥4. This
catalogue was used for all following analyses.
Because the compiled catalogue was going to be used for seismic hazard analyses it was necessary to examine the completeness of the data using Stepp’s (1971) test. Stepp’s (1971) analysis provides a method for the analytical determi-nation of time intervals in which a particular intensity class (or magnitude) is likely to be completely reported. The test results imply that it is possible to create homogeneous data samples by determining intervals over which earthquakes in different intensity classes are completely reported.
3 Probabilistic Seismic Hazard Assessment (PSHA)
We performed a PSHA, using a method which deduces the causative sources, characteristics, and ground motions for future earthquakes (McGuire, 1993). This method was first published by Cornell (1968), with many applications since then. The program EQRISK (McGuire, 1976) is used in the present study with the epicentral intensity instead of the mag-nitude as the input parameter. The analysis methodology is based on the conception that the seismic hazard at a site is a function of three main components: the space geometry of seismic sources, the characteristics and statistics of their seismicity and the attenuation of intensity. The resultant haz-ard at a specified site is obtained by integrating the effects of ground motion from earthquakes of different size occurring at different locations within different seismic source regions and with different frequencies of occurrence.
19˚E 19˚E 20˚E 20˚E 21˚E 21˚E 22˚E 22˚E 23˚E 23˚E 24˚E 24˚E 25˚E 25˚E 26˚E 26˚E 27˚E 27˚E 28˚E 28˚E 29˚E 29˚E 30˚E 30˚E 39˚N 39˚N 40˚N 40˚N 41˚N 41˚N 42˚N 42˚N 43˚N 43˚N 44˚N 44˚N 45˚N 45˚N 46˚N 46˚N 47˚N 47˚N 48˚N 48˚N 49˚N 49˚N 19˚E 19˚E 20˚E 20˚E 21˚E 21˚E 22˚E 22˚E 23˚E 23˚E 24˚E 24˚E 25˚E 25˚E 26˚E 26˚E 27˚E 27˚E 28˚E 28˚E 29˚E 29˚E 30˚E 30˚E 39˚N 40˚N 41˚N 42˚N 43˚N 44˚N 45˚N 46˚N 47˚N 48˚N 49˚N 19˚E 19˚E 20˚E 20˚E 21˚E 21˚E 22˚E 22˚E 23˚E 23˚E 24˚E 24˚E 25˚E 25˚E 26˚E 26˚E 27˚E 27˚E 28˚E 28˚E 29˚E 29˚E 30˚E 30˚E 39˚N 40˚N 41˚N 42˚N 43˚N 44˚N 45˚N 46˚N 47˚N 48˚N 49˚N H2 CM BA BD HS DA FC VN Vi PD S3 S1 SF GO N2 N1 SH D1 KR SU D2 SW SL G3 MR AF G2 G1 T1 Years -342 - 1990 Epicentral intensity I0 < 4.5 4.5 < I0 < 5.5 5.5 < I0 < 6.5 6.5 < I0 < 7.5 7.5 < I0 < 8.5 8.5 < I0 _ _ _ _ _
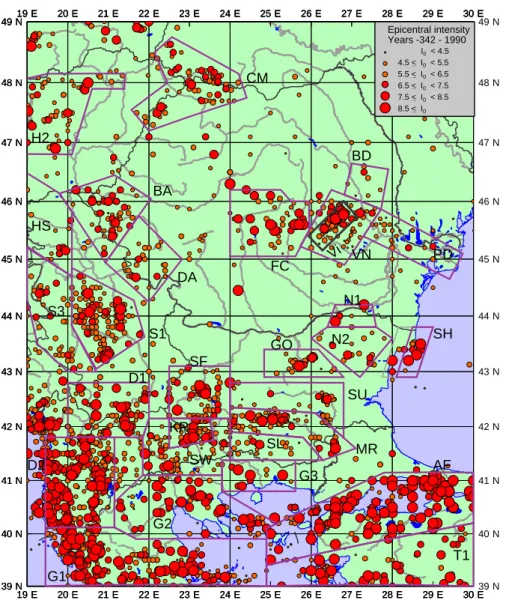
Fig. 1. Epicenter map (I0=epicentral intensity) with the seismic source zones. Codes of source zones refer to Table 1.
3.1 Seismic source zones
The spatial pattern of seismicity for Bulgaria and surround-ings (within a radius of about 200 km) is shown in Fig. 1. The figure shows an epicenter map of the earthquakes with
Iepic≥4 reported in the time 342 BC–1990 AD, together with
the seismotectonic zones. Each zone is characterized by its own specific seismicity, and geological and tectonic devel-opment. From the seismotectonic analysis of the considered parts of the Balkans this seems more appropriate than to use specific linear fault structures. It is assumed an equal proba-bility that an earthquake occurs in any place within a source zone. The seismic source zones for the territory of Bulgaria are based on Bonchev et al. (1982) and close to those de-fined by Sokerova et al. (1992) and Dachev et al. (1995). The boundaries of the seismic source zones outside Bulgaria were chosen to reflect the seismicity adequately with respect
to the tectonic units and lithosphere structure; in the north-ern part of the study area they follow the zonation given by Ardeleanu et al. (2005). All earthquakes outside the designed sources are assigned to the “background seismicity”. This was not necessary for the Bulgarian territory, because of too low background seismicity. The characteristics of each zone are given in Table 1.
From the analysis of the depth distribution (Sokerova et al., 1992; Dachev et al., 1995) it was recognized that the earthquakes in all zones occurred in the earth’s crust (h<60 km), with the exception of the events in the Vrancea (Romania) intermediate depth zone. The depths distribution shows that the earthquakes in Bulgaria are mainly located in the upper crust, and only a few events are related to the lower crust. The maximum depth is about 50 km in south-western Bulgaria; outside, the foci affect only the upper 30–35 km. The maximum density of seismicity is found in the layers
884 S. D. Simeonova et al.: Probabilistic seismic hazard map for Bulgaria
Table 1. Parameters of intensity-frequency relations and input parameters for seismic hazard calculation. The a- and b-values are estimated
using full intensity values. Half intensity values are added to the next higher intensity class. This enlarges the number of events in each class, which improves the statistical stability and is also more conservative.
Region code start time a b depth Imax Imax
yeara) interval value value km observed credible Anatolian Faultb) AF 1860 131 3.4915 −0.2727 15 10.0 10.5 Banat Nc) BA 1843 148 4.0497 −0.3992 10 8.5 8.5 Birladd) BD 1896 95 3.0802 −0.4604 25 6.5 7.0 Crisana Marmamures CM 1781 210 5.1300 −0.5731 10 8.0 8.5 Dinnaridi 1 D1 1860 131 4.8226 −0.4921 10 9.0 9.0 Dinnaridi 2e) D2 1860 131 4.8084 −0.3943 15 9.5 9.5 Banat Sc) DA 1864 127 3.5993 −0.3992 12 8.0 8.5 Fagaras Campulung FC 1517 474 3.1653 −0.2711 20 8.5 9.0 Greece 1 G1 1860 131 4.7075 −0.3925 20 10.0 10.5 Greece 2 G2 1860 131 3.9476 −0.3692 15 10.0 10.5 Greece 3 G3 1860 131 2.0740 −0.2273 15 10.0 10.0 Gorna Orjahovitzaf) GO 1860 131 4.2670 −0.5000 10 9.5 9.5 Hungary Central H2 1753 238 4.4717 −0.4560 10 8.5 9.0 Hungary + Serbiag) HS 1738 253 5.1256 −0.5731 8 8.5 9.0 Kresnah) KR 1860 131 4.3866 −0.4831 15 10.0 10.5 Marica MR 1860 131 4.3367 −0.4688 10 9.5 10.0 NE Bulgaria 1i) N1 1860 131 2.5296 −0.3051 20 9.0 9.0 NE Bulgaria 2i) N2 1860 131 2.8306 −0.3051 15 8.0 8.0 Predobroudjad) PD 1832 159 3.5808 −0.4604 20 7.5 7.5 Serbia E S1 1886 105 4.8914 −0.4866 10 9.0 9.5 Serbia W S3 1894 97 5.6181 −0.6990 10 7.5 8.0 Sofia SF 1800 191 4.3619 −0.4523 10 9.0 9.5 Shablaj) SH 1860 131 4.3375 −0.5396 20 10.0 10.5 Southern Bulgaria 2k) SL 1860 131 4.2790 −0.5396 10 8.5 9.0 Southern Bulgaria 1k) SU 1860 131 4.3515 −0.5396 10 8.5 9.0 South-West Bulgarial) SW 1860 131 5.6658 −0.6761 15 10.0 10.0 Turkey T1 1860 131 4.1423 −0.3789 15 10.0 10.5 Vrancea, normal depth VN 1802 189 3.6209 −0.4515 30 8.0 8.5 Vrancea, intermediate Vi 1701 290 4.3335 −0.3971 120 9.0 9.5 Background BG 1817 174 3.9493 −0.4530 10 8.5 8.5
a)End year for all regions is 1990; usually, only events with intensities of 5.5 or more are considered.
b)The regression curve in the cumulative intensity-frequency relation for region AF is calculated without the single event with intensity 10.0
MSK for statistical reasons; the next lower class IX contains 9 events.
c)For the two regions BA and DA, the events are added and a common intensity-frequency statistic is done, resulting in a common b-value.
The a-value is computed using the cumulative number of events with intensity class 7.0 MSK and more for region BA; and with intensity class 6.0 MSK and more for region DA.
d)For the two regions BD and PD, the events are added and a common intensity-frequency statistic is done, resulting in a common b-value.
The a-value for each region is computed, using the cumulative number of events with intensity class 5.0 and more.
e)The regression curve in the cumulative intensity-frequency relation for region D2 is calculated without the single event with intensity 10.0
MSK, for statistical reasons; the next lower class IX contains 17 events.
f)The regression curve in the cumulative intensity-frequency relation for region GO is calculated without the single event with intensity 10.0
MSK, for statistical reasons; the next strongest event has intensity 8.0 MSK.
g)Only events with intensities class 7.0 or more are considered.
h)The regression curve in the cumulative intensity-frequency relation for region KR is calculated without the two events with intensity 10.0
MSK, for statistical reasons; the next strongest event has intensity 8.0 MSK.
i)For the two regions N1 and N2, the events are added and a common intensity-frequency statistic is done, resulting in a common b-value.
The a-value for each region is computed, using the cumulative number of events with intensity class 6.0 and more.
j)The regression curve in the cumulative intensity-frequency relation for region SH is calculated without the single event with intensity 10.0
MSK, for statistical reasons; then the strongest event has an intensity of 8.0 MSK. The statistic was done for a bigger area (thin lines in Fig. 1) because of suspected mislocated events; the used size of the source region SH is shown by thick lines.
k)For the two regions SL and SU, the events are added and a common intensity-frequency statistic is done, resulting in a common b-value.
The a-value for each region is computed, using the cumulative number of events with intensity class 6.0 and more.
l)The regression curve in the cumulative intensity-frequency relation for region SW is calculated without the single event with intensity 10.0
MSK, for statistical reasons; the next strongest event has intensity 8.0 MSK.
between 5 and 25 km. The seismogenic depth of each zone is defined as the depth of maximum seismic energy release and it is given in Table 1.
The seismicity within the Vrancea (Romania) region con-sists of two depths horizons: normal depth (less than 60 km) and intermediate depth (60–180 km) earthquakes. Due to ex-treme irregularities of the isoseismals of intermediate depth earthquakes their effects on seismic hazard have to be treated separately.
3.2 Earthquake statistics
We assume a truncated exponential distribution as a seis-micity model for each seismic source zone, defined by the parameters a and b of the intensity-frequency relation and by the maximum possible intensity Imax(maximum credible
earthquake). The parameters a and b for each seismic source zone were calculated by the least square method using the following equation:
log N (I ) = a + bIepic (1)
where N (I ) is the cumulative number of earthquakes with intensity ≥Iepic.
The beginning of the time period for statistical purposes is chosen according to assumed completeness of the cata-logue for events greater than the lowest intensity values used in statistics (a and b in Table 1). In parallel, we estimated the completeness using results from Stepp’s test that is different for different intensities. The seismic hazard maps we com-puted with the resulting a0- and b0-values differ only slightly for a recurrence period of 475 years; therefore we did not use these for the following computations.
Some of the seismic zones (as for example seismic sources N1 and N2 in Northern Bulgaria, see Table 1) display low and disperse seismicity. Since it is not possible to determine a reliable intensity-frequency relation for each of these sources separately, they are treated in a special way (see Table 1) to calculate the intensity-frequency statistics.
All model parameters for PSHA are summarized in Ta-ble 1.
3.3 Attenuation relationship
In the program EQRISK we implemented the intensity at-tenuation function of Sponheuer (1960) which is based on K¨ovesligethy (1907).
Isite=Iepic−3 log(r/ h) − 1.3α(r − h) (2)
Iepicis the epicentral intensity, Isiteis the intensity at a site at
hypocentral distance r (km); h is the focal depth (km); and α is the absorption coefficient, here 0.002 km−1.
For a hazard curve at a site EQRISK cuts all source re-gions into finite ring segments with their assigned statistical parameters. Then the site intensities caused by earthquakes
22˚E 22˚E 23˚E 23˚E 24˚E 24˚E 25˚E 25˚E 26˚E 26˚E 27˚E 27˚E 28˚E 28˚E 29˚E 29˚E 30˚E 30˚E 41˚N 41˚N 42˚N 42˚N 43˚N 43˚N 44˚N 44˚N 45˚N 45˚N 6.5 7.5 7.5 7.5 7.5 8.5 5.5 6.5 7.5 8.5 9.5 10.5 22˚E 22˚E 23˚E 23˚E 24˚E 24˚E 25˚E 25˚E 26˚E 26˚E 27˚E 27˚E 28˚E 28˚E 29˚E 29˚E 30˚E 30˚E 41˚N 42˚N 43˚N 44˚N 45˚N 22˚E 22˚E 23˚E 23˚E 24˚E 24˚E 25˚E 25˚E 26˚E 26˚E 27˚E 27˚E 28˚E 28˚E 29˚E 29˚E 30˚E 30˚E 41˚N 42˚N 43˚N 44˚N 45˚N Bucharest Craiova Constanta Plovdiv Sofia Ruse Pleven Varna Burgas
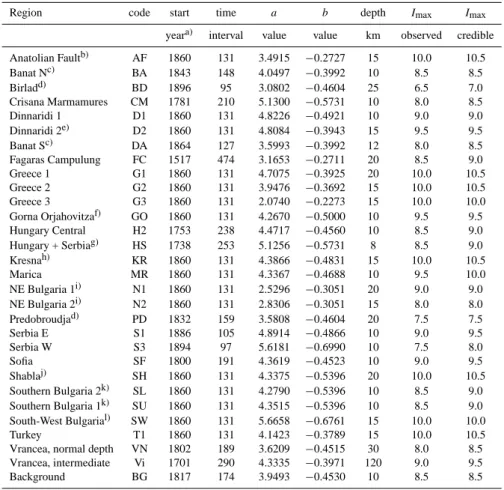
Fig. 2. Seismic hazard from source zones of normal depth for a
recurrence period of 475 years; colours represent the intensities in MSK-1964 scale.
of each segment are calculated assuming a standard devia-tion of half an intensity. The sum of the contribudevia-tions of all regions finally leads to the annual probability of exceedance at each grid point of the hazard map. These calculations are done for all points between 39◦N to 48.5◦N and 20.0◦E to
30.0◦E every 0.1◦in latitude and 0.2◦in longitude. Figure 2 shows the seismic hazard for Bulgaria due to the earthquakes of normal depths only, for a recurrence period of 475 years.
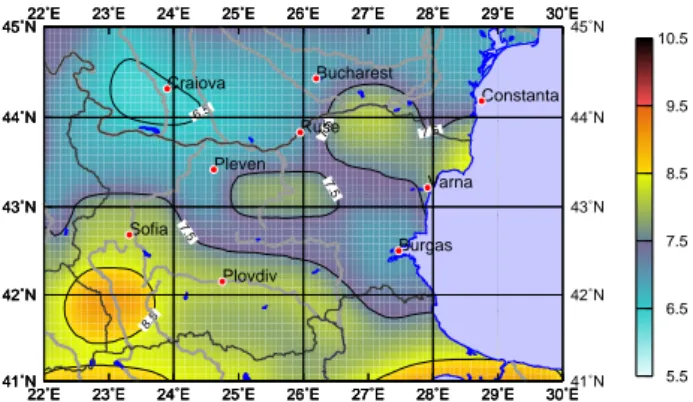
3.4 Treatment of Vrancea intermediate depth zone The macroseismic field of intermediate depth earthquakes of the Vrancea zone (Romania) is very irregular. As the atten-uation law (Eq. 2) does not consider spatial differences in damping, a new empirical approach is chosen to take the di-rectionality of attenuation and local site effects into account. Therefore a factor is introduced into Eq. (2) (Ardeleanu et al., 2005):
Isite=Iepic−3 log(r/ h) − 1.3α(r − h) (3)
Using detailed macroseismic maps of three strong Vrancea intermediate depth earthquakes (see Ardeleanu et al., 2005)
is calculated for each observation point. For simplification
αis fixed to 0.001 km−1. Strong local variations of are avoided by calculating mean values inside grid cells of 0.50◦ in longitude and 0.25◦in latitude, separately for each event. The median is taken to combine all three grids. Intensities for cells without observations were 2-D-interpolated respec-tively extrapolated.
Using the corresponding assigned values, the seismic hazard from the Vrancea Intermediate Depth Zone (Vi) is calculated in the same way as for the crustal zones. A seis-mogenic depth of 120 km is assumed for Vi source zone. Fig-ure 3 shows intensities for a recurrence period of 475 years.
886 S. D. Simeonova et al.: Probabilistic seismic hazard map for Bulgaria 22˚E 22˚E 23˚E 23˚E 24˚E 24˚E 25˚E 25˚E 26˚E 26˚E 27˚E 27˚E 28˚E 28˚E 29˚E 29˚E 30˚E 30˚E 41˚N 41˚N 42˚N 42˚N 43˚N 43˚N 44˚N 44˚N 45˚N 45˚N 6.5 7.5 7.5 5.5 6.5 7.5 8.5 9.5 10.5 22˚E 22˚E 23˚E 23˚E 24˚E 24˚E 25˚E 25˚E 26˚E 26˚E 27˚E 27˚E 28˚E 28˚E 29˚E 29˚E 30˚E 30˚E 41˚N 42˚N 43˚N 44˚N 45˚N 22˚E 22˚E 23˚E 23˚E 24˚E 24˚E 25˚E 25˚E 26˚E 26˚E 27˚E 27˚E 28˚E 28˚E 29˚E 29˚E 30˚E 30˚E 41˚N 42˚N 43˚N 44˚N 45˚N Bucharest Craiova Constanta Plovdiv Sofia Ruse Pleven Varna Burgas
Fig. 3. Seismic hazard from Vrancea events of intermediate depth
for a recurrence period of 475 years; colours represent intensities in MSK-1964 scale. 22˚E 22˚E 23˚E 23˚E 24˚E 24˚E 25˚E 25˚E 26˚E 26˚E 27˚E 27˚E 28˚E 28˚E 29˚E 29˚E 30˚E 30˚E 41˚N 41˚N 42˚N 42˚N 43˚N 43˚N 44˚N 44˚N 45˚N 45˚N 7.5 7.5 7.5 8.5 5.5 6.5 7.5 8.5 9.5 10.5 22˚E 22˚E 23˚E 23˚E 24˚E 24˚E 25˚E 25˚E 26˚E 26˚E 27˚E 27˚E 28˚E 28˚E 29˚E 29˚E 30˚E 30˚E 41˚N 42˚N 43˚N 44˚N 45˚N 22˚E 22˚E 23˚E 23˚E 24˚E 24˚E 25˚E 25˚E 26˚E 26˚E 27˚E 27˚E 28˚E 28˚E 29˚E 29˚E 30˚E 30˚E 41˚N 42˚N 43˚N 44˚N 45˚N Bucharest Craiova Constanta Plovdiv Sofia Ruse Pleven Varna Burgas
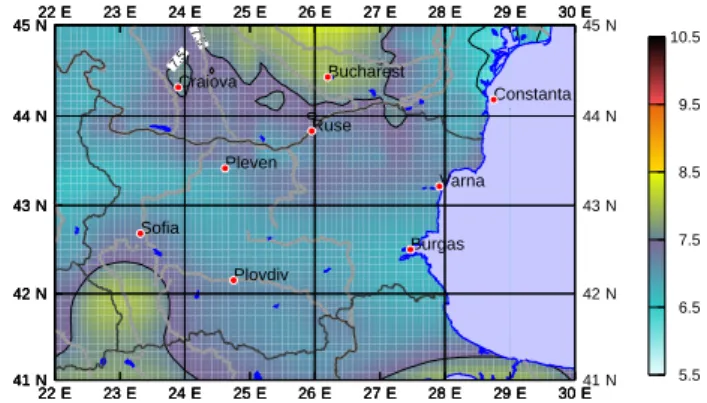
Fig. 4. Seismic hazard from all source zones for a recurrence period
of 475 years; colours represent intensities in MSK-1964 scale.
4 Results
The final seismic hazard map for a recurrence period of 475 years in Fig. 4 is a combination of the two maps, for nor-mal depth source zones (Fig. 2) and for the Vrancea inter-mediate depth zone (Fig. 3). The influence of the Vrancea intermediate depth zone on the seismic hazard for Bulgaria is important only to its Northern part. The building code EC 8 recommends a recurrence period of 475 years (probability of exceedance of 10% in 50 years) for the design earthquake (Fig. 4). Besides, in order to limit the damage of buildings and financial loss in case of weaker earthquakes with higher frequency of occurrence, a second hazard level in EC8 is rec-ommended in addition, corresponding to a recurrence period of 95 years (probability of exceedance of 10% in 10 years), (Fig. 5).
Special structures like nuclear power plants and large dams are beyond the scope of EC 8, as they require higher safety standards, including longer recurrence periods, e.g. 2475 years (2% in 50 years) for dams and 10 000 to 100 000 years for nuclear facilities. Figure 6 shows the seismic hazard for a recurrence period of 10 000 years in order to give decision
22˚E 22˚E 23˚E 23˚E 24˚E 24˚E 25˚E 25˚E 26˚E 26˚E 27˚E 27˚E 28˚E 28˚E 29˚E 29˚E 30˚E 30˚E 41˚N 41˚N 42˚N 42˚N 43˚N 43˚N 44˚N 44˚N 45˚N 7.5 45˚N 7.5 5.5 6.5 7.5 8.5 9.5 10.5 22˚E 22˚E 23˚E 23˚E 24˚E 24˚E 25˚E 25˚E 26˚E 26˚E 27˚E 27˚E 28˚E 28˚E 29˚E 29˚E 30˚E 30˚E 41˚N 42˚N 43˚N 44˚N 45˚N 22˚E 22˚E 23˚E 23˚E 24˚E 24˚E 25˚E 25˚E 26˚E 26˚E 27˚E 27˚E 28˚E 28˚E 29˚E 29˚E 30˚E 30˚E 41˚N 42˚N 43˚N 44˚N 45˚N Bucharest Craiova Constanta Plovdiv Sofia Ruse Pleven Varna Burgas
Fig. 5. Seismic hazard from all source zones for a recurrence period
of 95 years; colours represent intensities in MSK-1964 scale.
22˚E 22˚E 23˚E 23˚E 24˚E 24˚E 25˚E 25˚E 26˚E 26˚E 27˚E 27˚E 28˚E 28˚E 29˚E 29˚E 30˚E 30˚E 41˚N 41˚N 42˚N 42˚N 43˚N 43˚N 44˚N 44˚N 45˚N 45˚N 8.5 8.5 8.5 9.5 9.5 5.5 6.5 7.5 8.5 9.5 10.5 22˚E 22˚E 23˚E 23˚E 24˚E 24˚E 25˚E 25˚E 26˚E 26˚E 27˚E 27˚E 28˚E 28˚E 29˚E 29˚E 30˚E 30˚E 41˚N 42˚N 43˚N 44˚N 45˚N 22˚E 22˚E 23˚E 23˚E 24˚E 24˚E 25˚E 25˚E 26˚E 26˚E 27˚E 27˚E 28˚E 28˚E 29˚E 29˚E 30˚E 30˚E 41˚N 42˚N 43˚N 44˚N 45˚N Bucharest Craiova Constanta Plovdiv Sofia Ruse Pleven Varna Burgas
Fig. 6. Seismic hazard from all source zones for a recurrence period
of 10 000 years; colours represent intensities in MSK-1964 scale.
10-4 10-3 10-2 10-1 7.0 7.5 8.0 8.5 9.0 9.5 Intensity (MSK) annual pr obab ilit y of ex ceedance
Fig. 7. Seismic hazard curve for Sofia city.
makers first information for regional planning. This map of course can not replace site specific expertises.
A hazard curve for the capital Sofia, extracted from the hazard data set, is presented in Fig. 7.
Acknowledgements. We are grateful to L. Ardeleanu and K.-P.
Bonjer for their critical and constructive review. The stay of
S. D. Simeonova and D. E. Solakov in the Federal Institute for Geosciences and Natural Resources, Hannover, Germany, was supported by the German Federal Ministry of Economics and Technology as part of the programme “South East Europe Partnership for Qualification”.
Edited by: P. F. Biagi
Reviewed by: L. A. Ardeleanu and K.-P. Bonjer
References
Ardeleanu, L., Leydecker, G., Bonjer, K.-P., Busche, H., Kaiser D., and Schmitt, T.: Probabilistic seismic hazard map for Romania as a basis for a new building code, Nat. Hazards Earth Syst. Sci., 5, 679–684, 2005,
http://www.nat-hazards-earth-syst-sci.net/5/679/2005/.
Boyanov, I., Dabovski, Ch., Gocev, P., Harkovska, A., Kostadinov, V., Tzankov, Tz., and Zagorchev, I.: A new view on the Alpine tectonic evolution of Bulgaria, Geol. Rhodopica, 1, 107–122, 1989.
Bonchev, E., Bune, I., Christoskov, L., Karagjuleva, J., Kostadi-nov, V., Reisner, G., Rizhikova, S., Shebalin, N., Sholpo, V., and Sokerova, D.: A method for compilation of seismic zoning prog-nostic maps for the territory of Bulgaria, Geol. Balcanica, 12(2), 2–48, 1982.
Christoskov, L., Grigorova, E., Sokerova, D., and Rijikova, S.: New catalogue of the earthquakes in Bulgaria for the period V century BC to XIX century (1899), Archives of the Geophysical. Inst., Bulg. Acad. Sci., (unpublished), 1979 (in Bulgarian).
Cornell, C.: Engineering Seismic Risk Analysis, BSSA, 5, 1583– 1606, 1968.
Dachev, H., Vaptzarov, I., Filipov, L., Solakov, D., Simeonova, S., and Nikolova, S.: Investigations and activities for increasing of the seismic safety of the PNPP Belene site, Geophysical Institute Final Report, (unpublished), p. 250, 1995,.
Grigorova, E., Sokerova, D., Christoskov, L., and Rijikova, S.: Cat-alogue of the earthquakes in Bulgaria for the period 1900–1977, Archives of the Geophysical. Inst., Bulg. Acad. Sci. (unpub-lished), 1979 (in Bulgarian).
K´arn´ık, V.: Seismicity of Europe and the Mediterranean, Academic publishing house of Czech Republic, 1996.
K¨ovesligethy von, R.: Seismischer St¨arkegrad und Intensit¨at der Beben, Gerlands Beitr¨age zur Geophysik, Band VIII, Leipzig, 1907.
McGuire, R.: Computations of seismic hazard, Annali di Geofisica, 36(3–4), 181–200, 1993.
McGuire, R.: FORTRAN Computer Program for Seismic Risk Cal-culations, U.S. Geol. Surv. Open-File Rep. 76–67, p. 90, 1976. Orozova-Stanishkova, I. and Slejko, D: Seismic Hazard of Bulgaria,
Natural Hazards, 9, 247–271, 1994.
Papazachos, B. C., Cominakis, P. E., Karakaisis, G. F., Karakostas, B. G., Papaioannou, Ch. A., Papazachos, C. B., and Skordilis, E. M.: A catalogue of earthquakes in Greece and surrounding area for the period 550 BC–1999, Publ. Geoph. Lab. Univ. of Thessaloniki, 1, 333p, (data file), 2000.
Papazachos, B. C., Cominakis, P. E., Skordilis, E. M., Karakaisis, G. F., and Papazachos, C. B.: A catalogue of earthquakes in the Mediterranean and surrounding area for the period 1901–2004, Publ. Geoph. Lab. Univ. of Thessaloniki (data file), 2005. Shebalin, N. V., Leydecker G., Mokrushina, N., Tatevossian, R.,
Erteleva, O., and Vassilev, V.: Earthquake Catalogue for Central and Southeastern Europe, European Commission, Report No. ETNU CT93-0087, Brussels, http://www.bgr.de/quakecat, 1998. Sokerova, D., Simeonova, S., Nikolova, S., Solakov, D., Botev, E., Glavcheva, R., Dineva, S., Babachkova, B., Velichkova, S., Maslinkova, S., Donkova, K., Rizikova, S., Arsovski, M., Ma-tova, M., Vaptzarov, I., and Filipov, L.: Geomorphology, neo-tectonic, seismicity and seismotectonic of NPP Kozloduy, Geo-physical Institute Final Report (unpublished), p. 200, 1992. Solakov, D. and Simeonova, S. (Eds.): Bulgaria Catalogue of
Earth-quakes 1981–1990, Sofia Press, p. 40, 1993.
Solakov, D., Simeonova, S., and Christoskov, L.: Seismic hazard assessment for Sofia area, Annali di Geofisica, 44(3), 541–556, 2001.
Sponheuer, W.: Methoden zur Herdtiefenbestimmung in der
Makroseismik. (Methods for depths estimation in macroseismic), Freiberger Forschungs-Hefte C 88, 117 pp., Akademie Verlag Berlin, 1960.
Stepp, J.: An investigation of earthquake risk in the Puget Sound area by use of the type I distribution of large extremes, Ph.D. thesis, Pennsylvania Univ., p. 131, 1971.
van Eck, T. and Stoyanov, T.: Seismotectonics and seismic hazard modeling for Southern Bulgaria, Tectonophysics, 262, 77–100, 1996.
Zagorchev, I.: Neotectonic of the central parts of the Balkan Penin-sula: basic features and concepts, Geol. Rundsch., 81(3), 635– 654, 1992.