HAL Id: hal-00138992
https://hal-insu.archives-ouvertes.fr/hal-00138992
Submitted on 17 Apr 2007
HAL is a multi-disciplinary open access archive for the deposit and dissemination of sci-entific research documents, whether they are pub-lished or not. The documents may come from teaching and research institutions in France or abroad, or from public or private research centers.
L’archive ouverte pluridisciplinaire HAL, est destinée au dépôt et à la diffusion de documents scientifiques de niveau recherche, publiés ou non, émanant des établissements d’enseignement et de recherche français ou étrangers, des laboratoires publics ou privés.
Effect of the increase in temperature on the evolution of
the physical and chemical structure of vitrinite
A. Jimenez, María José Iglesias, Fatima Laggoun-Défarge, Isabel Suarez-Ruiz
To cite this version:
A. Jimenez, María José Iglesias, Fatima Laggoun-Défarge, Isabel Suarez-Ruiz. Effect of the increase in temperature on the evolution of the physical and chemical structure of vitrinite. Journal of Ana-lytical and Applied Pyrolysis, Elsevier, 1999, 50, pp.117-148. �10.1016/S0165-2370(99)00027-3�. �hal-00138992�
Effect of the increase in temperature on the evolution of
the physical and chemical structure of vitrinite
Amalia Jiméneza, M. José Iglesiasa, Fatima Laggoun-Defargeb and Isabel Suárez-Ruiz, a a Instituto Nacional del Carbón (CSIC), Ap.Co., 73, 33080- Oviedo, Spain
b UMR 6531/FR 09 CNRS/Université d’Orléans, Bâtiment de Gèosciences, BP 6759, 45067-
Orléans, France
Abstract
The effect of the progressive increase in temperature (off-line pyrolysis in an open-medium system) on a monomaceralic coal (low rank and pure vitrinite) has been studied on the basis of changes in its chemical and physical structure. The properties of the solid residues and liquid effluents obtained were studied using a wide range of petrographic and geochemical techniques. Results support the validity of this pyrolysis method for following the physico– chemical processes that occur in vitrinite of bituminous coal rank. Of special interest is the information concerning the control of the structure on the vitrinite reflectance parameter in the bituminization stage. The evolution of properties and changes occurring at this stage show that the increase in vitrinite reflectance is strongly related and depends on changes in the chemical structure of this maceral during heating rather than on changes in elemental composition. However, any relationship between reflectance and chemical properties needs to be established empirically. The mechanism during heating consists of a complex mixture of depolymerization and condensation reactions with the progressive homogenisation of the botanical structure of the vitrinite. Moreover, pyrolysis conditions lead to a rapid and massive expulsion of the thermally generated products, causing a significant decrease in the H/C atomic ratio and higher thermostability of the solid residues. The enhancement of cross-linking with the formation of C–O–C bridges, which have high activation energy also contributes to an increase in thermal stability. Results obtained from the production and expulsion of oil suggest that this method is suitable for providing an estimation of the amount of hydrocarbons that might be produced and migrate from coals of similar rank. This is of special interest for coals with significant petroligenous potential or for coals that are gas-prone, depending on their composition and rank.
Author Keywords : Coal; Vitrinite; Reflectance; Physical structure; Chemical structure;
1. Introduction
The vitrinite maceral group (huminite in low-rank coals) is a very complex organic material that mainly derives from the lignin, cellulose and tannins, which were present in vegetal precursors (higher plants). Vitrinite is also the major organic component in most humic coals [1] and consequently affects their behaviour in industrial processes where an increase in temperature is normally involved. Vitrinite frequently appears as dispersed particles (isolated or together with other organic components) in sedimentary rocks from the Devonian period. Temperature is the main factor that causes complex chemical reactions [2, 3, 4 and 5], which produces gradual changes in the properties of the vitrinite during natural coalification. It is just one of these properties, i.e. reflectance, (the parameter which indicates rank or degree of evolution of the organic matter) that is widely used to predict other characteristics. Vitrinite reflectance is also significant in the characterisation of coal blends employed in combustion, carbonisation and other conversion processes.
Much attention has been given to the study of the vitrinite group in order to understand its evolution and its transformations with increasing coal rank or during its utilisation in pyrolysis processes. However, a detailed study of this component always presents several problems. Firstly, vitrinite normally appears in association (in different percentages) with other coal components of variable composition and properties such as liptinite and inertinite macerals. Thus, the behaviour of the vitrinite during thermal increase (coalification or pyrolysis) is clearly influenced by the other coal components. In order to solve this problem, mechanical and physico–chemical techniques for components separation have been developed [6, 7, 8 and 9], giving some interesting results. However using the method of hand-picking to obtain pure vitrains is one of the best ways of studying this maceral where no previous treatment is involved. The second important constraint is that natural and isolated vitrinites of increasing rank that form a continuous evolution series are extremely rare. For this reason simulating organic evolution through different pyrolysis systems might be a useful procedure [10, 11, 12 and 13]. In general, these experiments have provided useful information about phenomena that occur during the evolution of vitrinite and coals.
The aim of this work is to study the physical and chemical transformations of a low-rank and pure vitrinite during thermal treatment via pyrolysis in the rank equivalent to the bituminization interval. For this purpose, the work was conducted on the basis of: (a) a study of the changes in the chemical and physical structure of the vitrinite by analysing its behaviour during the pyrolysis process; (b) determination of the relationships between the evolution of the physical structure, textural and chemical changes induced by an increase in temperature in the vitrinite. Chemical reactions involved in the process are also investigated. All of these data and the relationships between them may contribute to the understanding of problems related with the abnormal and unexpected behaviour of certain coals due to the anomalous properties of vitrinite. This is especially the case with coals in which vitrinites change their properties in an anomalous and different way during natural coalification, i.e. vitrinites whose reflectance is suppressed, resulting in a modification of all of their properties even when the natural evolutionary processes are achieved.
2. Experimental procedures and analytical methods
The sample used in this work is a low-rank vitrinite, which was hand-picked in a vitrain bank (in working mining areas) from the Carboniferous coal formation of Montçeau-les-Mines in the Central Massif, France. This vitrinite is characterised [14, 15 and 16] by a very pure organic composition (1.5% wt. ash) and is made up almost exclusively of the vitrinite maceral group such as telinite (73.5% vol. mmf) with well-preserved cell structures and lesser amounts of collinite (22.2% vol. mmf) that fill up the cellular cavities of telinite. Telocollinite
(3.1% vol. mmf) and vitrodetrinite (1.1% vol. mmf) are also found but in smaller amounts. The data of this vitrinite are typical of a kerogen type III and its degree of evolution corresponds to the diagenesis/catagenesis transition, at the beginning of the bituminization stage. Thus, a significant proportion of its properties are intact [14].
This sample was pyrolysed at different temperatures in an off-line open-medium pyrolysis system (using Gray-King Assay Oven Type) following a modified procedure described by Suárez-Ruiz et al. [17]. Liquid and gas effluents were collected for their quantification and further analysis. The particle size used was 1 mm. Each experiment was carried out in a quartz reactor isothermally for 10 h with a 25°C increase over a temperature range of 300– 450°C. At the end of the processes the amount of solid residue and effluents was determined in order to obtain the transformation ratio at each stage of thermal evolution.
The solid residues were studied by means of petrographic and geochemical techniques. Optical microscopy observations were carried out with a MPVII Leitz microscope in reflected white light using oil immersion lenses. The reflectance was determined according to standard procedures (ISO 7404/5 1984). Observations by means of fluorescence microscopy were achieved with a MPVII Leitz apparatus, using water immersion lenses and blue-violet light excitation. The vitrinite ultrastructure was studied on grains crushed to <1 mm using a SEM Zeiss-DSM 942 instrument. Transmission electron microscopy (TEM) determinations were performed on ultra-thin sections using a STEM Philips CM-20 instrument [18]. The X-ray diffraction (XRD) analyses were carried out after being crushed to <63 μm, using a Siemens-5000 X-Ray Diffractometer and cooper Kα radiation. Crystalline parameters such as the mean interlayer spacing of the aromatic sheets [2d(002)] following the Bragg law (Eq. (1)), the height
of aromatic layers (Lc) deduced from the Scherrer formula (Eq. (2)) and the averaged number
(N) of aromatic layers (Eq. (3)) were calculated from band (002):
where θ is the Bragg angle of the diffraction maximum, λ=1.5406 Å (wavelength for Cu radiation), β represents the angular width of the (002) band at half height corrected for the natural angular breadth of the line for a well crystallised specimen.
Proximate analysis was carried out and calorific value was determined following International Standard Procedures (ISO-589 1981; ISO-1171; ISO-562 1981 and ISO-1928). Ultimate analyses were performed in a microanalyzer Carlo-Erba CHS-O 1108 and Rock-Eval pyrolysis was carried out in accordance with Espitalié et al. [19 and 20]. The samples were prepared for FTIR analysis, using the traditional procedure for this type of material [21, 22 and 23] (KBr pellets, coal:KBr mixture at a 1:100 ratio). The semiquantitative data given in the text are the average value of several determinations using different KBr pellets. Thus, any differences in grinding or weight between pellets are minimised. All absorbance spectra were recorded on a Perkin-Elmer 1750 and analysed following procedures described by Iglesias et al. [15].
A fraction of the solid residues obtained at each pyrolysis temperature was extracted, using chloroform in an ultrasonic bath at room temperature in order to obtain the extraction yields
and the subsequent organic fractions following the standard procedures previously described [17]. Only the saturated fraction was analysed by gas chromatography (GC). The carbon preference index (CPI25–32) was also determined [24].
The chromatographic study of the oils generated was carried out, using a Hewlett-Packard HP 6890 gas chromatograph equipped with flame ionization detection (FID). A HP-5 (crosslinked PHME siloxane) capillary column [30 m×0.32 mm inner diameter (I.D.)] was used with hydrogen as carrier gas at a flow rate of 1.4 ml min−1. The splitting ratio was 1:24. The detector and injector temperatures were 275°C and the column temperature was programmed from 50 to 300°C at 4°C min−1. For gas chromatographic analysis, the samples were dissolved
in dichloromethane and kept a few minutes in an ultrasonic bath in order to obtain total dissolution. A volume of 1 μl was injected and four determinations were made. The identification of the compounds was carried out by means of GC/mass spectrometry (MS), using a Finningan GCQ gas chromatograph equipped with mass detection. The working conditions were similar to those used in the chromatographic analysis (SE-54 capillary column; detector temperature: 325°C and and injector temperature: 275°C and column temperature program from 50 to 290°C at 4°C min−1).
3. Results and discussion
The evolution of vitrinite reflectance during the increase in temperature (Fig. 1) shows that heating at 300°C (for 10 h) only produces a slight increase in this parameter. Above this temperature reflectance increases from 0.74% at the 325°C stage to 1.94% at the 450°C stage. According to the values obtained, the evolution stage of the residue at 300°C is equivalent to the subbituminous/bituminous transition as in the case of the raw material. For the other pyrolysis residues, the values of reflectance indicate that they are located inside the bituminous coal rank (catagenesis phase). This phase corresponds to the main stage of oil and wet gas formation due to the degradation of the structure of organic matter. Several reactions of cleavage and condensation occur at this stage of evolution or bituminization (0.5%<vitrinite reflectance<1.3%), this being one of the most interesting phases of coal coalification in which coal properties undergo significant changes. The rapid response of reflectance to the changes taking place within the vitrinite is why vitrinite reflectance is thought to give very precise results in coals and sediments of this rank level.
3.1. Mass balance
The progressive increase in the pyrolysis temperature of the vitrinite leads to the release of water, oil and gas. The amount of products collected at each stage of pyrolysis is depicted in Fig. 2. Most water is produced at 300°C, deriving from the water trapped in the coal network and deoxygenation of organic matter. The amount of gas is always higher than the oil, in agreement with the vitrinitic composition of the raw material (gas-prone material).
A comparison between Fig. 1 and Fig. 2 makes it possible to establish relationships between the global yields of the products ( Fig. 2) and the evolution of vitrinite reflectance ( Fig. 1). The value obtained for vitrinite reflectance at the 300°C stage (0.55%) indicates that the supply of energy is not sufficient to degrade the vitrinite structure. Thus, bituminous substances like oil were not recovered at this stage but they were obtained at 325°C, when vitrinite reflectance reached 0.74%. This oil yield indicates that the bituminization range has been reached. Gas generation at the low temperatures (300 and 325°C stages) is due to the release of the gases occluded in the vitrinitic network (non-thermal gas) and also to the thermal cracking of the aliphatic hydrocarbons with low dissociation energy from the vitrinite matrix [25]. It is known that gas and condensates can be formed via direct generation from
macerals such as resinite and vitrinite at rank levels as low as 0.4–0.6% of vitrinite reflectance [26]. In this work, the oil/bituminous substances were generated over a vitrinite range of 0.55–1.90% but maximum oil generation and expulsion appeared at values of vitrinite reflectance higher than 1.1%. Although the range of vitrinite reflectance is wider than that usually given [27], it agrees with the data reported by Garcia-Gonzalez et al. [28] for natural vitrinite-rich coals. The gas generated above 350–375°C agrees with the thermal degradation of the generated oil/bitumen (secondary cracking). It is also possible that for the most severe treatments, gaseous products arise from condensation reactions within the vitrinite network with the release of light products. The beginning of secondary cracking at vitrinite reflectance values <1.3% is interpreted as the enhancement of reactions of secondary cracking due to the use of high temperatures and absence of pressure during the thermal evolution of this vitrinite. All of the results above exposed are expected from the evolution of vitrinite reflectance with increasing temperature (Fig. 1). In the natural evolution series of vitrinite [29] the most important chemical transformations for samples with reflectance values <0.7% involve the formation of isolated aromatic rings which is mainly due to the loss of oxygen contained in functional groups. Reflectance, therefore, is not significantly affected as shown in Fig. 1. Above 0.7% of reflectance the rapid degradation of the vitrinite structure involves the rupture of C–C bonds to generate hydrocarbons and the removal of hydrogen to produce unsaturated bonds in aliphatic chains between isolated aromatic rings. These unsaturated bonds are converted into aromatic rings so that polycyclic aromatic systems are formed. Such systems induce changes in the optical properties of vitrinites and as a result reflectance increases much faster than in stages of low rank vitrinites.
3.2. Evolution of the vitrinite physical structure during increase temperature
The modifications of the physical structure of vitrinite due to the strong chemical transformations during thermal treatment were followed from the study of the texture and ultrafine structure of this component.
3.2.1. Evolution of the microscopical texture and structure
The optical characteristics of the raw sample which display a cellular structure (Plate 1a) and their relatively good definition are maintained up to the 350°C stage, although here a loss of definition (Plate 1b) from homogenisation is also observed. The homogenisation of the vitrinite is due to the increase in rank from subbituminous to bituminous coal rank (see the vitrinite reflectance values, from 0.53% at the 25°C stage to 0.83% at the 350°C stage). In general, the vitrinite particles are angular, flat and without porosity and relief up to 375°C. At this stage and above this temperature the original botanical structures of the vitrinite are difficult to discern by means of optical microscopy ( Plate 1c, 1d). The destructured vitrinite particles show a homogeneous appearance but with significant relief ( Plate 1d). A development of porosity is observed at 400°C in the form of small-size pores (<10 μm) with a parallel distribution inside the vitrinite particles ( Plate 1c). The development of porosity at 400°C occurs at 1.34% of vitrinite reflectance just before the maximum amount of oil is recovered ( Fig. 1 and Fig. 2). In the natural series for this stage of evolution, the organic matter structure is dislocated and the liquid phase is more easily expelled. In agreement with the results obtained, the specific reactions of secondary cracking have already started. At 450°C the homogenisation of botanical structures is complete and the development of porosity is considerably increased ( Plate 1d). This increase produces a large amount of vacuoles, which coalesce. These vacuoles are of a large size (5–50 μm) and are distributed in parallel bands ( Plate 1d) in agreement with the intensification of secondary cracking (oil cracking) reflected by the increase in gas production ( Fig. 2). At this stage (450°C), the vitrinite particles show rounded edges. The progressive homogenisation of the botanical
structure of the vitrinite and the formation of a porous texture are due to the successive sequence of generation and expulsion of liquid hydrocarbons produced by the primary cracking and devolatilization process during the secondary cracking (oil/bitumen). Moreover, the changes in morphology observed in the vitrinite during its thermal evolution are consistent with the increase in vitrinite reflectance ( Fig. 1). The absence of anisotropy in the more evolved pyrolysis residues (450°C stage) shows that the metagenesis stage has not yet been reached and so the aromatic layers are not sufficiently oriented, as will be explained later. The optical study indicates that the experimental conditions used in this work favour the formation of a fissure network in the vitrinite structure (micrometric) and a pore system that is more open (Plate 1d) than the one developed in natural coalified coals. This kind of structure, induced by pyrolysis treatment, favours the rapid and massive expulsion of all of the generated products, there being no product retention. However, in the bituminous coal rank, the liquid products generated in the bituminization range can be assimilated by adsorption and probably also chemically within the macromolecular network of the vitrinite. These compounds act as a mobile phase [30] during this stage of evolution and are responsible for secondary fluorescence in vitrinites, whose maximum intensity is produced at c.a 0.9% vitrinite reflectance. For the artificial series of vitrinite generated in open pyrolysis, secondary fluorescence was not observed. This is due to the expulsion of the liquid products generated from this vitrinite during the thermal treatment (favoured by the extensive fracturing and a development of a porous network). The rapid rise in temperature, the high temperatures used, the small grain size and the specific nature of this sample are favourable conditions for the almost total expulsion of generated products.
3.2.2. Ultrafine structure
Scanning electron microscopy (SEM) makes it possible to follow the gradual evolution of the vegetal structures of the raw vitrinite during the pyrolysis process. Raw vitrinite (25°C stage) is revealed to have cellular walls with lamination features of a granular texture (Plate 2a). The occurrence of this lamination would reflect the low degree of gelification [31] of the cellular walls in agreement with the rank at the beginning of the bituminization stage. The material filling up the cell cavities is less compact. When the temperatures of pyrolysis are increased (300, 325 and 350°C) a progressive homogenisation is detected in the material that fills up the cavities and the boundary between wall and cavities. Although TEM observations do not show substantial changes in the structure of the organic material at the 300°C stage, devolatization vacuoles with a size <3 μm can be observed by means of SEM. These vacuoles are developed in the filled cavities and may be related to the loss of water and free hydrocarbons trapped in the vitrinite network. Granular features observed inside the cellular walls of the raw vitrinite are lost at the 325°C stage ( Plate 2b). TEM investigations also show that the most significant transformation in the vitrinite structure begins at 325–350°C stage in agreement with vitrinite reflectance ( Fig. 1). The degradation of the vitrinite structure is considerable at 350°C due to the primary generation of hydrocarbon/bituminous substances. Further thermal treatment produces an increase in the number and size of such vacuoles and they coalesce at 400°C. For all the pyrolyzed vitrinites, the laminar structures of the cellular walls are maintained, their homogenisation being more marked at the higher temperatures (400°C, Plate 2c) when the structure becomes more ordered (see crystalline structure). The filling of the cavities is totally gelified at 450°C ( Plate 2d).
The evolution of the texture observed by SEM reflects the gradual reorganisation of the macromolecular network as a result of heating. Chemical reactions during thermal treatment do not significantly modify the physical structure of vitrinite, in particular that of telinite
because remains of laminate walls are observed at 450°C. Modification of the filled cavities begins at low temperatures whereas the walls are visible at higher temperatures. This shows that these components have a different chemical composition. The greater gelification of the filled cavities and the appearance of devolatilization vacuoles could be related to the higher plasticity of the filling material.
3.2.3. Crystalline structure
Changes in the structure of carbonaceous material during the pyrolysis process were followed by XRD analysis and results obtained are shown in Table 1. Fig. 3 shows the XRD spectra of the raw vitrain and the most significant features of the residues of pyrolysis. Samples obtained at 375 and 450°C have undergone the most important changes while those obtained at 300, 325 and 350°C are similar to the raw vitrinite. This was expected because in the first stages of evolution, the structure of carbonaceous matter is not really organised. In general, the XRD pattern obtained for all the samples studied here is similar to those of other disordered carbons [32]. All of the samples clearly show a maximum peak at 25°C (2θ) corresponding to the (002) band, which is variable for vitrinites in different pyrolysis stages. The weakness and width of the (10) band (Fig. 2) however make it impossible to measure the crystalline diameter reported for other carbon materials [32 and 33].
Table 1. Crystalline parameters from (002) band for pyrolysed vitrinites
Table 1 shows the crystalline parameters obtained from the (002) band for vitrinite in different stages of pyrolysis. Except for the sample obtained at 300°C, the interlayer spacing (d002) progressively decreases from the raw vitrinite to the sample obtained at 450°C stage.
This parameter is characteristic of the tridimensional order and its decreasing trend indicates that heating progressively produces more ordered structures. The unexpected increase in this value at 300°C could again be related to changes in the structure caused by the expulsion of water and free hydrocarbons physically trapped in the vitrinite network. These results clearly show that heating at 300°C does not modify the physical structure of the vitrinite in agreement with the yield type of the mobilised products (Fig. 2) and also with the results obtained by optical microscopy and the SEM study. For the other pyrolysed samples the changes in physical structure (in response to chemical changes) are reflected in the variation of the values obtained for the interlayer spacing (d002, Table 1). This parameter decreases as
the degree of evolution increases due to the condensation of the aromatic units responsible for the increase in vitrinite reflectance [29].
The values of Lc (Table 1) corresponding to the stack height increase with the increase in
pyrolysis temperature and vitrinite reflectance from the raw material (≈6.49) to 450°C (≈11). The number of aromatic layers (<N>) only increases for the residues obtained at 400 and 450°C when the oils start to crack. The highest increase in the mean stacking size of aromatic layers (Lc) and their number (<N>) was obtained above 375°C (Table 1). From these results, it
structural point of view by an increase of the aromatic layers as well as the stacking size of the aromatic layers.
3.3. Evolution of the chemical structure
3.3.1. Chemical analysesFig. 4 shows the evolution of the moisture content and the yield in water at each temperature stage. Heating at 300°C produces a drying effect as is indicated by the strong decrease in moisture content. This confirms the significant contribution of water trapped in the vitrinite network to water production at this stage (Fig. 2). However, a comparison between the evolution of the water released and moisture content also shows that dehydration reactions take place throughout the entire pyrolysis process. Such reactions involve phenolic groups, which form ether linkages. An increase in cross-linking as result of heating can therefore be expected.
The evolution of volatile matter content and weight loss after pyrolysis is shown in Fig. 5a. In spite of the decrease in weight at 300°C, the fact that volatile matter content does not vary, again confirms the importance of the loss of moisture at this stage. Above this temperature a similar trend in both parameters was found but in general the decrease in volatile matter is higher than the decrease in weight. This is particularly marked between 300–325°C and in the 400–450°C range of temperatures. The strong decrease in volatile matter at 400–450°C can be attributed to the removal of aliphatic and alicyclic groups as well as aromatization reactions. During heating, aliphatic structures can be removed by cracking reactions, which are favoured by the presence of branched structures [25]. The dehydrogenation of hydroaromatic structures or the ring formation of the alkyl groups followed by dehydrogenation also produces an increase in aromatization [34]. Consequently, the variation in volatile content is related with weight loss during pyrolysis ( Fig. 2). This can be ascribed to the higher contribution of aromatization reactions in the stages mentioned. In natural coalification, for a rank range similar to that of the artificial series ( Fig. 1), vitrinite reflectance rises almost in the same degree as volatile matter falls, because both parameters are related to the degree of aromatization of the vitrinite structural units. In agreement with this, a good linear correlation was obtained between the volatile matter content and vitrinite reflectance values of the artificial series of vitrinite:
R0=2.8997−0.0647×V.M. (r=0.998)
Fig. 5b shows the correlation between the volatile matter content and vitrinite reflectance for the artificial series of vitrinite. They are compared with natural series from van Krevelen data [35]. As can be observed, the correlation obtained for the artificial series of this work fits the natural model.
The changes in elemental composition during the thermal evolution of the vitrinite are reflected in the modification of the atomic ratios H/C and O/C. The variation of these ratios for the artificial samples was plotted on the van Krevelen diagram (Fig. 6a) together with ratios derived from data of natural vitrinites [35]. This diagram shows a loss of hydrogen and oxygen contents and a gradual enrichment in carbon. The decrease in H/C values in the 350– 375°C range is consistent with the increase in oil/bitumen expulsion (bituminization range) and the beginning of specific reactions of secondary cracking (inferred by the increase in gas generation, see Fig. 2). Furthermore, the value of this ratio at 450°C is >0.5 ( Fig. 6a) indicating that the metagenesis phase was not reached, in agreement with the vitrinite
reflectance ( Fig. 1), the absence of anisotropy and the structural data mentioned above. However, above 350°C, the H/C atomic ratio decreases at a higher rate than in the natural series. This has been explained as the result of the dehydration trend [10, 13 and 36]. However, for the vitrinite studied here, the rapid departure of hydrogen must be attributed to the expulsion of oil /bitumen and its conversion into gas rather than dehydration reactions. The mobilisation of oil or bituminous substances is favoured by the structural features developed under these pyrolysis conditions (fractures and a pore system of large size, Plate 1 and Plate 2). Furthermore, as was just mentioned, the high temperature used in this experimental work enhances the reactions of secondary cracking.
As in the case of the H/C atomic ratio, the carbon content of the artificial vitrinites above 350°C is lower than expected for natural vitrinites with the same vitrinite reflectance [35] as shown in Fig. 6b. The unchanging carbon content and the increase in vitrinite reflectance is due to the conversion of aliphatic carbon into aromatic carbon for the 325–350°C and 400– 450°C ranges. This agrees with the higher contribution of aromatization reactions in these stages as suggested by the variation of volatile matter ( Fig. 5a). The results obtained from the correlations, carbon content/vitrinite reflectance and volatile matter/vitrinite reflectance ( Fig. 6b and Fig. 5b, respectively) show that vitrinite reflectance and variation in volatile matter reflects the changes which occur at these stages better than other parameters (carbon content). Volatile matter and carbon contents also allow the indirect calculation of the aromaticity factor. Although indirect methods of calculating the aromaticity of coals have gradually been replaced by direct methods based on solid 13CNMR, it should be emphasized that both direct
and indirect methods provide similar values [35]. Therefore through the expression:
fa=[(100−VMdaf)×1200]/[1240×Cdaf]
an initial approximation to aromaticity can be obtained. A comparison of the fa and R0 values
(Fig. 7) shows the excellent linear correlation between the two parameters. From these results it can be concluded that reflectance is related to the presence of benzene rings in the coal molecule (degree of aromatization and condensation) and not to total carbon content. Thus, vitrinite reflectance is related to quantitative structural changes rather than quantitative changes in elemental composition.
3.3.2. Rock-Eval pyrolysis
Values of the most significant parameters from Rock-Eval pyrolysis obtained using pyrolyzed vitrinites are shown in Table 2. The evolution trends of Tmax and vitrinite reflectance (Table 2,
Fig. 1) show a correlation (vitrinite reflectance=−3.70+0.0097 Tmax; r=0.99) similar to those
found in the literature [37 and 38]. However, for some stages of heating, Tmax increases faster
than vitrinite reflectance, indicating a different degree of evolution. Thus, Tmax and vitrinite
reflectance show a parallel variation below 375°C. On the other hand, for the 375°C stage and above the Tmax temperature increases more quickly than reflectance, especially in the 400 and
450°C stages, reaching values similar to those described for the dry gas phase (metagenesis). The limits of the values of Tmax for the different phases of organic evolution are given for
whole coals that contain varying amounts of different macerals. Tmax is, therefore, influenced
by petrographic composition while reflectance only depends on the presence of vitrinite. This could partially explain the differences found in the correlation between Tmax and vitrinite
reflectance values for the artificial samples (especially for stages of 375–450°C) in comparison with data for other coals [19 and 39]. On the other hand, that Tmax values are
higher with respect to the reflectance values measured is confirmed by data from Table 2. This table shows the good agreement between the vitrinite reflectance values measured and
those calculated from the Easy % R0 algorithm of Sweeny and Burhnam [37], confirming the
suitability of vitrinite reflectance as a rank parameter in preference to other parameters of a chemical type.
Table 2. Data of the most significant parameters deduced from Rock-Eval pyrolysis. Comparison between the reflectance values measured for the vitrains and those calculated from Easy % R0 modela [37]
The high values of Tmax found for these samples could be an indication of the high thermal
stability of the pyrolysis residues obtained in an open-medium compared to the results obtained for the same vitrinite in a confined medium [18 and 40] or to those described for the natural series of vitrinites, as was proposed by Monthioux and Landais [41]. The most feasible reason for the greater thermal stability of vitrinite is probably the total expulsion of hydrocarbons. In fact, thermal stability develops up to the 400°C stage (equivalent to the wet gas phase) at which point the vitrinite structure is considerably dislocated, leading to the massive expulsion of generated products ( Fig. 2). Furthermore, the pyrolysis process in this work favours cross-linking with the formation of C–O–C bridges through dehydration reactions and such bonds have high activation energy.
Table 2 also shows the decrease in the S1 peak at the 300°C stage due to the expulsion of
some of the free hydrocarbons present in the raw material because of heating. A comparison of the data from peaks S1 and S2 (Table 2) and vitrinite reflectance ( Fig. 1) shows that a
decrease in S2 and an increase in S1 values occurs for the vitrinite reflectance range of 0.55–
0.74% (300–325°C). This indicates that specific reactions of primary cracking take place in the 300–325°C range of temperature. Between 325 and 375°C the decrease in S2 implies
considerable thermal degradation of the vitrinite structure with the consequent expulsion of liquid effluents (Fig. 2). The expulsion of liquid products rich in hydrogen together with an increase in carbon content at these stages produces a sharp decrease in the atomic ratio H/C ( Fig. 6a). Therefore, the interval from 325 to 375°C (reflectance values between 0.7 and 1.08%) can be included in the bituminization range where oil (bitumen) generation is the most important process, in agreement with literature data [27 and 28]. The increase in S1 between
375 and 400°C and the decrease in S2 values between 375 and 450°C (Table 2) show that
parallel to the degradation of the vitrinite structure, a reorganisation of the structure takes place in agreement with the changes in physical structure (Lc and N values in Table 1).
3.3.3. Changes in functional groups with increasing pyrolysis temperature
Fig. 8 shows the FTIR spectra of the raw and pyrolyzed vitrinites. All of them show the same bands but differ in their relative intensity.
Fig. 9 shows the evolution of the OH concentration during thermal treatment of the vitrinite. The intensity of the band centred at 3400 cm−1 is plotted versus pyrolysis temperature. The structures present in the raw material, given its composition (telinitic) and rank, should be mainly phenolic [42]. During heating, the concentration of phenolic structures decreases as result of condensation reactions forming aryl ethers or dibenzofuran-like structures and the release of phenolic compounds. This loss of phenolic structures is mainly responsible for the decrease in the oxygen content of the pyrolysed vitrinites ( Fig. 6a). Accordingly, the OH
concentration trend ( Fig. 9) has to be parallel with the evolution of the O/C ratio ( Fig. 6a). The comparison of data shown in Fig. 6a (van Krevelen diagram) and Fig. 9 shows that both parameters follow a similar trend in all stages of temperature with the exception of the 300°C stage. Heating at 300°C produces a strong decrease in the intensity of the OH stretching mode (3400 cm−1) whereas no change in the O/C ratio was observed. The decrease in the intensity of this band at the 300°C stage cannot therefore be interpreted as a real decrease in the concentration of phenolic structures but is rather due to the loss of moisture at this stage as shown in Fig. 4. The raw material shows a high moisture content (11%) which is not totally eliminated by drying the pellet and hence the intensity of the phenolic OH stretching modes in this sample is enhanced by the contribution of the OH groups of water trapped in the coal network. On the other hand, according to the values of vitrinite reflectance ( Fig. 1), the decrease in OH concentration between 400 and 450°C suggests that phenols are components of minor importance for coals with vitrinite reflectance >1.34% as is the case for natural vitrinites [43].
The amount of aromatic hydrogen in vitrinites and coals normally increases as far of the beginning of the anthracite region [44 and 45]. The aromatic to aliphatic ratio increases as the rank increases, this increase being more pronounced towards the later bituminous coal stages [44 and 46]. In low-rank coals the degree of substitution is high so that the degree of substitution of part of the system is reduced. The dependence of the aromatic substitution on coal rank has been clearly revealed by the increase in the intensity of the 750 cm−1 mode (four adjacent aromatic C–H groups) as a function of vitrinite reflectance [46]. For pyrolyzed vitrinites, the aromatic to aliphatic hydrogen ratio (Har/Hal), the degree of substitution
(measured as %750) and the aromatic hydrogen concentration (Har) are depicted in Fig. 10 as
a function of vitrinite reflectance. As can be observed, a good correlation between the Har/Hal
ratio and vitrinite reflectance was obtained (Fig. 10a) and the increase in this ratio is more rapid up to 0.83% and especially between 1.34 and 1.94% of vitrinite reflectance. Thus, the intensification of aromatic over aliphatic hydrogen takes place after the high-volatile bituminous coal rank. During natural coalification a gradual loss of the mobile phase takes places at this stage as a result of cracking into gaseous products. The main aromatization reactions also take place here [30]. This agrees with the other results described above that show an intense degradation of the vitrinite structure up to 0.83% R0 (350°C stage) and in
particular between 1.34 and 1.94% R0 (400–450°C). The degradation of the vitrinite structure
(with a high degree of fracture) implies reactions that affect the substituents of the aromatic system so that the degree of substitution decreases. Fig. 10b shows that the decrease in the degree of substitution (%750) also takes place up to 350°C (0.83% R0). Furthermore, as in
natural vitrinites [45] the relative intensity of the 750 cm−1 mode correlates with the decrease in the intensity of the OH absorption band (Fig. 9 and Fig. 10b) except for the lowest severe treatment (300°C). This proves that the decrease in the OH absorption band at the 300°C stage is due to the loss of moisture rather than to a real decrease in the concentration of the phenolic groups.
The evolution of the aromatic C–H stretching modes (Fig. 10c) during pyrolysis (increase in vitrinite reflectance) shows three zones of different slope. In zone A (up to 350°C) the aromatic hydrogen increases as vitrinite reflectance increases from 0.53 to 0.83%. However, additional artificial coalification (zone B, between 350 and 375°C) causes an increase in vitrinite reflectance (0.83–1.34%) without any significant variation in aromatic hydrogen. This behaviour is understandable because the molecular structure and in particular the aromatic structure are the major factors affecting vitrinite reflectance [29]. Thus, this parameter increases with aromatization and condensation (increase in the size of the aromatic
units—see Lc parameter in Table 1). The results shown in Fig. 10c, therefore, suggest that up
to 0.83% R0 (350°C stage) the increase in vitrinite reflectance might be mainly due to the
formation of aromatic systems at the expense of reactions involving side chains. Between 0.83 and 1.34% of R0, condensation reactions, without any increase in aromatic hydrogen, seem to
be predominant. The formation of condensed systems agrees with the homogenisation of the vitrinite observed by means of optical and electronic microscopy. Finally, the relative strong increase in aromatic hydrogen between 1.34 and 1.94% of vitrinite reflectance (zone C) is ascribed to the removal of the residual substituent groups as a results of the severity of the thermal treatment (400–450°C). The results related to the evolution of the aromatic hydrogen agree with those of the evolution of volatile matter and weight loss (Fig. 5a) and the aromatization reactions during the artificial evolution.
The aliphatic C–H stretching modes in natural coals are strong over a considerable range of rank [44] including the zone of oil/bitumen generation (primary cracking) in which an intense consumption of aliphatic groups from the coal network is expected [41]. This is because of the low efficiency of coals in the expulsion of the generated liquid products. It is known that the vitrinitic material consists of submicroscopic pores in which generated liquid products are assimilated due to the decrease in pore diameter during the catagenesis [47]. With further coalification processes these liquid products are degraded to gas (secondary cracking) and expelled. The changes in aliphatic hydrogen concentration during the pyrolysis of vitrinite are shown in Fig. 11 where the intensity of the aliphatic C–H stretching modes is plotted versus vitrinite reflectance. The data for the pyrolysis residues in the 300–450°C range are qualitatively consistent with those of natural coals but the decrease in aliphatic hydrogen takes place earlier in the pyrolysed vitrains (between 0.83 and 1.08% R0). The lack of variation in
Hal between 300 and 350°C stages and the increase in oil yield (Fig. 2) points to the retention
of some of the liquid products generated. Above 350°C, when the vitrinite structure is highly dislocated ( Plate 1 and Plate 2) the unobstructed expulsion of the liquid products takes place and a strong decrease in aliphatic hydrogen is observed ( Fig. 11). The evolution of the aliphatic hydrogen totally agrees with the variation in the atomic ratio H/C ( Fig. 6a). From these results it can be concluded that reactions involving aliphatic structures during artificial evolution are different to those expected under natural evolution. Such a conclusion has also been reported in studies of artificial coalification of wood performed by means of confined pyrolysis [13]. This failure therefore to reproduce the results of natural evolution through pyrolysis must be related to the conditions used in the laboratory rather than to the specific pyrolysis method used.
The significant decrease in the intensity of the aliphatic stretching vibrations at 300°C (Fig. 11) without variation in H/C ( Fig. 6a) was also surprising. This result can be rationalised as the effect of the extinction coefficients rather than as a real decrease in concentration. The infrared analysis of the raw material after its extraction with chloroform also shows a significant decrease in the intensity of the aliphatic stretching modes and the value obtained is very close to that found for the pyrolysis residue at 300°C ( Fig. 11). It is unlikely that the low amount of chloroform soluble material in the raw material (0.30%) [16] can affect its bulk properties and so no variation in the elemental composition after extraction was obtained. The compounds extracted with chloroform (affecting the extinction coefficients of the aliphatic bands) can also be expelled by heating at 300°C (decrease in S1 in Table 2). The effect of the
nature of the aliphatic structures in the pyrolysed samples on the extinction coefficients is confirmed in the values of the A factor which gives an estimation of the proportion of the aliphatic over aromatic structures. The value of this factor ( Fig. 12a), calculated through the intensities of the aromatic band at 1600 cm−1 and the aliphatic stretching modes [15], does not vary for the pyrolysis residue at 300°C with respect to the raw material in spite of the
decrease in Hal (Fig. 11). The A factor was also useful for measuring the degree of evolution
and oil potential of source-rocks, coals and vitrains [15 and 48]. For the pyrolysed vitrinites, Fig. 12b and c show the good correlation obtained between this factor and both vitrinite reflectance (b) and the S2 parameter (c).
3.3.4. Soluble fraction
The analysis of the soluble fraction of coal is very important for understanding changes in chemical structure during thermal evolution. In this work, the behaviour of the pyrolyzed vitrinites during extraction with chloroform and the qualitative and semiquantitative GC/MS analyses of the generated oils were also studied.
The values of the extraction yield and the carbon preference index (CPI25–31) are given in
Table 3. The evolution of CPI in the pyrolysed vitrinites agrees with the natural pattern [49]. The odd/even predominance in the install stages is consistent with oil generation during primary cracking. The decrease between 350 and 375°C reflects the shift from a predominance of n-alkane generating reactions to predominantly alkane–cleavage reactions in agreement with the processes and reactions of secondary cracking occurring in this range of temperatures. However, the distribution of the n-alkanes in the series of vitrinites does not reflect the natural trend. During the natural evolution of vitrinites, alkanes between n-C20 and
n-C29 show maximum concentrations at ca. 84% of carbon content while the amount of n-C17,
n-C18 and n-C19 increases up to a rank of 85.4% C [50]. In contrast, in pyrolysed vitrinites
carried out by means of the open-medium system the n-alkane distribution is always centred around C25–C26 and the decrease in C17–C19 is found to occur too early. This again suggests
that experimental conditions favour an early degradation of the bitumens/oil generated at 300°C through the breakdown of the most labile C–C bonds.
Table 3. Extraction yield and carbon preference index (CPI25–31)
The most significant variation in extraction yield for pyrolysed vitrinites takes places up to 350°C after which no change is observed. The values of the extraction yield during the first stages seem to indicate the retention of some of the generated oil. The strong decrease in extraction yield takes place between 0.83 and 1.08% of vitrinite reflectance (Fig. 1) due to the easy departure of oil/bitumen and its conversion to gas.
During the pyrolysis stages of 300, 325 and 350°C, like in the raw material, the extraction affects the intensity of the aliphatic bands in the FTIR (Fig. 13a). This variation is also attributed to the nature of the soluble material affecting the extinction coefficients. As can be observed in Fig. 13a, the difference in the intensity of the aliphatic stretching modes between the whole and extracted sample decreases as the oil yield increases ( Fig. 2). Furthermore, for the 300, 325 and 350°C residues the extraction also affects the S2 parameter. Except for the
raw vitrinite the variation in S2 (Fig. 13b) is similar to that obtained for Hal and the difference
between whole and extracted sample also decreases as the oil yield increases. In the raw vitrinite the extraction does no modify the value of this parameter. The decrease in S2 is
usually attributed to the contribution of the bitumen to the value of this parameter. Nevertheless, the low extraction yield for the samples studied here (Table 3) rules out this
explanation. A reasonable alternative would be to consider the role of the nature of the chloroform in the process of hydrogen-transfer [16].
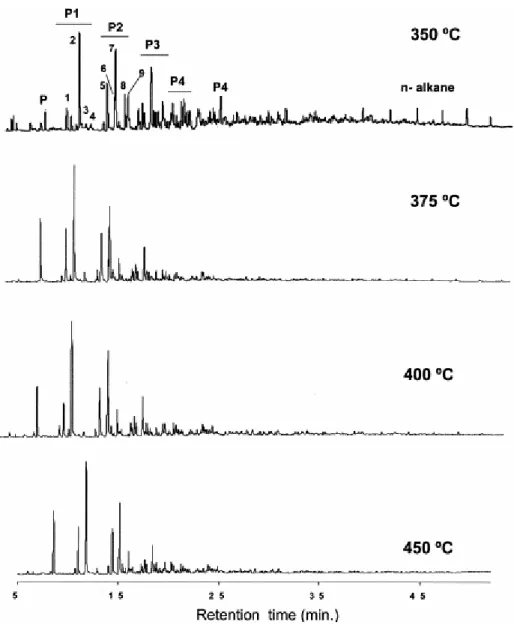
The chromatograms of the oils generated at 350, 375, 400 and 450°C are depicted in Fig. 14. According to the vitrinitic composition of the samples, phenol and its alkyl-substituted homologues are the major products in the oils. Table 4 shows the isomers of C1 and C2 alkyl
phenols that have been identified. The C3 phenols correspond to different isomers of
trimethylphenol and ethylmethyl phenol whereas propylphenol is not present. The specific substitution sites of these isomers was not determined. These phenolic compounds are similar to those described by Hartgers et al. [51] in the flash pyrolysates of Carboniferous coals. The most likely origin of phenols in vitrinite pyrolysates is diagenetically altered lignin but an origin related to tannins is also possible [52]. The phenolic nature of the oils agrees with the decrease of both the O/C atomic ratio ( Fig. 6a) and intensity of the 3400 cm−1 (OH stretching region, Fig. 9).
Table 4. Phenolic compounds identified by gas chromatography/mass spectrosmetry (for peak code see Fig. 14)
The oil obtained at 350°C shows clear differences with respect to the others from both a qualitative and semiquantitative point of view (Fig. 15). However, no variations in the volatile fraction of the oils obtained at 375, 400 and 450°C were found. An examination of the chromatograms (Fig. 14) shows the presence of n-alkanes (nC16–nC25) in the 350°C oil. These
compounds are almost entirely absent in the other oils. Similarly, whereas C4-phenols are
relatively abundant in the oil obtained at 350°C, in the other oils they are only present in a very small concentration. From the semiquantitative point of view, Fig. 15a shows the proportion of phenol and C1 to C3 alkyl phenols (the most abundant components for all
samples) and Fig. 15b the distribution of the different isomers of C1 and C2 alkyl derivatives
identified. Heating from 350 to 375–450°C produces an increase in the total amount of phenol, cresols and C2 phenols whereas the amount of C3 phenols decreases (Fig. 15a). Fig.
15b shows differences in the contribution of the isomers to the total amount of cresols and C2
phenols. o-Cresol decreases from 350 to 375–450°C whereas the contribution of the m/p-cresol mixture increases. The contribution of the major isomer of C2 phenols
(2,dimethylphenol and 3-ethylphenol) increases from 350 to 375–450°C. The proportion of 4-ethylphenol, 3,5-dimethylphenol and 2,3-dimethylphenol decreases.
The absence of the n-alkane series and the decrease in C3 and C4 phenols in the oils obtained
from vitrinite pyrolyzed at 375, 400 and 450°C agrees with the beginning of specific reactions of secondary cracking above the 350–375°C stage. At the same time the differences found in the distribution of the major phenols present in the mixtures from 350 to 375–450°C suggest a reorganisation of the vitrinite network which has already been described from data of the structural analysis. On the other hand, the increase in oil yield from 400 to 450°C (Fig. 2) without change in the composition of the volatile fraction suggests differences in the non-volatile fractions of these oils. The oil obtained at 450°C might contain more condensed structures with high molecular weight so that they cannot be identified by GC/MS. From these condensation reactions light compounds can be generated contributing to the increase in gas at these stages. Finally the results obtained through the analysis of the volatile fraction of the oils confirms the complexity of mechanisms operating during the heating of the vitrinite. In the conditions of pyrolysis used in this work these mechanisms are consistent with those described for natural coalification processes.
4. Summary
The thermal treatment of a monomaceralic coal (low-rank pure vitrinite with R0=0.53%)
performed using open-medium pyrolysis in the conditions described in this paper is a suitable method for obtaining information concerning the effect the physico–chemical structure of organic matter has on vitrinite reflectance with increase in temperature. Such information could be applied to the most interesting phase of coalification (bituminization range) in which vitrinite reflectance gives exceptionally precise results for coals and sediments because it depends on changes in chemical structure. Vitrinite reflectance therefore is more suitable as a rank parameter for some intervals of the rank scale than other parameters such as carbon content.
The chemical mechanism that operates during the heating of vitrinite in the conditions used in this work, that is to say, a complex mixture of depolymerization and condensation reactions, is in general terms consistent with that described for natural coalification. However, some discrepancies were found (mainly in the physical structure), which seem related mainly to the intensive conditions inherent in pyrolysis and to the rapid and massive expulsion of the products generated during the process. This expulsion is favoured by rapid and extensive fracturing in the vitrinite structure and the formation of a more open pore system as described in microscopic studies. The pyrolysis residues have a higher degree of thermostability than expected in naturally coalified coals, this being due to the expulsion of the generated products and the enhancement of cross-linking with the formation of C–O–C bridges. Finally, the high temperature used during the pyrolysis processes enhances the reactions of secondary cracking which begin at lower values of vitrinite reflectance than those described during the natural coalification of organic matter.
In light of the major transformations that occurred during the thermal treatment of vitrinite by means of the open-medium pyrolysis system described in this paper, the following three stages can be distinguished on the basis of structural and chemical changes:
4.1. Stage I (25–300°C; R
0: 0.53–0.55%)
The value obtained for vitrinite reflectance at 300°C (0.55%) indicates that the supply of energy is not enough to degrade the structure of the vitrinite. No oil/bituminous substances were recovered and no substantial changes in the texture or ultrafine structure were observed. Heating at this temperature (300°C) mainly produces an effect of drying and loss of free hydrocarbons in pores. This explains the unexpected increase in the mean interlayer spacing of the aromatic sheets and apparently produces some devolatilization vacuoles. Results of the study of the soluble fraction show odd/even predominance consistent with hydrocarbon
generation. Extraction affects the extinction coefficients of the aliphatic modes in the FTIR. It also affects the S2 values of the Rock-Eval. This is attributed to the role of the soluble
compounds in the processes of hydrogen transfer.
4.2. Stage II (325–375°C; R
0: 0.74–1.08%)
All the results obtained allow the temperature interval from 325 to slightly above 375°C to be included into the bituminization range where bituminous substances like oil generation and mobilisation is the most important process. The gradual homogenisation of the vitrinite structure with increase in rank is one of the most significant features. The study of chloroform extraction residues at a temperature below 350°C clearly indicates a retention of the oil/bituminous substances generated by thermal cracking. The gas obtained at 325°C can be attributed to the thermal cracking of aliphatic hydrocarbons with low dissociation energy from the vitrinite matrix. Thus, the production of oil/bituminous substances seems to provide an estimation of the amount of oil that is potentially able to migrate from coal. The generation and expulsion of degradation products produce an increase in the number and size, disposition and morphology of devolatilization vacuoles. The depolymerization of the vitrinite structure in these stages is reflected in the mainly phenolic nature of the generated oils/bitumens. Between 350 and 375°C a marked decrease in aliphatic hydrogen is found which is responsible for the deviation of the H/C atomic ratio trend in pyrolysed vitrinites in comparison with natural ones. At the end of this stage (between 350 and 375°C) the decrease in CPI reflects a shift from a predominance of n-alkane generating reactions to predominantly alkane–cleavage reactions. These results and the changes in the composition of the oil/bitumens recovered indicate an incipient secondary cracking. The beginning of reactions of secondary cracking at relatively low values of vitrinite reflectance is due to the conditions used during the pyrolysis process.
4.3. Stage III (400–450°C; R
0: 1.34–1.94%)
This stage is marked by the secondary cracking of the oils/ bituminous substances generated during Stage II. At 450°C the homogenisation of botanical structures is complete and the increase in porosity produces a large amount of vacuoles which coalesce. The mode and occurrence of these vacuoles agrees with the intensification of secondary cracking. The SEM analysis of the ultrafine structure of vitrinites obtained at this stage (400–450°C) clearly shows the different nature and chemical composition of cellular walls and cavity fillings, the former being more resistant with a different behaviour and evolution. A considerable increase in aromaticity is produced because of the increase in temperature it being possible to predict the oncome of the wet gas stage. This is determined from physical structure by an increase in the aromatic layers and the stacking size of the aromatic layers as demonstrated from the XRD results. Between 400 and 450°C a new pulse of water production is obtained suggesting an increase in cross-linking phenomenon. The modifications in the physical and chemical structure of the vitrinite at this stage produce an increase in the thermostability of the solid residues, as is reflected in Tmax. values which are higher than expected given to the values of
reflectance. Although during pyrolysis, the H/C atomic ratio decreases at higher rate than in naturally evolved vitrinite, the value of this parameter for the residue obtained at 450°C is higher than 0.5 indicating that the metagenesis (phase of dry gas) has not been reached according to the vitrinite reflectance value and the absence of anisotropy.
Acknowledgements
This work has been supported by the European Community, project (ECSC Contract: 7220-EC–769). The authors are also indebted to Dr J.R. Disnard for the Rock-Eval analysis and Dr C.G. Blanco for the mass spectrometry analysis. A. Jimenez thanks the Spanish Ministery of Education and Culture for a contract. I. Hutchinson has revised the English version. Finally, the authors also thank the reviewers for helpful suggestions and critical review of the manuscript.
References
1. International Committee of Coal Petrology. International Handbook of Coal Petrography, 2nd Ed., CNRS, Paris, 1971..
2. A. Oberlin, J.L. Boulmier, M. Villey, in: B. Durand (Ed.), Kerogen, Insoluble Organic Matter From Sedimentary Rocks, Technip, Paris, 1980, pp. 191–242..
3. M. Teichmuller, in: A.C. Scott (Ed.), Coal and Coal-Bearing Strata: Recent Advances, Geological Society of London, Special Publication, London, 32 (1987) 127..
4. P.G. Hatcher, H.E. Lerch, R.K. Kotra and T.V. VerheyenFuel 67 (1988), p. 1069. 5. P.G. HatcherEnergia 4 5 (1993), p. 1.
6. G.R. Dyrkacz, C.A.A. Bloomquist and P.R. SolomonFuel 63 (1984), p. 536. 7. G.R. Dyrkack and E.P. HorwitzFuel 61 (1982), p. 3.
8. J.C. Crelling, in: J.A. Moulin, K.A. Nater, H.A.G. Chermin (Eds.), Coal Science and Technology. International Conference on Coal Science, Elsevier Science B.V. Amsterdam, 11, 1987, pp. 119–122..
9. J.C. Crelling, N.M. Skorupska and H. MarshFuel 67 (1988), p. 781.
10. M. Monthioux, P. Landais and J.-C. MoninOrg. Geochem. 8 (1985), p. 275.
11. H.J. Schenk, E.G. Witte, R. Littke and K. SchwochauOrg. Geochem. 16 (1990), p. 943. 12. R. Michels, Landais, Fuel 73 (1994) 1691..
13. F. Behar and P.G. HatcherEnergy Fuels 9 (1995), p. 984.
14. F. Laggoun-Defarge, E. Lallier-Verges, I. Suarez-Ruiz, A. Jimenez-Bautista, J.-M. Guet, C. Clinard, in: R. Curnelle, J.P. Severac (Eds.), Petrologie Organique. Bull. Centres Rech. Explor. Prod. Elf Aquitaine. Publ. Spec. 18, 1994, 263..
15. M.J. Iglesias, A. Jimenez, F. Laggoun-Defarge and I. Suarez-RuizEnergy Fuels 9 (1995), p. 458.
16. A. Jimenez, M.J. Iglesias, F. Laggoun-Defarge and I. Suarez-RuizChem. Geol. 150 (1998), pp. 197–221
17. I. Suárez-Ruiz, L. Martinez, Ph. Bertrand, J.G. Prado, J.R. Disnar, Int. J. Coal Geol. 25 (1994) 47..
18. F. Laggoun-Defarge, E. Lallier-Verges, I. Suarez-Ruiz, N. Cohaut, A. Jimenez, P. Landais, J.G. Prado, in: Mukhopadhyay, Dow (Eds.), Vitrinite reflectance as a maturity parameter, Applications and limitations, ACS Symposium Series No. 570, American Chemical Society, Washington DC, 1994, pp. 194–205..
19. J. Espitalie, G. Deroo, F. Marquis, Rev. Inst. Fr. Petrol. 40/5 (1985) 563, 40/6 755.. 20. J. Espitalie, G. Deroo, F. Marquis, Rev. Inst. Fr. Petrol. 784 41/1 (1986) 73..
21. P.R. Solomon, D.G. Hamblen, R.M. Carangelo, in: E.L. Fuller Jr. (Ed.), Coal and Coal Products, ACS Symp. Ser. No. 205, American Chemical Society, Washington DC, 1982, pp.77–131..
22. P. Painter, M. Starsinic, M. Coleman, in: J.R. Ferraro, L. Basile (Eds.), Fourier Transform Infrared Spectrsocopy, vol. 4, Academic press, Orlando, FL, 1985, pp. 169–241..
23. P.G. Rouxhet, P.L. Robin, G. Nicaise, in: B. Durat (Ed.), Kerogen: Insoluble Organic Matter from Sedimentary Rocks, Editions Technip, Paris, 1980, p. 163..
24. E.E. Bray and E.D. EvansGeochim. Cosmochim. Acta 22 (1961), p. 2. 25. R. Lin and G.P. RitzOrg. Geochem. 20 (1993), p. 695.
26. L.R. Snowdon and T.G. PowellAAPG Bull. 66 (1980), p. 775.
27. B.P. Tissot, D.H. Welte, Petroleum Formation and Occurrence, 2nd ed., Springer Verlag (1984)..
28. M. Garcia-Gonzalez, D.B. MacGowan and R.C. SurdamU.S. Geol. Survey Profess. Paper
1570 (1993), p. 405.
29. A.D. Carr and J.E. WilliamsonOrg. Geochem. 16 (1990), p. 313.
30. R. Lin, A. Davis, D.F. Bensley and F.J. DerbyshireInt. J. Coal Geol. 6 (1986), p. 215. 31. E. Stach, M.Th. Mackowsky, M. Teichmuller, G.H. Taylor, D. Chandra, R. Teichmuller, Coal Petrolgy, 3rd ed., Gebruder Borntraeger, Berlin, 1982, 535..
32. A. Cuesta, Ph. Tesis, Unpublished, Universidad de Oviedo, 1994, p. 298.. 33. C.A. Johnson, J.W. Patrick and M ThomasFuel 65 (1986), pp. 1284–1290. 34. A.M. Vassallo, M.A. Wilson and J.H. EdwardsFuel 66 (1987), p. 622. 35. van Krevelen, Coal, Elsevier, Amsterdam, 1993..
36. P.G. Hatcher, K.A. Wenzel, G.D. Cody, in: P.K. Mukhopadhyay, W.G. Dow (Eds.), Vitrinite Reflectance as a Maturity Parameter: Applications and Limitations, ACS Symp. Series No. 570, American Chemical Society, Washington DC, 1994, pp. 112–135.
37. J.J. Sweeney and A.K. BurnhamAAPG Bull. 74 (1990), p. 1559. 38. J.G. Reynolds, Al.K. Burnham, Energy Fuels 7 (1993) 619..
39. M.L. Bordenave, J. Espitalié, P. Leplat, J.L.Oudin, M. Vandenbroucke, in: M.L. Bordenave (Ed.), Applied Petroleum Geochemistry, 1993, Ch II.2. p. 217.
40. F. Laggoun-Defarge, J.-N. Rouzaud, N. Cohaut, P. Landais, E. Lallier-Verges, I. Suarez-Ruiz, in: J.A. Pajares, J.M.D. Tascón (Eds.), Coal Science and Technology, 24: Coal Science, 1, Proceedings of the Eighth International Conference on Coal Science, 1995, p. 215..
41. M. Monthioux and P. LandaisEnergy Fuels 2 (1988), p. 794.
42. P.G. Hatcher, J.-L. Faulon, K.A. Wenzel and G.D. CodyEnergy Fuels 6 (1992), p. 813. 43. M.A. Kruge, D.F. Bensley, in: Mukhopadyay, W.G. Down (Eds.), Vitrinite Reflectance as a Maturity Parameter: Applications and Limitations, ACS Symp. Series No. 570, American Chemical Socity, Washington DC, 1994, pp. 136–148..
44. J.K. Brown, J. Chem Soc. Lond. (1955) 744..
45. M.A. Wilson, R.J. Pugmire, J. Karas, L.B. Alemany, W.R. Woolfenden and D.M. GrantAnal. Chem. 56 (1984), p. 933.
46. W. Kueh, R.W. Snyder, A. Davis and P.C. PainterFuel 61 (1982), p. 682.
47. P.H. Given, in: M.L. Gobarty, J.W. Larsen, I. Wender (Eds.), Coal Science, vol. 3, Academic Press, Orlando FL, 1984..
48. H. Ganz and W. KalkreuthFuel 66 (1987), p. 708.
49. R.G. Radke, D. Schaefer, M. Leythaeuser and M. TeichmullerGeochim. Cosmochim. Acta
44 (1980), p. 1787.
50. J. Allan and A.G. DouglasGeochim. Cosmochim. Acta 41 (1977), p. 1223.
51. W.A. Hartgers, J.S.S. Damsté, J.W. de Leeuw, Y. Ling and G.R. DyrkaczEnergy Fuels 8 (1994), p. 1055.
Figures and Plates
Fig. 1. Evolution of vitrinite reflectance with increase in pyrolysis temperature.
Fig. 2. Transformation of vitrinite with increasing temperature. Mass balance of generated products during the process.
Fig. 3. X-ray diffractograms of the raw vitrinite and the pyrolyzates obtained at different temperatures.
Fig. 4. Changes in moisture content during heating of the vitrinite. Comparison with the water yield at each stage.
Fig. 5. (a) Decrease in volatile matter with increase in pyrolysis temperature in relation to weight loss at each stage. (b) Correlation between volatile matter and vitrinite reflectance for the artificial series of vitrinite and comparison with natural series of vitrinite (data from van Krevelen [35]).
Fig. 6. (a) Position of the artificial series of vitrinite in the van Krevelen diagram. (b) Correlation between carbon and vitrinite reflectance for the artificial series of vitrinite and comparison with the natural trend (data from van Krevelen [35]).
Fig. 8. FTIR spectra of the raw vitrinite and pyrolyzates obtained at different temperatures. The assignation of the most useful regions for the semiquantitative analysis is depicted at the top.
Fig. 10. Relationship between vitrinite reflectance and aromatic to aliphatic hydrogen ratio (a), degree of substitution (b) and aromatic hydrogen concentration (c).
Fig. 11. Variation of the aliphatic hydrogen concentration estimated by means of FTIR during pyrolysis of the vitrinite as a function of vitrinite reflectance.
Fig. 12. Evolution of the proportion of aliphatic versus aromatic structures (A factor) with the increase in pyrolysis temperature (a). Correlation between the A factor, vitrinite reflectance (b) and Rock-Eval S2 (c).
Fig. 13. Effect of the extraction with chloroform on the aliphatic hydrogen concentration (a) and Rock-Eval S2
Fig. 15. Semi-quantitative GC data of the oils: (a) proportion of phenol and C1 to C3 alkylphenols and (b)
Plate 1. Optical microscopy (reflected white light and oil immersion). Evolution of the vitrinite structure during the pyrolysis process. (a) Raw vitrinite. Botanical structure showing the cell walls and filled cells. (b) 350°C stage. Gradual loss of definition of botanical structures. (c) 400°C stage. Vitrinite with homogeneous appearance. Weak development of porosity with parallel orientation. (d) 450°C stage. Homogeneous vitrinite showing considerable porosity with pores of a large size.
Plate 2. Scanning electronic microscopy images. Evolution of ultrafine structure of vitrinite during its pyrolysis. (a) Raw vitrinite. Vegetal structures corresponding to the laminated wall (w) and cavities (ca). (b) 325°C stage; devolatilization vacuoles in the filling material of the cavities. (c) 400°C stage; boundary between wall and cavities is gradual. Walls conserve the lamination. (d) 450°C stage. Material filling cavities is gelified.

![Table 2. Data of the most significant parameters deduced from Rock-Eval pyrolysis. Comparison between the reflectance values measured for the vitrains and those calculated from Easy % R 0 model a [37]](https://thumb-eu.123doks.com/thumbv2/123doknet/14783164.597528/11.892.138.770.247.386/significant-parameters-pyrolysis-comparison-reflectance-measured-vitrains-calculated.webp)