Biosensor-based Strategies for Improving
in Escherichia coli
By Stephanie J. Doong B.S. Chemical Engineering Stanford University, 2014Pathway Production
MASSACHUSETTS INSTITUTE OF TECHNOLOGYMAY 23 2019
LIBRARIES
ARCHIVES
Submitted to the Department of Chemical Engineering in Partial Fulfillment of the Requirements for the Degree of
Doctor of Philosophy at the
MASSACHUSETTS INSTITUTE OF TECHNOLOGY
June 2019
2019 Massachusetts Institute of Technology. All rights reserved
Signature of Author ...
Signature redacted
(1/Stephanie J. Doong Department of Chemical Engineering May 7, 2019
Certified by
...
Signature redacted
61
Kristala L. J. Prather Professor of Chemical Engineering Thesis Supervisor
Signature redacted
Accepted by...
Patrick S. Doyle Professor of Chemical Engineering Chairman, Committee for Graduate Students
Biosensor-based Strategies for Improving Pathway Production in
Escherichia coli
By
Stephanie J. Doong
Submitted to the Department of Chemical Engineering on May 7, 2019 in Partial Fulfillment of the Requirements for the Degree of Doctor of Philosophy in
Chemical Engineering
Abstract
Microbial production of chemicals and fuels is an attractive renewable alternative to petroleum-based processes. D-glucaric acid, a Department of Energy top value-added chemical from biomass, is a precursor to polymers such as nylons and used in detergents. An engineered metabolic pathway requiring three heterologous enzymes to convert glucose into glucaric acid in
Escherichia coli was previously demonstrated by the Prather lab. Glucaric acid production has
been shown to be limited by the two downstream enzymes myo-inositol-1-phosphate synthase (MIPS) and myo-inositol oxygenase (MIOX). This work develops and deploys a biosensor that recognizes a pathway intermediate in order to overcome both limitations.
A biosensor for myo-inositol (MI) was developed using the transcriptional regulator IpsA from the organism Corynebacterium glutamicum. A hybrid promoter was designed to enable function in the desired host organism E. coli. The modular design of the biosensor permitted the behavior and Ml dose response to be adjusted for the pathway applications.
The myo-inositol biosensor was used to regulate expression of Miox, the enzyme that consumes myo-inositol, such that Miox was transcribed only in the presence of its substrate. Controlled expression of Miox led to a 2.5-fold increase in glucaric acid titer compared to the static case where Miox was constitutively expressed. This dynamic regulation scheme was then paired with a system that dynamically knocked down glycolysis, which independently improved glucaric acid production by relieving competition of glycolysis with MIPS, the first pathway enzyme. The layered dynamic regulation scheme improved glucaric acid production by up to 9-fold.
Next, the biosensor was used as a high-throughput screen for mutants of MIPS generated by directed evolution. The biosensor enabled a large library of MIPS to be screened by fluorescence-activated cell sorting (FACS). The screen identified MIPS mutants with up to 20% improvement in myo-inositol production.
This work used a biosensor to tackle two pathway limitations and improve glucaric acid production, showcasing the biosensor as a powerful metabolic engineering tool.
Acknowledgements
Many thanks to Kris for your guidance, mentorship, and excitement about science over these past few years. I left every meeting feeling motivated, no matter how unprepared I felt before or how awful the results looked. Thank you for maintaining that positive attitude! I would also like to thank my committee members Professors Hadley Sikes and Tim Lu for their support.
To all the members of the Prather lab past and present - thank you for making the lab a friendly and fun place to be. Thank you to Kat and Dity for welcoming me to the group and training me. Many thanks to Sue Zanne for all of your pro tips and assistance even after you went on to do bigger and better things. To Jason, a huge thank you for your expertise, experience, and the time you took to troubleshoot many experiments with me. Thank you to Lisa for teaching me about glucaric acid, going on adventures with me, and commiserating about being an adult. Many thanks to Kevin and Jennifer, who brought new energy and enthusiasm to the lab when my motivation was at an all-time low and for organizing team Phage Attack. Thank you to my undergraduate student Pep, who stuck around despite your disgust at the smell of autoclaved LB and multiple experiments gone awry.
Many thanks to all the musicians and groups I have had the pleasure to play with. MITSO, Mercury, and Du Bois Orchestras, thank you for giving me the opportunity to play and grow musically. Thank you to the "Fish Heads" quintet (Anne, Isabelle, Eva, and Alan) for very entertaining rehearsals. To Carina, Roger, and Hoon, thank you for welcoming me to the group. Thank you to my teacher, Sarita, for believing in me, helping developing my sound, and improving my violin playing.
To those of you who went to practice school with me, it is not a small achievement that we are still friends! Thanks for being team players as colleagues, great travel companions, and very cool people. Special thanks to Sarah for being a wonderful roommate.
Thank you to Team Celery - I would not have survived first semester without you. I am so lucky to have an amazing group of friends. Thank you to my roommate, Christy, for listening to me complain about my day, fabulous wine nights, and for always telling me to use a larger pot when cooking. To Shuting, thank you for your sense of humor and always staying calm through any situation. Thank you to Miao, yeah buddy, for making everything seem like it "ain't nothing but a peanut". Thank you to Mike, my first friend at MIT, for enjoying horror movies and climbing with me. German, thank you for singing with me and encouraging me to get out, see concerts, and have fun. Max, thank you for eating food with me, coming to my concerts (my biggest fan!), and for always listening.
To my family - thank you for all your support. Many thanks to my brother Justin for being my adviser on all things tech and for very interesting conversations. Thank you to my parents for living the "graduate student lifestyle" so we could attend college. And I very much appreciate you taking us on amazing trips all around the world.
It has been a challenging journey, but I have truly enjoyed it, and I've also laughed quite a bit along the way.
Contents
1. Introduction ... 15
1.1 Engineering Organism s... 16
1.2 Biosensors as Tools for M etabolic Engineering ... 19
1.3 Dynam ic Regulation Strategies for Pathw ay Im provem ent... 22
1.4 High-Throughput Screening of Directed Evolution Libraries ... 26
1.5 D-Glucaric Acid Pathway ... 30
1.6 Thesis Objectives ... 33
1.7 Thesis Organization ... 33
2. m yo-Inositol Biosensor Developm ent ... 35
2.1 Introduction... 37
2.2 M aterials and M ethods ... 39
2.2.1 M l Sensor Plasm id Construction ... 39
2.2.2 Fluorescence M easurem ents... 41
2.2.3 M I Ferm entation ... 42
2.2.4 M I Quantification ... 42
2.3 Results and Discussion ... 45
3.1 Introduction... 55
3.2 M aterials and M ethods ... 59
3.2.1 Glucaric Acid Pathw ay Plasm id Construction ... 59
3.2.2 Strain Construction ... 61
3.2.3 Glucaric acid Ferm entation... 61
3.2.4 Bioreactor Ferm entation ... 62
3.2.5 Glucaric acid and M I Quantification ... 62
3.2.6 Quantification of m RNA Levels ... 63
3.2.7 Statistics ... 64
3.3 Results and Discussion ... 65
3.3.1 Dynamic Regulation of the Glucaric acid Pathway by Controlling MIOX ... 65
3.3.2 Layered Dynamic Regulation to Substantially Increase Production... 71
3.3.3 Alternate Regulation Designs ... 77
3.4 Conclusions... 81
4. Directed Evolution of M IPS... 83
4.2.1 Sensor and Library Construction... 88
4.2.2 Flow Cytom etry and Cell Sorting ... 91
4.2.3 Ferm entation ... 92
4.2.4 Product Quantification... 92
4.3 Results and Discussion ... 93
4.3.1 Biosensor Validation ... 93
4.3.2 Library Generation and Sorting ... 96
4.3.3 Hit Validation ... 97
4.4 Conclusions... 103
5. Conclusions and Outlook ... 105
5.1 Sum m ary and Future Directions ... 106
5.2 Outlook... 107
5.2.1 Biosensors as Genetic Parts for Dynam ic Regulation ... 107
5.2.2 Biosensors for High-Throughput Screens ... 107
5.2.3 Challenges of Deploying Biosensors in the Field ... 108
5.2.4 Biosensors beyond M etabolic Engineering ... 109
List of Figures
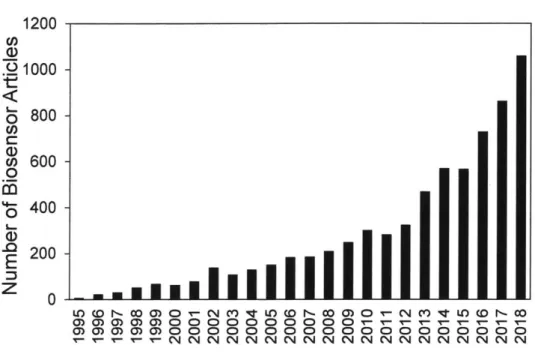
Figure 1.1. Number of publications containing keywords "biosensor" and "metabolic engineering"
from G oogle Scho lar search... 21
Figure 1.2. Com m on modes of dynamic regulation.. ... 23
Figure 1.3. Throughput increase with biosensor-based screening. ... 27
Figure 1.4. Schematic of D-glucaric acid production pathway from glucose in E. coli... 30
Figure 2.1. Construction and characterization of the MI biosensor. ... 46
Figure 2.2. Dose response curves of hybrid promoter variants... 48
Figure 2.3. Relative strengths of the promoters (P1-P5) used to drive ipsA expression, as m easured by RFP fluorescence... 49
Figure 2.4. Leakage level (GFP fluorescence at 0 g/L MI) for each promoter P1-P5... 49
Figure 2.5. Sensor detection of Ml produced from MIPS and phosphatase... 51
Figure 3.1. Final titers at 72 hours of (A) glucaric acid and (B) Ml from MI-controlled expression o f M io x ... 6 6 Figure 3.2. Production time course of (A) glucaric acid and (B) MI from MI-controlled expression o f M io x ...
6 6
Figure 3.3. Fold change of Miox transcript levels over time... 67Figure 3.4. Relative fluorescence and glucaric acid production from different hybrid promoters. ... 6 8 Figure 3.5. Growth curves for MG1655 (DE3) cells expressing the sensor circuit and INO1... 69
Figure 3.8. Schematic of layered dynamic regulation in the glucaric acid pathway...72
Figure 3.9. Glucaric acid production from strains with layered dynamic regulation...75
Figure 3.10. Glucaric acid production without MIOX control in the presence and absence of IpsA. ... 7 6 Figure 3.11. Schematic of circuit design for alternative modes of dynamic regulation. ... 77
Figure 3.12. Dose response curves for auto-regulated IpsA. ... 78
Figure 3.13. Characteristics of auto-regulated promoters... 78
Figure 3.14. GFP time course of auto-regulated biosensor with cells producing MI...79
Figure 4.1. Schematic of biosensor and MIPS plasmids. ... 93
Figure 4.2. MI titer (blue) and GFP fluorescence (green) of different MIPS variants. ... 94
Figure 4.3. Comparison of M IPS vector conditions ... 95
Figure 4.4. Proportion of GFP positive cells measured by flow cytometry... 96
Figure 4.5. Population distributions of high and low mutation rate libraries... 98
List of Tables
Table 2.1. List of hybrid promoters tested in Figure 2.2... 40
Table 2.2. List of promoters used for driving IpsA expression... 41
Table 2.3. List of primers used for plasmid construction... 43
Table 2.4. List of plasm ids used in this study. ... 44
Table 3.1. List of primers used for plasmid construction in this study. ... 60
Table 3.2. List of plasm ids used in this study. ... 60
Table 3.3. List of strains used in this study... 61
Table 3.4. Glucaric acid (GA) and myo-inositol (MI) titer for layered regulation strains... 74
Table 4.1. List of prim ers used in this study ... 90
Table 4.2. List of plasm ids used in this study. ... 90
Table 4.3. Hits from test and low m utation rate libraries... 100
1. Introduction
i.
Introduction
Microorganisms have been fermenting sugars into the essential products of wine, cheese, and bread for thousands of years. A little over 40 years ago, the introduction of recombinant DNA technology' rapidly expanded the accessible fermentation products beyond food. Technology to manipulate DNA has enabled scientists to modify, extend, and replace endogenous metabolic pathways forthe production of desired molecules, laying the foundation for the field of metabolic engineering2. Metabolic engineers have coerced microbes to produce commodity chemicals and
fuels from renewable feedstocks rather than petroleum (e.g. 1,3-propanediol3 and isobutanol4),
complex compounds that would otherwise need to be extracted from plants (e.g. artemisinin5,
opioids6, and cannabinoids7), and molecules that have not been found in nature (e.g. 1,4-butanedioll and 1,4-butyrolactone9).
To create and optimize production strains, metabolic engineers employ the design - build - test cycle'0. Genetic modifications are selected, constructed, and the resulting strains evaluated for titer, rate, and yield - the hallmark metrics of production. The results of strain evaluation are then used to guide the genetic designs for the subsequent engineering cycle.
Genetic parts and their configurations are selected in the design phase. These parts include genes encoding enzymes, forming the backbone of a production pathway. As further engineering cycles proceed, strategies to increase pathway flux, prevent product consumption, overcome
1. Introduction
These strategies may require additional parts such as protein tags, promoters, ribosome binding sites, terminators, and regulated components such as transcription factors and riboswitches. The design process has been improved with expanding databases characterizing genes and sequences
(NCBI'2), collections of known reactions and pathways (KEGG13
), protein databases (Uniprot4
), and computational methods to design parts (RBS calculator15). Algorithms such as OptKnock can predict pathways, knockouts, and enzymes exerting metabolic control". There are even platforms available to compile genetic circuits into DNA sequences (CELLO'7). These resources allow for informed design decisions and the development of more complex strategies for improving production.
The build step involves the physical assembly of DNA and construction of strains, and has been significantly simplified with dramatically reduced costs of DNA synthesis and sequencing. The continued development of numerous robust DNA assembly protocols along with an expanding plasmid repository (Addgene) have streamlined the genetic engineering process18. Advances in CRISPR technologies have greatly improved genome editing capabilities" and facilitated re-programming of many organisms (including humans 20).
The test stage evaluates the designed strains. Strains are tested for both productivity and problems. Product titer, byproduct accumulation, biomass yield, and protein expression are examples of metrics for evaluation. Pathway bottlenecks are diagnosed with tell-tale symptoms such as side products, poor growth, and intermediate buildup. Information from the test stage
omics and analytical technologies have provided comprehensive, detailed snapshots of cellular behavior2 1
. However, the test phase is still widely regarded as the bottleneck of the metabolic engineering cycle212 2. Conventional molecular detection methods are chromatographic, with
samples and conditions tested in series. If a chemical or enzymatic assay format is available for detecting the desired product or activity, microtiter plates can increase the throughput. Yet with powerful build methods generating up to billions of variants, test capacity is far below that of build capacity. One method to address these challenges in the test stage is by developing genetic parts capable of detection: biosensors.
1. Introduction
1.2 Biosensors as Tools for Metabolic Engineering
Adapted from natural regulatory mechanisms, genetically encoded biosensors are cellular components that perform molecular recognition. Biosensors are often re-purposed transcription factors or riboswitches that bind a molecule of interest and are engineered to regulate a phenotype-conferring reporter such as GFP.
Endogenous sensing mechanisms include riboswitches, two-component systems, and ligand responsive transcription factors2 4
-28. Riboswitches are regulatory RNA molecules that rely on secondary structure to physically block or promote transcription or translation. These secondary structures are altered upon interaction with a molecule of interest29
. Riboswitches are available for thiamine pyrophosphate30, theophylline3 1, and s-adenosyl-homocysteine3 2. Methods to
engineer aptamers, RNAs that bind molecules, have been applied to construct novel biosensors for molecules of interest29
,3 3.
Two-component systems possess a sensing domain that binds an extracellular ligand and a kinase domain that relays a signal to a response regulator, which often controls transcription2 4. Taking advantage of the modularity of the two domains, chimeric two component systems have been built to enable an organism to sense novel particles. For example, the EnvZ-OmpR system, which responds to osmolarity in E. coli, has been grafted with the photoreceptor Cphl to become
responsive to light34. The response regulator OmpR then controlled expression of the gene IacZ,
which breaks down the chemical X-gal to produce a dark blue color3 4
was expanded to red-green-blue wavelengths, allowing bacteria to print in color
3.
Ligand-responsive transcription factors possess a ligand (effector) binding domain for recognizing
intracellular metabolites and a DNA binding domain that regulates transcription
363. Classic
examples of ligand-responsive transcription factors include the commonly used tet and lac
systems, where transcription factors TetR and Lacl repress the tet and lac promoters
respectively
38. Transcriptional repression is relieved upon the addition of chemical inducers
anhydrotetracycline (aTc) or isopropyl thiogalactopyranoside (IPTG). Other ligand-responsive
transcription factors have been identified to detect metals (e.g. arsenic
39), amino acids (e.g.
lysine
40),
and pathway building blocks (e.g. malonyl-CoA
41).Of the various classifications of biosensors, it has been suggested that the ligand-responsive
transcription factor is easiest to implement and tune compared to two-component systems and
RNA-based systems
4 2. Ligand-responsive transcription factors are modular and have high
specificity. Many transcriptional regulators possess distinct DNA and effector binding domains,
such that the residues of the effector-binding pocket may be mutated to recognize other
small-molecule ligands. The absence of a known endogenous sensor for a desired compound led to the
construction of synthetic biosensors via site-saturation mutagenesis,
4 3chimeric transcription
factor engineering by merging DNA and ligand binding
domains4,
and de novo transcription
factor design
46. For example, AraC has been engineered to selectively recognize mevalonate,
1. Introduction
triacetic acid lactone, ectoine, and phenolic compounds by site-saturation mutagenesis of its
effector binding domain
43,
47-s.
1200
CO, a).2 1000
L
800
a)n 600
0400
200
E
z
0
0 CN (N MVLO CO I- CO Ir - T- Ir Ir T 000000 CN C N N N C'!Figure 1.1. Number of publications containing keywords "biosensor" and "metabolic engineering"
from Google Scholar search.
Biosensors are of considerable significance to metabolic engineers because of their capability to
serve as high-throughput screening tools for strain testing and also as regulatory genetic parts
for pathway design, particularly as key components in dynamic regulation schemes. As a result
of the multi-faceted utility of biosensors for metabolic engineers, the amount of literature
exploring genetically encoded biosensors has grown exponentially (Figure 1.1).
0)0N)NDN N N
'4O 0D
0D
Dynamic regulation is a pathway optimization strategy that draws from endogenous cellular
systems. Cells possess a variety of regulation and control mechanisms in order to streamline
biochemical processes and efficiently allocate resources. Studies have found that cells practice
precise timing of gene expression in order to maximize product formation while minimizing
resources. Upon starvation of arginine, serine, or methionine,
E.
coli initiated transcription of the
upstream amino acid biosynthetic genes (argA, serA, metA) earlier and to a higher maximal level
than the downstream genes
51. Mathematical models found that this temporal control scheme of
"just-in-time transcription" minimized the cost of enzyme expression while maximizing amino
acid production
1.
Synthetic biologists have implemented such control schemes in engineered pathways with the
aim of improving production. In addition to reducing expression burden and balancing metabolic
fluxes, dynamic pathway regulation has been demonstrated to separate growth from production,
prevent accumulation of a toxic intermediate, and combat inhibition by a downstream product
2-s.
Common dynamic regulation designs are shown in Figure 1.2.
1. Introduction
A
B
[1 1
Figure 1.2. Common modes of dynamic regulation. (A) Separation of growth from production at
a branch-point metabolite. (B) Dynamic pathway balancing by sensing availability of a key
pathway intermediate that is toxic or used in biomass formation.
An in silico representation of aerobic glycerol fermentation in E. coli found that dynamic control
balances the trade-off between growth and production and significantly improves glycerol
productivity5 5. By delaying induction of glycerol kinase (glpK), the gene responsible for glycerolproduction, a growth-only phase is introduced, allowing rapid biomass formation prior to the
production phase, at which point nearly all the carbon flux is shunted towards glycerol production.
A similar model found that dynamically down-regulating ackA improved anaerobic ethanol
fermentation in E. coli, as the static strategy of knocking out ackA reduced ATP availability and
thus the growth rate
55.
acetate, a result of metabolism overflow during rapid growth, into the desired product lycopene. The authors used NRI, a component of the Ntr regulon, to sense acetyl-phosphate and subsequently upregulate pathway production genes idi and pps under control of the NRI-responsive gInAp2 promoters6.This regulation scheme improved lycopene titers from a few mg/L
to over 150 mg/Ls6.
Additional pathways where dynamic regulation has had success include those for production of fatty acid ethyl esters (FAEEs)57, fatty acids41, and amorphadieness. Production of fatty acid ethyl
esters (FAEEs), a biodiesel, was improved by dynamically regulating pathway genes pdc and adhB, which generate the toxic intermediate ethanol, and fadD and athA, which siphon fatty acyl-CoAs away from cell membrane biosynthesis, hindering growth5 7. Expression of these genes was tightly
controlled by an engineered promoter regulated by the fatty acid responsive transcription factor
FadR57. This allowed the pathway genes to be induced only when sufficient concentrations of
precursor fatty acids were available57.
Fatty acid production has also been improved by balancing growth and production. FapR, a malonyl-CoA responsive transcription factor from B. subtiliss9, was used to balance levels of the
fatty acid building block malonyl-CoA. When malonyl-CoA availability was low, FapR limited expression of fatty acid synthase, which siphons malonyl-CoA molecules into fatty acid
1. Introduction
Conversely, when malonyi-CoA pools were high, FapR bolstered expression of the fatty acid synthase and restricted acetyl-CoA carboxylase expression41. The optimal balancing system
resulted in a 2-fold increase in fatty acid titer41.
In a similar balancing scheme, to combat the toxic intermediate farnesyl-pyrophosphate (FPP) in amorphadiene biosynthesis, FPP-responsive promoters were applied to control FPP production and consumption5 8. Because FPP-responsive biosensors have not been reported, and the
mechanism of FPP toxicity is unknown, transcriptomics was used to identify genes that demonstrated differential changes in expression upon accumulation of FPP5 8. The promoters of these genes were then used to upregulate amorphadiene synthase and downregulate FPP biosynthesis in the presence of FPP58.
Other strategies for dynamic control, particularly when a metabolite responsive biosensor is unavailable, include inducible transcriptional knockdown60 61, inducible protein degradation tags62, quorum sensing control 3
,
6 4, and CRISPR interference6 5. The numerous successful
implementations of dynamic regulation demonstrate its promise as a design strategy to optimize pathway production.
Inspired by the natural progression of organisms across time, directed evolution is a powerful method for identifying proteins with new and improved functions. A starting template sequence is randomly mutagenized to build a library, and members of the library are screened for the desired trait. Multiple iterative rounds often ensue to reach target characteristics. Numerous mutagenesis methods are available, including error-prone PCR, DNA shuffling, and staggered extension PCR66. Subtilisin E was notably evolved by error-prone PCR to become hundreds of times more active than the wild-type protein in the industrial solvent dimethylformamide (DMF)67. Beta-lactamase was evolved by DNA shuffling to make E. coli 32,000 times more resistant to the antibiotic cefotaxime6 8.
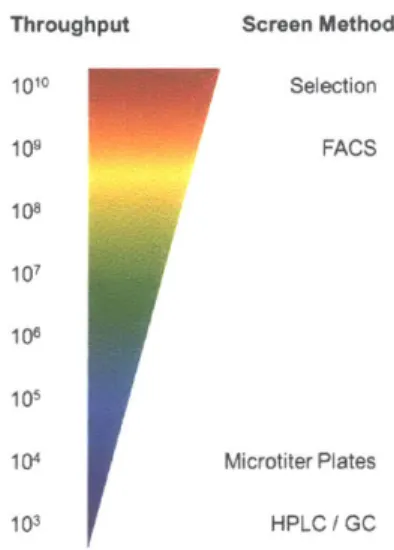
These tremendously successful enzyme improvements demonstrate the promise of directed evolution, especially for heterologous enzymes in engineered metabolic pathways. However, because random mutagenesis methods generate up to billions of variants, directed evolution strategies are limited by screening capacity69. Until recently, high-throughput screens were limited to enzymes and pathways that generate a colored or growth-requiring product. Thus, efforts have been made to use genetically encoded biosensors as a high-throughput screen for large libraries generated by directed evolution370,71. This allows cells to self-report product
formation by expressing a fluorescent protein or growth-restoring gene in response to detecting the product. Whole-cell biosensors increase the test throughput by orders of magnitude (Figure 1.3), allowing screening throughput to only be limited by transformation efficiency.
Growth-1. Introduction
based selections allow library members to be tested in parallel by growth on selective media.
Fluorescence-based screens must be tested in series, but microfluidic technologies such as
fluorescence activated cell sorting (FACS) enable single cell analysis at rates of thousands per
second.
Throughput Screen Method
1010 Selection 109 FACS 108 107 108 105 104 Microtiter Plates 103 HPLC / GC
Figure 1.3. Throughput increase with biosensor-based screening. Adapted from Wang,
Q.,
et. al.
2017 (26).Recent studies in biosensor-based screening of directed evolution libraries have demonstrated
success in improving pathway production. An arginine-responsive transcription factor was
engineered to control expression of YFP, allowing an argB library in C. glutamicum to be screened
by FACS
40. The screen identified argB mutants which relieved allosteric product inhibition by
20-fold
40. A similar lysine biosensor was used to screen libraries of pyruvate carboxylase, an
upstream amino acid biosynthesis enzyme, identifying mutants that improved lysine production
by up to
19%72.A theophylline-responsive riboswitch was attached to GFP and used to screen libraries of caffeine demethylase, which converts caffeine to theophylline, a treatment for lung problems73. Normally
found in plants, the enzyme activity and selectivity is low in yeast, the desired host organism73
.
The FACS-based screen identified a mutant with 33-fold improvement in activity and 22-fold improvement in selectivity73
.
Biosensors that output growth-restoring genes have also been used to evolve enzymes. LysR, a transcription factor from P. denitrificans responsive to 3-hydroxypropionate (3-HP), a precursor to plastic polymers and acrylamide, was used to control expression of the antibiotic resistance gene tetA in E. coli"4. This scheme permitted growth in the presence of tetracycline only when
cells produced sufficient quantities of 3-HP74. A library of mutant alpha-ketoglutaric
semialdehyde dehydrogenases was cultured in selective liquid media, which allowed the highest-producing mutants to end up as a larger fraction of the final culture population. This resulted in mutants with a 25% increase in 3-HP production4.
When a biosensor for the pathway intermediate or product is unavailable, transcriptional regulators themselves can be engineered by evolution to bind novel ligands4 3 and subsequently
used in high-throughput screens. The arabinose-responsive transcription factor AraC was engineered to recognize triacetic acid lactone (TAL), a pharmaceutical precursor48. The
TAL-1. Introduction
plate-based screen for a library of 2-pyrone synthase mutants48. The screen identified mutants with a 20-fold increase in TAL production48. Another AraC-derived biosensor for ectoine, a
cosmetics and pharmaceutical ingredient, was applied in a fluorescence-based screen for ectB, the rate-limiting step in ectoine biosynthesis4 9. This screen found a mutant with 4-fold increase in catalytic efficiency and 2.5-fold increase in ectoine titer49.
1. Introduction
1.5 D-Glucaric Acid Pathway
D-glucaric acid, a naturally occurring aldaric acid in plants and animals, is a precursor to esters
and lactones, a monomer unit of biodegradable polymers such as nylons, and a chelating agent
in detergents
7 5. The potential uses for its many derivatives led glucaric acid to be listed in the
2004 "Top Value-Added Chemicals from Biomass" report by the US Department of Energy
7s.
In
2016, glucaric acid had an annual global market of USD $500 million, which is expected to grow
largely due to the increased demand for phosphate-free detergents
76. However, the conventional
chemical synthesis process involves nitric acid oxidation of glucose, a hazardous reaction that is
also non-selective
75.The environmental and safety concerns as well as the selectivity challenges
can be addressed via the alternate synthesis route of bio-production.
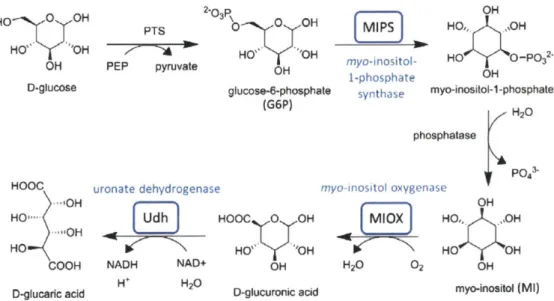
HO 0 OH HO" 'OH OH D-glucose HOOC "OH HO--HO COOH D-glucaric acid PTS PEP pyruvate uronate dehydrogenase Udh H NADH NAD+ H+ H20 P OH o 0 OH HO,* ,OH 0H HO. OH HO -P32 myo-inositol-OH 1-phosphate OH
glucose-6-phosphate synthase myo-inositol-1-phosphate
(G6P) H20 phosphatase 1)Po, myo-inositol oxygenase OH
OOC 0 OH M HO,, .OH
H HHO OH
OH H20 02 OH
D-glucuronic acid myo-inositol (MI)
Figure 1.4. Schematic of D-glucaric acid production pathway from glucose in E. coli. Heterologous enzymes are shown in blue.
1. Introduction
The Prather lab has previously developed a pathway in E. coli that converts glucose to glucaric acid using three heterologous enzymes (Figure 1.4), achieving yields of ~1 g/L glucaric acid per 10 g/L glucose". The first step of the pathway uses an endogenous phosphoenolpyruvate
(PEP)-dependent phosphotransferase system (PTS) to import glucose into the cell as glucose-6-phosphate (G6P). MIPS from Saccharomyces cerevisiae then converts G6P to inositol-1-phosphate, which is dephosphorylated by an endogenous phosphatase (likely SuhB) to myo-inositol (MI). Myo-myo-inositol oxygenase (MIOX) from mouse performs the oxygen-dependent conversion of MI to D-glucuronic acid. Finally, D-glucaric acid is produced from D-glucuronic acid by uronate dehydrogenase (Udh) from Pseudomonas putida or Agrobacter tumefaciens.
Of the three heterologous enzymes, Udh is by far the best-performing, with specific activity
orders of magnitude above those of MIPS and MIOX77.Thus, most of the work to improve glucaric
acid production has focused on enhancing the first two steps of the pathway. At the first step, MIPS competes with native glycolytic enzymes Pgi and Zwf for flux of G6P. Knockouts of pgi and
zwf to prevent any endogenous consumption of G6P along with co-feeding of non-glucose sugars for growth allowed separation of growth from production78. An extension of this strategy by engineering E. coli to catabolize sucrose (a disaccharide of fructose and glucose) permitted growth on fructose and production from glucose9. To lengthen culture time and improve titers,
residual glucose was shunted towards glycolysis after all fructose was consumed by dynamic control of pgi expression79. Growth-production separation has also been achieved via dynamic regulation strategies. Dynamic knockdown of glycolytic enzymes after the growth phase has been successful in improving glucaric acid titer by preventing carbon loss to biomass formation'.
Substantial efforts have been made to improve the conversion of MI to glucuronic acid. The intermediate MI frequently builds up in the culture due to the low stability and specific activity of the enzyme MIOX77. Co-localization of MIPS and MIOX using protein scaffolds has increased MIOX specific activity as well as glucaric acid titers80. To improve soluble expression of MIOX, a small ubiquitin-like modifier tag was appended to the N-terminus of MIOX, which also led to increased glucaric acid production81. To improve the activity of MIOX, directed evolution of MIOX has been performed using a growth-based selection8l as well as a biosensor-based screen 2. The
growth-based selection coupled high glucuronic acid producers to growth, and identified a mechanism for upregulating MI transport into the cell, but did not improve enzyme activity81. The biosensor-based screen used a transcription factor responsive to a glucaric acid break-down product83 with a GFP reporter to distinguish high producers, and identified mutants of MIOX with improved specific activity82
. Finally, as an oxygenase with an iron center, MIOX can generate reactive oxygen species that are toxic to the cell and to the enzyme itself. Expression of reactive oxygen species scavenging enzymes has been found to improved MI conversion 4.
1. Introduction
1.6 Thesis Objectives
This work aims to improve glucaric acid production by developing a biosensor for MI to address the limiting steps in the pathway. We expand on previous dynamic pathway regulation work by layering a MI-controlled MIOX regulation system over a glycolysis knockdown scheme, simultaneously addressing the two pathway bottlenecks. We then use the biosensor as a high-throughput screen for MIPS variants, enabling identification of higher-producing mutants through a directed evolution enzyme engineering strategy. This thesis demonstrates the utility of biosensors as a genetic part for designing pathways and as a screening device for testing strains.
1.7 Thesis Organization
This thesis is organized into five chapters. Chapter 1 provides background on the metabolic engineering strategies of dynamic pathway regulation and biosensor-based evolution, and the D-glucaric acid pathway. Chapter 2 describes construction and characterization of the MI biosensor. Chapter 3 details the deployment of the MI biosensor for dynamic control of MIOX. Chapter 4 describes the use of the MI biosensor as a high-throughput screen for directed evolution of MIPS. Chapter 5 discusses the outlook of biosensors as a genetic part in metabolic engineering.
2. myo-Inositol Biosensor Development
2. myo-Inositol Biosensor Development
Biosensors have recently emerged as a tool for improving and optimizing engineered metabolic pathways. Sensors have been used as high-throughput screens for directed evolution of enzymes A 4
4, autonomous induction64, and dynamic pathway regulation41 56 57. Here we
develop and characterize a myo-inositol (MI) biosensor in E. coli. MI, a key intermediate in the
glucaric acid pathway, is natively detected in Corynebacterium glutamicum by the ligand-responsive transcription factor lpsA85. In order for the regulation system to function in E. coli, a
hybrid promoter that fused the cognate DNA binding sequences for IpsA with a minimal E. coli
promoter was designed. The adaptation of the MI sensor system to E. coliuses well-characterized and tunable genetic parts, allowing the sensor to be optimized for any particular application.
Portions of this chapter have been published in Doong, S.J., Gupta, A., and Prather, K.L.J.P. Layered dynamic regulation for improving metabolic pathway productivity in Escherichia coli.
2. myo-Inositol Biosensor Development
2.1 Introduction
Biosensors are derived from endogenous gene regulation and response mechanisms that allow for efficient adaptation to environmental changes such as carbon sources, pH, and antibiotics. These natural detection systems can be re-purposed for microbes to more effectively produce desired chemicals. Some examples include screens for directed evolution of enzymes 43,48
,49, quantification of intracellular metabolites83
, autonomous induction64
, and dynamic pathway regulation41,s6's7
In this work, a natural detection system was re-programmed as a biosensor for myo-inositol (MI). The ligand-responsive transcription factor, IpsA, natively regulates MI and cell wall biosynthesis
in Corynebacterium glutamicum8s. IpsA has been shown to bind with high specificity to MI, as well as to multiple promoter regions in the C. glutamicum genome8 5. In the absence of MI, IpsA binds to DNA sites, such as the promoter region of the gene encoding myo-inositol phosphate synthase (MIPS), and recruits RNA polymerases to activate transcription. In the presence of MI, however, IpsA binds to MI and dissociates from DNA, preventing polymerase recruitment and deactivating gene expression85. In C. glutamicum, IpsA was also found to upregulate cg0044, a putative ABC transporter, and downregulate inositol catabolism genes, 0-succinylbenzoic acid-CoA ligase (menE), and iron homeostasis factors85.
Here a tunable MI biosensor was constructed in E. coli from the C. glutamicum transcription
factor IpsA and its cognate DNA-binding sequences. IpsA repressed transcription of the reporter gene gfp except in the presence of Mi. The biosensor was characterized by GFP measurements
multiple knobs for tuning, where the sensor behavior could be adjusted by the hybrid promoter configuration and the expression level of IpsA. A diverse collection of dose responsive curves was generated by adjusting these knobs, such that the MI biosensor could be tailored to fit any particular application.
2. myo-Inositol Biosensor Development
2.2 Materials and Methods
2.2.1 Ml Sensor Plasmid Construction
All primers used for PCR amplification of genes and promoters are found in Table 2.3. All plasmids
used in this study are found in Table 2.4.
The hybrid promoter cg44 (TTTACAgttttattgattcagtTATTATgctagcacgtgcaatttttaaaattaaaggcgtta cccaacagaggagaaatactag) was constructed by placing the IpsA binding site (underlined) from C.
glutamicum gene cg004485 in between the -35 and -10 sites (capitalized) of promoter BbaJ23101 from the Registry of Standard Biological Parts8 6.The transcription start site is denoted in red and the RBS in green. To construct pHH-cg44-GFP, the hybrid promoter cg44 and gfp were inserted into a modified form of the plasmid pHHDO1K87, which includes the rrnB terminator (ccaggcatcaaataaaacgaaaggctcagtcgaaagactgggcctttcgttttatctgttgtttgtcggtgaacgctctc)
downstream of tetR. Briefly, gfp was amplified from pSB1A2-GFP88 with primers pHH-GFP-R and cg44-RBS-GFP-F1. To incorporate the full length of the hybrid promoter cg44 sequence, overlap extension PCR was employed by adding primer cg44-RBS-GFP-F2 to the reaction. The backbone of the modified pHHDO1K was amplified with primers cg44-pHH-A and GFP-pHH-B. The backbone and insert containing gfp were annealed and amplified using CPEC89. All other hybrid promoter variants pHH-cgX-GFP, where cgX is the name of the hybrid promoter (Figure 2.2 and Table 2.1), were constructed by CPEC after amplifying the insert containing gfp using primers GFP-C-R and cgX-F and backbone using primers GFP-C-F and cgX-R. All restriction enzymes, ligases, and polymerases were purchased from New England Biolabs (lpswich, MA).
The gene encoding IpsA was obtained by PCR from C. glutamicum genomic DNA with primers EcoRl-lpsA-F and BamHl-lpsA-R, digested with EcoRi and BamHI, and ligated into the multiple cloning site of pHH-cgX-GFP to construct pHH-cg44-GFP-Ptet-ipsA. To create the tunable set of sensor plasmids, the tet promoter was replaced with promoters P1 through P5 (Table 2.2) from the Registry of Standard Biological Parts86. Promoters P1, P2, and P5 were inserted via CPEC using primers Px-ipsA-F and Px-pHH-R, where x = 1, 2, 5. Promoters P3 and P4 were amplified by PCR of oligos Xhol-Px-F and Kpnl-Px-R (x = 3, 4), digested with Xhol and Kpnl, and ligated into the digested pHH-cg44-GFP-Ptet-ipsA backbone.
Table 2.1. List of hybrid promoters tested in Figure 2.2. The -35 and -10 sites are capitalized, and transcription start site denoted in red. The IpsA-binding sites, either cg3323A, cg3323B, or cg0044, are underlined.
Promoter Sequence
cgA TTTACAgaattgatcgatcaagcTATTATgctagcAcgtgcaatttttaaaattaaaggcgttacccaac
cgAp TTTACAgctagctcagtcctaggTATTATgctagcAaatt atcatcaancttaaaggcgttacccaac cg44 TTTACAgttttattgattcagtTATTATgctagcAcgtgcaatttttaaaattaaaggcgttacccaac cg44p TTTACAgctagctcagtcctaggTATTATgctagcAtctttattgattca tttaaaggcgttacccaac cgA-flp TTTACAgcttgatc atcaattcTATTATgctagcAcgtgcaatttttaaaattaaaggcgttacccaac cg44-flp TTTACAactgaatcaataaagagTATTATgtagcAcgtgcaatttttaaaattaaaggcgttacccaac cgBAdp RcttgatcjatcaggtttattaacTTTACAgctagctcagtcctaggTATTATgctagcAaattgatcgatcaagttaa aggcgttacccaac cg44dp actgaatcaataaagagttattaacTTACAgctagctcagtcctaggTATTATgctagcAtctttatt attcagtttaaa ggcgttacccaac cg44dc actgaatcaataaagagttattaacTTTACAgtctttattgattcagtTATTATgctagcAcgt caatttttaaaattaaa ggcgttacccaac
2. myo-Inositol Biosensor Development
Table 2.2. List of promoters used for driving ipsA expression. All promoter sequences are derived from the Registry of Standard Biological Parts86. The -35 and -10 sites are capitalized.
Promoter Sequence Parts Registry Identifier
P1 TTGACGgctagctcagtcctaggTATAGTgctagc BbaJ23111 P2 TTTACGgctagctcagtcctaggTATAGTgctagc BbaJ23106 P3 TTGACAgctagctcagtcctaggTATTGTgctagc BbaJ23104 P4 TTTACGgctagctcagtcctaggTACTATgctagc BbaJ23105 P5 TTTACGgctagctcagccctaggTATTATgctagc Bba J23107
2.2.2 Fluorescence Measurements
MG1655 (DE3) cells were transformed with the sensor plasmids and grown in LB (Luria Bertani)
broth with 50 ig/mL kanamycin. Overnight cultures were used to inoculate 1 mL wells at 1:100
vol/vol containing LB with 50 pg/mL kanamycin on a 48-well flower plate and cultured at 30*C,
shaking 1200 rpm, and 80% humidity in the BioLector (m2p Labs, Baesweiler, Germany). For
variants with the tet promoter driving ipsA, 50 ng/pL anhydrotetracycline (aTc) was added to the
medium. GFP fluorescence (excitation: 488 nm; emission: 520 nm) and biomass (excitation: 620
nm) were monitored continuously using LED optics for 24 hours. Experiments were performed in
triplicate during three separate, identical incubation periods.
The promoter strengths of P1-P5 were measured by placing rfp under their control. MG1655 (DE3)
cells were transformed with the plasmid series and grown in culture tubes containing 5 mL LB
with 50
pg/mL
kanamycin. Samples of 200
pL
volume were removed 24 hours post inoculation
and washed twice with 0.1 M sodium phosphate buffer (30 mM NaH2PO4 and 61 mM Na2HPO4)(Mannedorf, Switzerland) plate reader.
2.2.3 MI Fermentation
MG1655 (DE3) cells were transformed with the sensor plasmids and plasmid pTrc-Inol. Cultures
were grown in T12 medium (10 g/L D-glucose, 7.5 g/L yeast extract, 7.5 g/L soy peptone, 7 g/L Na2HPO4, 3 g/L KH2PO4, 0.5 g/L NaCl, 3 g/L (NH4)2SO4, 4 mM MgSO4) plus 50 pig/mL kanamycin
and 100 pg/mL carbenicillin. Fermentation cultures were inoculated from overnight cultures at 1:100 vol/vol. Fermentation was carried out for 48 hours in the BioLector (300C, 1200 rpm, 1.1
mL initial working volume). INO1 expression was induced with 50 pIM isopropyl @-D-1-thiogalactopyranoside (IPTG) at inoculation. Biomass and GFP were monitored as described
above. At 24 and 48 hours post-inoculation, 100 IiL culture from each well was removed, centrifuged at 3000g, 40C, 5 minutes, and the supernatant retained for titer measurements.
Experiments were performed in triplicate.
2.2.4 MI Quantification
Culture supernatants were analyzed by high performance liquid chromatography (HPLC) on an Agilent 1200 series instrument with an Aminex HPX-87H column. An isocratic, 25 minute method with 5 mM sulfuric acid mobile phase at a flow rate of 0.6 mL / minute was used. The column temperature was maintained at 650C, and the refractive index detector (RID) at 350C. The elution
2. myo-Inositol Biosensor Development
Table 2.3. List of primers used for plasmid construction.
Name Sequence pHH-GFP-R gatcttccccatcggtgatgagccagtgtgactctagta cg44-RBS-GFP-F1 tagcacgtgcaatttttaaaattaaaggcgttacccaacagaggagaaatactagatgcg cg44-RBS-GFP-F2 agtctttattgattcagttattatgctagcacgtgcaatttttaaa cg44-pHH-A gcataataactgaatcaataaagactgtaaagtcggcgatataggcgc GFP-pHH-B tactagagtcacactggctcatcaccgatggggaagatc P2-lpsA-F ctaggtatagtgctagcattcgtgcaatttttatgaggtaccgaattctcac P2-pHH-R cacgaatgctagcactatacctaggactgagctagccgtaaactcgagccaggcatc P1-IpsA-F gtcctaggtatagtgctagcattcgtgcaatttttatgaggtaccgaattctcac P1-pHH-R gctagcactatacctaggactgagctagccgtcaactcgagccaggcatc P5-lpsA-F gccctaggtattatgctagcattcgtgcaatttttatgaggtaccgaattctcac P5-IpsA-F gctagcataatacctagggctgagctagccgtaaactcgagccaggcatc XhoI-P3-F aaaaactcgagttgacagctagctcagtcctaggtattgtgctagc KpnI-P3-R aaaaaggtacctcataaaaattgcacgaatgctagcacaatacctaggac Xhol-P4-F aaaaaggtacctcataaaaattgcacgaatgctagcatagtacctaggactgag KpnI-P4-R aaaaactcgagctgatagctagctcagtcctagggattatgctagc EcoRI-IpsA-F tgcagaattcaaagaggagaaatactagatgattatgggtaggaaacaacaatacgga BamHI-lpsA-R agttggatccctagattggcgcaaccgtgg cg44-flp-F ctttacaactgaatcaataaagagtattatgctagcacgtgc cg44p-RBS-GFP-F tagcatctttattgattcagtttaaaggcgttacccaacagaggagaaatactagatgcg cg44p-RBS-GFP-F2 ctagctcagtcctaggtattatgctagcatctttattgattcagtttaaagg cgAp-RBS-GFP-F tagcaaattgatcgatcaagcttaaaggcgttacccaacagaggagaaatactagatgcg cgAp-RBS-GFP-F2 agtcctaggtattatgctagcaaattgatcgatcaagctt
2. myo-inositol Biosensor Development
Table 2.4. List of plasmids used in this study.
Plasmid Genotype Reference
pHHDO1K Empty vector, parent plasmid for sensors 90
pHH-cg44-GFP-P1-ipsA ... pHHDO1K with gfp expressed from hybrid promoter variant this study pHH-cg44-GFP-P5-ipsA cg44; ipsA expressed from constitutive promoters P1-P5
pHH-cg44-GFP-Ptet-ipsA pHHD01K with gfp expressed from hybrid promoter variant this study cg44; ipsA expressed from aTc-inducible Ptet promoter
pHH-cg44p-GFP-Ptet-ipsA same as pHH-cg44-GFP-Ptet-ipsA with IpsA binding site this study cg0044 located downstream of the -10 region
pHH-cgA-GFP-Ptet-ipsA pHHDO1K with gfp expressed from hybrid promoter variant this study cgA, containing one of the IpsA binding sites from C.
glutamicum gene cg3323 located between the -35 and -10
regions; ipsA expressed from aTc-inducible Ptet promoter
pHH-cgAp-GFP-Ptet-ipsA same as pHH-cgA-GFP-Ptet-ipsA with IpsA binding site this study cg3323A located downstream of the -10 region
pHH-cgA-flp-GFP-Ptet-ipsA same as pHH-cgA-GFP-Ptet-ipsA with cg3323A binding site this study located on opposite strand
pHH-cg44-flp-GFP-Ptet- same as pHH-cg44-GFP-Ptet-ipsA with cg0044 binding site this study
ipsA located on opposite strand
pHH-cgBAdp-GFP-Ptet- IpsA binding site cg3323A located downstream of the -10 this study ipsA region and cg3323B located upstream of the -35
pHH-cg44dp-GFP-Ptet- IpsA binding site cg0044 located downstream of the -10 this study ipsA region and upstream of the -35
pHH-cg44dc-GFP-Ptet- IpsA binding site cg0044 located upstream of the -35 and this study ipsA between the -35 and -10 hexamers
pHH-cg44cp-GFP-Ptet- IpsA binding site cg0044 located downstream of the -10 and this study ipsA between the -35 and -10 hexamers
2. myo-Inositol Biosensor Development
2.3 Results and Discussion
2.3.1 Construction and Characterization of the myo-Inositol Biosensor
To construct the MI biosensor, E. coli were engineered to express ipsA and its cognate promoter
driving expression of a reporter gene. However, initial attempts to directly import the IpsA-regulated promoters from C. glutamicum into E. coli yielded no expression, likely because E. coli
RNA polymerases could not recognize the foreign promoter. E. coli promoters, however, are well characterized39
,9 1, allowing simple design of a repressor-operator architecture. We engineered hybrid promoters that contained -35 and -10 regions recognizable by the native E. coli 070 RNA
polymerase, and an IpsA DNA binding site to permit IpsA-mediated transcription (Figure 2.1A). In this system, IpsA represses transcription from the hybrid promoter, presumably by blocking access to RNA polymerase. Binding of MI to IpsA causes the complex to unbind from DNA and transcription to proceed. This system may be used to exercise MI-inducible control of expression
over any gene placed downstream of the hybrid promoter.
A
IpsA binding siteRBS
Transcription start site Hexamers recognized by E. coli RNAP
OH
B
HO, H OH M11 PLon hybrid qon A-C
900
-'800 1 S700
-w
600
(4 S500-E
0400
m300
aL.
200L100
0
0.0
0.1 1 MI fed (g/L)Figure 2.1. Construction and characterization of the MI biosensor. (A) Architecture of the hybrid
promoter. See Figure 2.2 for alternate hybrid promoter configurations. (B) Biosensor circuit,
where a constitutive promoter expressing ipsA results in repression of the hybrid promoter
driving gfp expression, and gfp is de-repressed in the presence of MI. (C) GFP fluorescence
normalized to biomass in MG1655 (DE3) cells harboring the sensor or control plasmids as a
response to MI added to LB medium. Measurements were taken 24 hours post-inoculation.
Individual points with error bars represent the mean
1 S.D. of three replicate cultures. Data
points were fitted to a dose-response transfer function to yield smooth curves. P1-P5 represent
the different promoters corresponding to Pcon in (B) driving ipsA expression (Figure 2.3 and Table
2.2). No IpsA: sensor-less plasmid expressing gfp from the hybrid promoter. No GFP: empty
vector.
For initial characterization of the biosensor, we placed gfp under control of the hybrid promoter
and measured the GFP fluorescence output at a range of MI concentrations (Figure 2.1B).
Fluorescence measurements revealed a dose-dependent response to MI (Figure 2.1C), with
increasing MI concentrations leading to increased fluorescence. Because it has been shown that
placing the transcription factor binding site at different or multiple locations on the promoter
may affect sensor behavior, we investigated multiple hybrid promoter variants with varying IpsA
-P1
-P2 -P3 -P4-P5
-No IpsA -No GFP 01 0.01 10 100 I2. myo-Inositol Biosensor Development and ipsA expression levels generated a diverse collection of Mi biosensors with varying dose-response behavior, providing tunable options for pathway applications.
The binding sites cg44 and cgA were obtained from the promoter regions of C. glutamicum genes
cg0044 and cg3323 respectively. These binding sites were placed either between the -35 and -10 regions or downstream of the -10 region, as it has been shown that these locations lead to tight repression91 92
. We found the hybrid promoter variant with binding site cgA placed between -35 and -10 to be very leaky, and the variant with cgA on the opposite strand to have poor dynamic range (Figure 2.2). The remaining variants demonstrated similar dose response curves, and the hybrid promoter with binding site cg44 placed between the -35 and -10 regions was selected for further characterization (Figure 2.1). For additional tunability, the amount of IpsA in the circuit was modulated by utilizing promoters of different strengths to drive ipsA expression (Figure 2.3 and Table 2.2). As expected, increased expression of ipsA lowered the maximal GFP signal, and reduced the leaky expression in the absence of any MI (Figure 2.3 and Figure 2.4). The presence of multiple knobs for tunability allows flexibility in reaching similar GFP levels through different circuit architectures.
-cgAp -gA-p - -cg44-fipIs - pHHDO1 K 800 700 300 E 500 0 '1 400 L. 300 200 100 0 0.0 =i7 00-- 00---cg44cp -pHHDOiK E 500-00 L. 300 200 100 - - - VO4 0 --- - -0 0.001 0.01 0.1 1 10 1 MI (g/L) D 00 c.4 3E ' -0 cgBAdp --- CgA cS44-flp 41 3
-
cg44dp 3 1 +1 RBS g4 p' 44444 cgA At -5 cgA .1 +1 qB c44cp -41 -35_ q44 - 5854 B cg44p g44d cA-flp -41 __0 +1__ gp 41 -35S_ - -10 -i--- BS cgApFigure 2.2. Dose response curves of hybrid promoter variants. (A) and (B) GFP fluorescence normalized to biomass in MG1655 (DE3) cells harboring sensor plasmids with hybrid promoter variants as a response to MI added to LB medium. pHHDO1K represents the empty vector (no gfp) control. (C) Hybrid promoter designs for single binding site variants corresponding to dose response curves in (A). (D) Hybrid promoter designs for double binding site variants corresponding to dose response curves in (B). Sequences of the promoter variants are found in Table 2.1. Measurements were taken 24 hours post-inoculation. "No GFP" represents the empty vector parent plasmid used to construct the sensor plasmids, without ipsA expressed. Individual points with error bars represent the mean 1 S.D. of three replicate cultures. Data points were fitted to a dose-response transfer function to yield smooth curves.
0.01 0.1 1 10 1
MI (g/L)
01
2. myo-Inositol Biosensor Development 8000 7000 ' 6000 5000 4000 3000 CL-2000 1000 0 No RFP P1 P
P2
' I
I
Figure 2.3. Relative strengths of the promoters (P1-P5) used to drive ipsA expression, as measured by RFP fluorescence. MG1655 (DE3) cells harboring the plasmids with promoters P1-P5 driving rfp were cultured in LB medium for 24 hours prior to fluorescence measurement. Error bars denote 1 S.D. from the mean of three replicate cultures.
60 50 w 40 cc E 30 0 'fi20 a. LL 10
0
P1 P2 P3 P4 P5 NoGFPFigure 2.4. Leakage level (GFP fluorescence at 0 g/L MI) for each promoter P1-P5. MG1655 (DE3) cells harboring the sensor plasmids with hybrid promoter cg44 and promoters P1-P5 driving ipsA were cultured in LB medium for 24 hours prior to fluorescence measurement. "No GFP" represents the empty vector parent plasmid used to construct the sensor plasmids, without ipsA expressed. Error bars denote 1 S.D. from the mean of three replicate cultures.
In addition to evaluating the circuit with exogenously-added MI, we tested whether a response could be triggered from intracellularly produced MI. The enzyme MIPS (encoded by INO1), which facilitates the conversion of glucose to M177, was used to intracellularly produce MI from fed
demonstrated a 16- to 55-fold increase in fluorescence, depending on the expression level of IpsA (Figure 2.5A). Consistent with the trends observed with exogenously-added MI in previous trials, increased ipsA expression decreased the endpoint fluorescence measurement, even while all strains produced approximately 1.5 g/L MI (Figure 2.5B). This trend suggests that a circuit with increased IpsA concentration requires more MI to achieve the same GFP output as a circuit with weaker ipsA expression. Furthermore, increased ipsA expression lengthened the amount of time required for a rise in fluorescence (Figure 2.5C), suggesting that de-repression of gfp is delayed with increasing repressor concentration, and that modulating ipsA expression controls the timing of switching on the reporter gene. This collection of genetic circuits (P1-P5) provides a tunable range of production responses.
I1
2. myo-Inositol Biosensor Development
5-00
NInol
50
oNo Inol
00
50
A
$2
E
.21
IL0
10
0
B
2.5
2-%
1.5
2
1
-20.5
-01j
20
30
Time (h)
Figure 2.5. Sensor detection of MI produced from MIPS and phosphatase in MG1655 (DE3) cells. The cg44 hybrid promoter was used. (A) GFP response at 48 hours post inoculation. Expression of INO1 in darker bars; corresponding control (empty vector in place of INO1) in lighter bars. (B) Corresponding MI titers at 48 hours. P1-P5 represent the different promoters driving ipsA expression. No GFP refers to a vector expressing ipsA from the tet promoter with a multiple cloning site in place of GFP. (C) GFP response over time with INO1 expressed. Error bars represent + 1 S.D. from the mean of three replicate cultures.
[1m
UiC
0
U.0
400
300
200
100
0
-P1
--P2
--
P3
-P4
P5
No GFP
In this work we developed a MI biosensor in E. coli using a transcriptional regulator and cognate promoter sequences from C. glutamicum. The biosensor is modular and tunable, can detect extracellular MI levels between 0.01 - 10 g/L and intracellular MI produced by E. coli expressing
INO1, a heterologous MI-phosphate synthase. This tunable biosensor has potential applications as a genetic part in dynamic pathway regulation (Chapter 3) and as a high-throughput screening device in directed enzyme evolution (Chapter 4). These strategies aim to improve titers, yield, and productivity in the glucaric acid pathway.
3. Dynamic Regulation of MIOX