HAL Id: tel-01416000
https://tel.archives-ouvertes.fr/tel-01416000
Submitted on 13 Dec 2016
HAL is a multi-disciplinary open access
archive for the deposit and dissemination of sci-entific research documents, whether they are pub-lished or not. The documents may come from teaching and research institutions in France or abroad, or from public or private research centers.
L’archive ouverte pluridisciplinaire HAL, est destinée au dépôt et à la diffusion de documents scientifiques de niveau recherche, publiés ou non, émanant des établissements d’enseignement et de recherche français ou étrangers, des laboratoires publics ou privés.
Zooming in on star formation in the brightest galaxies of
the early universe discovered with the Planck and
Herschel satellites
Raoul Cañameras
To cite this version:
Raoul Cañameras. Zooming in on star formation in the brightest galaxies of the early universe discovered with the Planck and Herschel satellites. Cosmology and Extra-Galactic Astrophysics [astro-ph.CO]. Université Paris-Saclay, 2016. English. �NNT : 2016SACLS237�. �tel-01416000�
NNT : 2016SACLS237
T
HÈSE
DE
DOCTORAT
DE
L’U
NIVERSITÉ
P
ARIS
-S
ACLAY
PRÉPARÉE
À
L’U
NIVERSITÉ
P
ARIS
-S
UD
I
NSTITUTD'A
STROPHYSIQUES
PATIALEE
COLED
OCTORALEN° 127
Astronomie et Astrophysique d’Île-de-France
Spécialité Sciences de l'Univers
Par
Raoul CAÑAMERAS
Zooming in on star formation in the brightest galaxies of the early
Universe discovered with the Planck and Herschel satellites
Thèse présentée et soutenue à Orsay
,
le 26 septembre 2016
Composition du Jury
Pr. Laurent VERSTRAETE Professeur (Institut d'Astrophysique Spatiale) Président du jury Pr. Véronique BUAT Professeur (Laboratoire d'Astrophysique de Marseille) Rapporteure Dr. Carlos DE BREUCK Astronome Associé (European Southern Observatory) Rapporteur Dr. David ELBAZ Ingénieur-Chercheur (Service d'Astrophysique – CEA Saclay) Examinateur Dr. Alessandro BOSELLI Directeur de Recherche (Laboratoire d'Astrophysique de Marseille) Examinateur Dr. Nicole NESVADBA Chargée de Recherche (Institut d'Astrophysique Spatiale) Directrice de thèse
Titre : Zoom sur la formation stellaire au sein des galaxies les plus brillantes de l'univers jeune
découvertes avec les satellites Planck et Herschel
Mots clés : galaxies lointaines, formation stellaire, lentillage gravitationnel Résumé : Les galaxies amplifiées par
lentillage gravitationnel fort offrent une opportunité exceptionnelle pour caractériser la formation stellaire intense au sein des galaxies poussiéreuses les plus distantes. Dans les cas les plus favorables, il est possible d'étudier les mécanismes qui régissent la formation stellaire jusqu'aux échelles des régions de formation d'étoiles individuelles. Les alignements fortuits entre ces galaxies actives et des structures d'avant-plan produisant des facteurs d'ampli-fication par lentillage gravitationnel >>10 restent néanmoins très rares. L'échantillon des Planck's Dusty GEMS (Gravitationally Enhan-ced subMillimeter Sources), découvert par le relevé de ciel complet du satellite Planck dans le domaine sub-millimétrique, contient onze galaxies à haut décalage spectral extrêmement brillantes. Leurs densités de flux à 350 microns se situent entre 300 et 1000 mJy, au-delà de la plupart des sources lentillées précédemment décou-vertes par les relevés en infrarouge lointain et sub-millimétrique. Six d'entre elles dépassent la limite en complétude à 90% du catalogue de sources ponctuelles détectées par Planck (PCCS), indiquant qu'elles sont parmi les plus brillantes sources lointaines sélection-nées par leur formation stellaire intense. Cette thèse s'intègre dans le suivi multi-longueur d'onde de cet échantillon exceptionnel, destiné à sonder les propriétés globales des sources d'arrière-plan et à contraindre les confi-gurations de lentillage. Premièrement, j'utilise de l'imagerie et de la spectroscopie en visible et en infrarouge proche et moyen pour caractériser les structures formant la lentille et pour construire des modèles de lentillage gravitationnel complets. J'en déduis que les onze GEMS sont effectivement alignées avec des surdensités de matière en avant-plan,
soit des galaxies massives et isolées, soit des groupes ou amas de galaxies. Ces objets amplifiants contiennent des populations d'étoiles évoluées et âgées de plusieurs milliards d'années, indiquant qu'il s'agit de galaxies précoces. De plus, la modélisation détaillée de l'effet de lentillage vers les GEMS suggère que les amplifications atteignent systématiquement des facteurs >10, et >20 pour certaines lignes de visée. Deuxièmement, nous observons dans les domaines infrarouge lointain et millimétrique pour caractériser les sources d'arrière-plan. Les données en interférométrie de l'IRAM et du SMA à des résolutions inférieures à la seconde d'arc montrent que les GEMS ont des morphologies très déformées, preuve de fortes distorsions gravitationnelles. J'obtiens des températures de poussières de 33 à 50 K et des luminosités atteignant 2x10¹⁴ luminosités
solaires en infrarouge lointain, sans corriger du facteur d'amplification. La relation entre tempé-ratures de poussières et luminosités infrarouge confirme également que, pour une température donnée, les GEMS sont plus brillantes que les galaxies similaires non lentillées. Je conclus qu'à ces longueurs d'onde, le chauffage des poussières semble être dominé par l'activité de formation stellaire avec une contamination par d'éventuels noyaux actifs systématiquement inférieure à 30%. Nous trouvons des décalages vers le rouge compris entre 2.2 et 3.6 grâce à la détection d'au moins deux raies d'émission du gaz atomique ou moléculaire par source. Finalement, je cible les trois sources lentillées de l'échantillon ayant les propriétés les plus remarquables. En particulier, la plus brillante d'entre elles s'avère être un sursaut présentant des densités de formation stellaire proches de la limite d'Eddington, et permet de sonder la naissance des étoiles dans ses phases les plus extrêmes.
Université Paris-Saclay
Espace Technologique / Immeuble Discovery
Title : Zooming in on star formation in the brightest galaxies of the early universe discovered with
the Planck and Herschel satellites
Keywords : distant galaxies, star formation, gravitational lensing Abstract : Strongly gravitationally lensed
galaxies offer an outstanding opportunity to characterize the most intensely star-forming galaxies in the high-redshift universe. In the most extreme cases, one can probe the mechanisms that underlie the intense star formation on the scales of individual star-forming regions. This requires very fortuitous gravitational lensing configurations offering magnification factors >>10, which are particularly rare toward the high-redshift dusty star-forming galaxies. The Planck's Dusty GEMS (Gravitationally Enhanced subMilli-meter Sources) sample contains eleven of the brightest high-redshift galaxies discovered with the Planck sub-millimeter all-sky survey, with flux densities between 300 and 1000 mJy at 350 microns, factors of a few brighter than the majority of lensed sources previously discovered with other surveys. Six of them are above the 90% completeness limit of the Planck Catalog of Compact Sources (PCCS), suggesting that they are among the brightest high-redshift sources on the sky selected by their active star formation. This thesis comes within the framework of the extensive multi-wavelength follow-up prog-ramme designed to determine the overall properties of the high-redshift sources and to probe the lensing configurations. Firstly, to characterize the intervening lensing structures and calculate lensing models, I use optical and near/mid-infrared imaging and spectros-copy. I deduce that our eleven GEMS are aligned with intervening matter overdensities
at intermediate redshift, either massive isolated galaxies or galaxy groups and clusters. The foreground sources exhibit evolved stellar populations of a few giga years, characteristic of early-type galaxies. Moreover, the first detailed models of the light deflection toward the GEMS suggest magnification factors systematically >10, and >20 for some lines-of-sight. Secondly, we observe the GEMS in the far-infrared and sub-millimeter domains in order to characterize the background sources. The sub-arcsec resolution IRAM and SMA interferometry shows distorded morphologies which definitively confirm that the eleven sources are strongly lensed. I obtain dust temperatures between 33 and 50 K, and outstanding far-infrared luminosities of up to 2x10¹⁴ solar luminosities before correcting for
the gravitational magnification. The relation-ship between dust temperatures and far-infrared luminosities also confirms that the GEMS are brighter than field galaxies at a given dust temperature. I conclude that dust heating seems to be strongly dominated by the star formation activity with an AGN contamination syste-matically below 30%. We find secure spectroscopic redshifts between 2.2 and 3.6 for the eleven targets thanks to the detection of at least two CO emission lines per source. Finally, I focus on the three gravitationally lensed sources showing the most remarkable properties including the brightest GEMS, a maximal starburst with star formation surface densities near the Eddington limit.
Université Paris-Saclay
Espace Technologique / Immeuble Discovery
Remerciements
J’aimerais tout d’abord remercier une nouvelle fois mes rapporteurs, V´eronique Buat et Carlos De Breuck, d’avoir consacr´e du temps `a la relecture du manuscrit et pour leurs commentaires constructifs sur les r´esultats de cette th`ese et leur pr´esentation. Merci `a mes examinateurs, Laurent Verstraete, David Elbaz et Alessandro Boselli, d’avoir accept´e d’´evaluer ce travail. Je voudrais ´egalement exprimer ma gratitude envers l’ensemble des membres de mon jury pour leurs questions tr`es constructives et leurs commentaires encourageants pendant la soutenance.
Je tiens `a remercier tout particuli`erement Nicole pour toute la confiance qu’elle a pu m’accorder et pour son soutien, ses pr´ecieux conseils et son enthousiasme communicatif durant cette th`ese. L’ensemble des interactions que nous avons pu avoir au sujet des galaxies lointaines ont rendu ces trois ann´ees scientifiquement passionnantes, et m’ont grandement incit´e `a poursuivre en post-doctorat sur ce sujet.
Merci aux permanents de l’IAS, en particulier `a ceux de l’´equipe MIC et du groupe cosmologie, avec qui j’ai pu avoir des discussions enrichissantes tout au long de cette p´eriode. Je suis partic-uli`erement reconnaissant envers Guillaume, Mathieu, Zahia, ainsi que Jacques, pour leur suivi et pour leurs conseils. Je voudrais ´egalement adresser mes remerciements `a Marceau pour nos interactions entam´ees durant la deuxi`eme ann´ee, qui m’ont beaucoup appris.
Bien d’autres membres du personnel de l’IAS ont contribu´e `a rendre cette p´eriode au laboratoire si agr´eable. Et j’aimerais adresser en particulier un grand merci `a l’´equipe administrative et au service informatique pour leur gentillesse.
Merci aux doctorants et post-doctorants pour cette l’atmosph`ere si sympathique jour apr`es jour ! Merci pour votre bonne humeur communicative. Nos pauses – de dur´ees variables selon les personnes environnantes (!) – ont ´et´e les bienvenues, notamment lors des p´eriodes de travail les plus intenses. Ces excellents moments se sont souvent prolong´es hors du laboratoire et j’esp`ere qu’ils se prolongeront ´egalement dans le futur, `a Orsay ou autre part sur le globe !
Je continuerai avec ma famille qui a ´et´e extrˆemement pr´esente `a mes cˆot´es pendant ces trois ann´ees. J’adresse en particulier d’immenses remerciements `a ma m`ere, ma grand-m`ere et ma soeur. Il est tr`es difficile de r´esumer ce que j’aimerais exprimer pour vous montrer que cette th`ese est aussi la vˆotre !
Un grand merci, Anne-Marie pour ces excellents moments en ta compagnie et pour tes encourage-ments, et Sylvie pour l’envoi Colissimo de produits Pyr´en´eens et pour ton soutien. Merci In`es pour tant de bonne humeur, de musique et de courage. Que de fiert´e d’ˆetre ton fr´erot ! Une grosse pens´ee pour mon grand-p`ere avec qui j’aurais aim´e discuter de ces galaxies amplifi´ees par lentille gravitation-nelle. Je garde une grande place dans cette page de remerciements pour mon p`ere, qui a largement particip´e `a d´evier mon int´erˆet d´ebordant pour le football (voir ci-dessous) vers des domaines plus divers tels que les sciences et l’astronomie. Ce travail acharn´e n’aurait pas pu aboutir s’il ne m’avait pas appris `a travailler avec acharnement !
Comment ne pas vous remercier vous tous – amis de promo, colocs, amis parisiens ou de contr´ees plus ensoleill´ees – qui m’avez fait passer de super moments durant ces trois ann´ees (mais pas seulement) et m’avez souvent permis de d´econnecter totalement des ´etoiles et des galaxies. Je n’´ecrirais pas de noms, de peur d’oublier quelqu’un, mais je sais que vous vous reconnaˆıtrez et je tiens `a vous remercier bien fort. Merci Rapha¨el pour cette amiti´e par-del`a les ˆages et les pays (la France et la Catalogne plus pr´ecis´ement) qui t’a amen´e jusqu’`a la salle 1-2-3 le 26/09/16.
Un bref mot de gratitude au RER B pour les ´emotions si fortes qu’il a pu me procurer. Mais j’adresserai plutˆot mes remerciements `a Pierre, Cl´ement, Maud et Marie-Co pour leur gentillesse. Grˆace `a vous j’ai ´evit´e de prendre le Noctilien un bon nombre de soirs !
Les semaines auraient ´et´e bien longues sans les coupures sportives, et en particulier les coupures footballistiques du mercredi. Chers Oranges, notre groupe me manquera beaucoup, mais je resterai `
a jamais Orange dans l’ˆame. Je vous remercie `a tous pour votre rigueur d´efensive, et surtout pour l’ensemble de ces moments de d´etente. Merci ´egalement aux courageux coureurs, compagnons des rares pauses d´ejeuner pendant lesquelles j’ai r´eussi `a prendre mon courage `a deux mains et `a prendre mes jambes `a mon coup pour me joindre `a eux ! Un merci tout particulier `a Pierre et Marco, comp`eres d’entraˆınement en premi`ere ann´ee, avec qui je me suis engag´e dans un grand d´efi loin de la vall´ee de Chevreuse.
Et bien sˆur, pour terminer, un immense merci est particuli`erement r´eserv´e `a Pascaline qui m’a donn´e un courage incommensurable pour traverser cette p´eriode intense qu’est la th`ese. Je me con-tenterai d’un smiley car les 228 pages suivantes ne seraient pas suffisantes pour te remercier dignement ;-)
R´
esum´
e
Durant cette th`ese, je me suis int´eress´e aux m´ecanismes de formation stellaire au sein des galaxies poussi´ereuses `a grand d´ecalage spectral1, en exploitant le ph´enom`ene de lentille gravitationnelle forte. Lors d’alignements fortuits, des galaxies isol´ees, groupes, ou amas massifs d’avant-plan peuvent jouer le rˆole de t´elescope gravitationnel en accroissant la brillance et la taille apparente de ces galaxies actives et lointaines. De telles configurations offrent une opportunit´e exceptionnelle pour caract´eriser la formation stellaire intense au sein de l’Univers jeune et, dans les cas les plus favorables, des facteurs d’amplification par lentille gravitationnelle 10 permettent d’acc´eder aux ´echelles des r´egions de formation stellaire individuelles.
Contexte et s´election de l’´echantillon
Cette th`ese pr´esente une premi`ere caract´erisation des ”Planck’s Dusty GEMS” (Gravitationally En-hanced sub-Millimetre Sources,Ca˜nameras et al. 2015), un petit ´echantillon de sources extrˆemement brillantes situ´ees `a z ∼ 2 − 3 et d´ecouvertes `a l’aide du relev´e de ciel complet du satellite Planck dans le domaine (sub-)millim´etrique. Il s’agit de onze galaxies pr´esentant des densit´es de flux de 300 `a 1000 mJy `a 350 µm, plus brillantes que la majorit´e des sources lentill´ees d´ecouvertes jusqu’`a pr´esent lors des relev´es de grande envergure men´es avec Herschel (Eales et al. 2010; Oliver et al. 2012) et le South Pole Telescope (Vieira et al. 2013). Cet ´echantillon ouvre donc une fenˆetre int´eressante sur la naissance des ´etoiles autour du pic de l’histoire cosmique de la formation stellaire (voir Fig.1.1 Madau & Dickinson 2014), au sein de galaxies atteignant des activit´es prodigieuses.
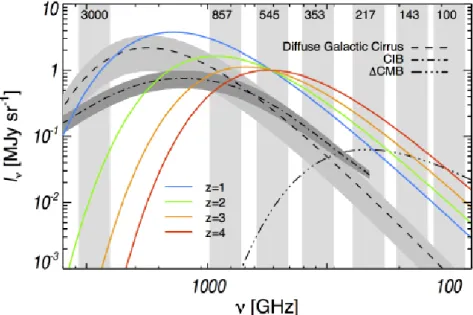
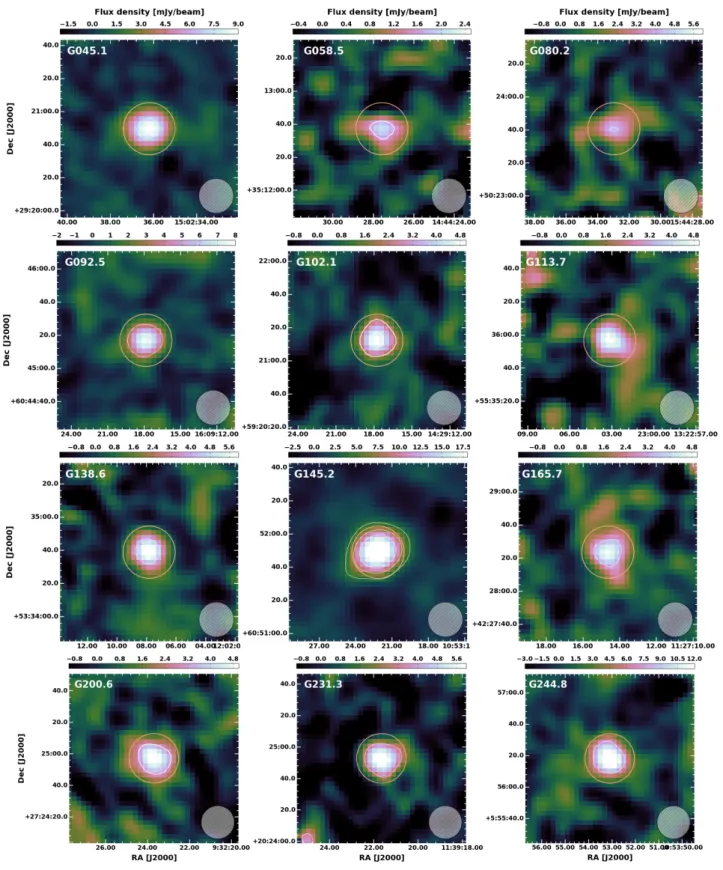
Sa s´election est bas´ee sur l’identification de candidats `a haut redshift dans les donn´ees de l’instrument HFI (High Frequency Instrument), install´e `a bord du satellite Planck, grˆace `a des crit`eres de couleur `a 350, 550 et 850 µm (voirPlanck Collaboration et al. 2015d). A ces longueurs d’onde, Planck offre des r´esolutions angulaires de 4-50 correspondant typiquement aux tailles angulaires d’amas de galaxies `a z ∼ 2 − 3, et ne permet donc pas de d´eterminer la nature astrophysique de ces candidats. De ce fait, c’est un suivi aux mˆemes longueurs d’onde et `a plus haute r´esolution angulaire men´e avec l’instrument SPIRE, `a bord de l’observatoire spatial Herschel, qui a permis d’isoler de potentielles sources lentill´ees. Il en r´esulte 11 cibles situ´ees dans des zones inexplor´ees du ciel extragalactique et directement ob-servables `a partir de l’h´emisph`ere nord. Il s’agit de sources ponctuelles, brillantes et isol´ees dans les cartes de SPIRE `a 250 µm et `a une r´esolution d’environ 1800, ayant les couleurs typiques de galax-ies poussi´ereuses `a haut redshift. Six d’entre elles proviennent du catalogue de sources compactes de Planck (PCCS, Planck Collaboration et al. 2014b) et d´epassent la limite de compl´etude `a 90% d’environ 600 mJy dans les bandes de fr´equences les plus ´elev´ees. Cela sugg`ere qu’elles appartiennent aux sources les plus brillantes de l’Univers jeune, s´electionn´ees par leur formation stellaire intense, sur 50% du ciel pr´esentant une faible contamination par l’´emission des poussi`eres Galactiques. Les cinq autres ont ´et´e initialement d´etect´ees lors d’une recherche de sources froides dans le fond cosmique infrarouge observ´e par Planck (Planck Collaboration et al. 2015c).
1
par abr´eviation de d´ecalage spectral vers le rouge, ´egalement d´esign´e par redshift ou simplement par z dans la suite de ce r´esum´e
N´ecessit´e d’un suivi multi-longueurs d’onde
Cette th`ese aborde d’une part l’analyse des configurations de lentille gravitationnelle, et d’autre part la caract´erisation des pouponni`eres d’´etoiles dans les sources sub-millim´etriques d´etect´ees avec Planck et Herschel. Une telle ´etude n´ecessite un suivi multi-longueurs d’onde, et le chapitre 3 pr´esente l’ensemble des observations men´ees durant ce suivi avec des instruments au sol ou dans l’espace. Globalement, l’´emission des r´eservoirs de poussi`ere chauff´es par la formation stellaire au sein des sources d’arri`ere-plan domine `a grande longueur d’onde, au-del`a de l’infrarouge moyen. Comme les GEMS sont des sources poussi´ereuses, elles sont n´ecessairement fortement obscurcies et donc tr`es t´enues `a plus courte longueur d’onde. En cons´equence, les domaines optique et infrarouge proche sont nettement domin´es par les populations stellaires des galaxies d’avant-plan, appartenant au potentiel gravitationnel amplifiant.
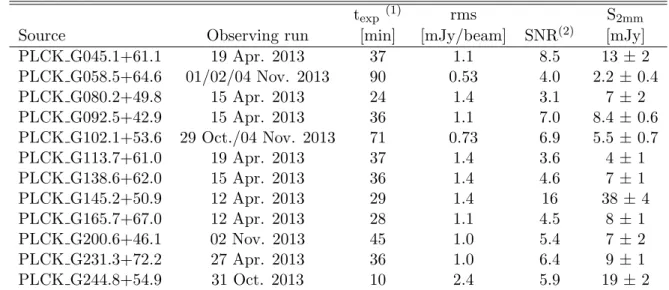
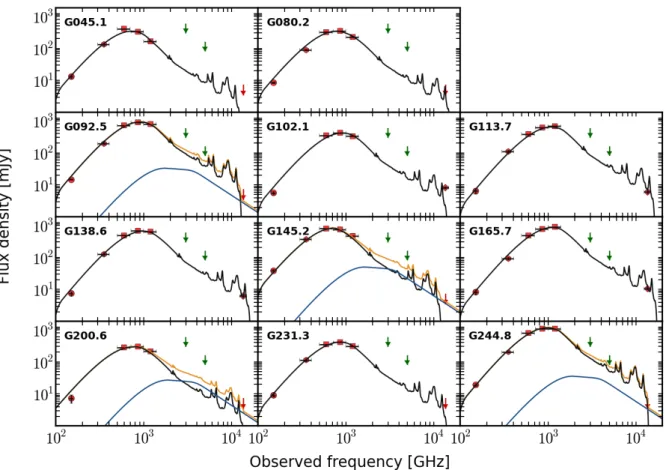
D’une part, l’´emission des poussi`eres dans les GEMS est analys´ee `a partir de l’imagerie de SCUBA-2 au JCMT et de GISMO au 30-m de l’IRAM, `a 850 µm et 2-mm respectivement, en compl´ement des trois bandes photom´etriques de SPIRE `a 250, 350 et 500 µm. J’inclus ´egalement les densit´es de flux ou bien les limites sup´erieures des relev´es IRAS `a 60 et 100 µm, et WISE `a 22 µm. Pour sa part, le spectrographe large bande EMIR sur l’antenne de 30 m`etres de l’IRAM permet d’observer les raies d’´emission de plusieurs traceurs du gas atomique et mol´eculaire tels que le CO, le [CI] ou H2O.
Nous basons ´egalement l’´etude sur des observations de l’interf´erom`etre SMA, en configuration COM et VEXT, de mani`ere `a r´esoudre l’´emission continuum des poussi`eres dans les GEMS. L’interf´erom´etrie du Plateau de Bure et d’ALMA atteint des r´esolutions angulaires sous la seconde d’arc et offre une vue d´etaill´ee des conditions physiques de la mati`ere interstellaire au sein de sources individuelles.
D’autre part, l’imagerie optique et infrarouge proche est essentielle pour identifier les lentilles et caract´eriser leur profil radial, leur d´ecalage vers le rouge, ainsi que leur masse projet´ee. Dans cette th`ese, j’utilise les cam´eras MegaCam et WIRCam au CFHT, FORS2 et HAWK-I au VLT, et IRAC `a bord du satellite Spitzer pour sonder la distribution de mati`ere en avant-plan sur des r´egions d’environ 50× 50. A 3.6 et 4.5 µm, IRAC est ´egalement sensible aux populations stellaires des composantes `a haut redshift. En compl´ement, la spectroscopie X-Shooter permet de d´eterminer pr´ecis´ement le redshift de la galaxie `a l’origine de l’amplification gravitationnelle vers la source sub-mm la plus lumineuse de l’´echantillon.
R´eservoirs de poussi`ere et formation stellaire int´egr´ee dans les GEMS
Les propri´et´es globales de l’´echantillon obtenues `a partir du suivi infrarouge lointain et sub-mm sont pr´esent´ees dans une publication (Ca˜nameras et al. 2015) ainsi qu’au chapitre4. La mesure des redshifts spectroscopiques des GEMS est effectu´ee avec le spectrographe EMIR qui permet d’observer la bande `
a 3-mm avec une couverture spectrale ´etendue (environ 16 GHz par r´eglage de fr´equence). Pour chaque source, notre strat´egie d’observation comportant deux r´eglages de fr´equence successifs inclut au moins une raie d’´emission du CO, pour un d´ecalage spectral z & 1.1. La d´etection d’au moins deux transitions par GEMS (soit CO(3-2) et CO(4-3), soit CO(4-3) et CO(5-4)) garantit des redshifts spectroscopiques robustes, dans l’intervalle z = 2.2 − 3.6.
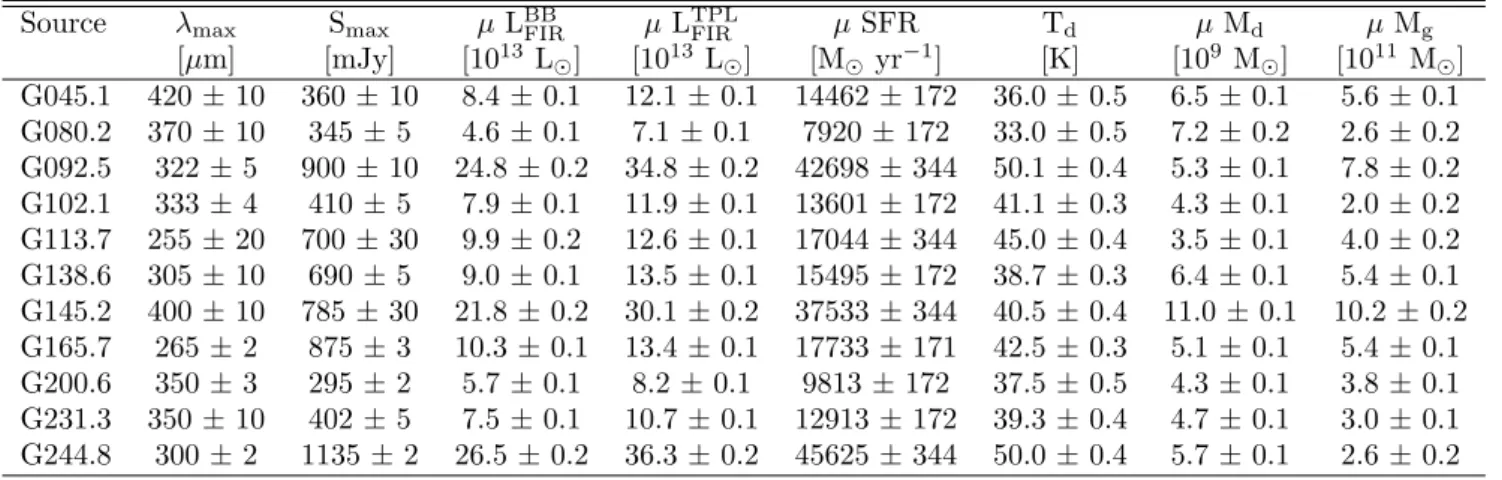
J’ajuste ensuite un corps noir modifi´e sur la photom´etrie infrarouge lointain et sub-mm pour car-act´eriser les r´eservoirs de poussi`ere froide. Des ajustements avec une composante unique sugg`erent des temp´eratures de poussi`ere dans l’intervalle Td= 33 − 50 K, en accord avec la caract´erisation d’autres
galaxies poussi´ereuses `a haut d´ecalage spectral (e.g., Greve et al. 2012; Weiß et al. 2013). De telles temp´eratures sont observ´ees aussi bien dans des galaxies sub-mm `a sursaut de formation stellaire in-tense que dans des galaxies poussi´ereuses distantes `a formation stellaire plus r´eguli`ere, sur la s´equence principale. Ces mˆemes ajustements permettent d’´evaluer les masses de poussi`ere et les luminosit´es infrarouge lointain des GEMS, de Md = (3.5 − 11) × 109 µ−1 M et LFIR= (4.6 − 27) × 1013 µ−1 M
respectivement. Des telles luminosit´es sugg`erent des taux de formation stellaire int´egr´ee dans l’intervalle 8000 − 46000 µ−1 M yr−1, d’apr`es le facteur de conversion de Kennicutt (1998). N´eanmoins, il est
important de rappeler que ces derni`eres grandeurs sont d´eduites des densit´es de flux boost´ees par lentille gravitationnelle et doivent, par cons´equent, ˆetre corrig´ees par les facteurs d’amplification.
L’analyse des distributions spectrale d’´energie illustr´ee par la Figure 4.9, ainsi que les donn´ees du relev´e FIRST `a 1.4 GHz, prouvent que les GEMS n’abritent pas de noyau actif puissant partici-pant au chauffage des poussi`eres de mani`ere significative. Au contraire, ce chauffage produisant des temp´eratures de poussi`ere inf´erieures `a 50 K semble totalement domin´e par la formation stellaire. D’autre part, de nombreux arguments empiriques tels que les morphologies r´esolues du continuum des poussi`eres et du gaz mol´eculaire, ou la relation entre Td et LFIR, confirment clairement la nature
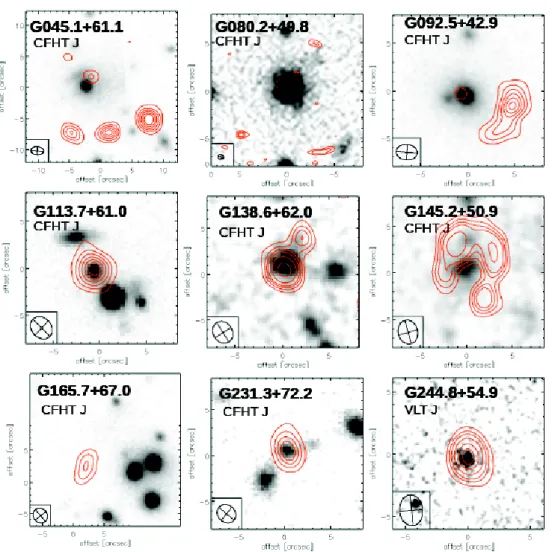
lentill´ee de chaque GEMS. Notamment, certaines de ces sources rouges se r´ev`elent compactes `a des r´esolutions angulaires de 200, tandis que la plupart forment des arcs gravitationnels ´etendus (Fig.4.6). Nous caract´erisons ´egalement la corr´elation infrarouge lointain radio pour notre ´echantillon et trouvons des valeurs du param`etre qIR tr`es dispers´ees. Certaines sources atteignent qIR∼ 2.7,
indi-quant un exc`es consid´erable d’´emission infrarouge lointain par rapport `a l’´emission synchrotron. Un tel r´egime peut ˆetre la cons´equence de mouvements turbulents dans le milieu interstellaire, comme ´egalement sugg´er´e par les profils ´elargis des raies d’´emission du CO. Les GEMS pr´esentent des rap-ports L0CO/Md de 40-140, compatibles avec un faible facteur de conversion αCO (e.g., Downes &
Solomon 1998), tel qu’attendu pour des galaxies massives et poussi´ereuses ayant des m´etallicit´es ´elev´ees (Magdis et al. 2011;Genzel et al. 2012). Ces arguments sugg`erent des masses de gaz mol´eculaire de (2 − 10) × 1011 µ−1 M . Enfin, la loi de Schmidt-Kennicutt int´egr´ee trac´ee en Figure4.12prouve que
cet ´echantillon contient des galaxies `a sursaut de formation stellaire ordinaires (par comparaison, en particulier, avec les ´echantillons de Daddi et al. 2010) et b´en´eficiant d’amplifications gravitationnelles ´elev´ees.
Distribution de la masse intervenant le long de chaque ligne de vis´ee
Notre mod´elisation du ph´enom`ene de lentille gravitationnelle forte est bas´ee sur une approche param´etrique et requiert, au pr´ealable, une caract´erisation des potentiels gravitationnels d’avant-plan. Afin de con-traindre la distribution de mati`ere le long des lignes de vis´ee vers chaque GEMS, j’utilise l’imagerie optique et infrarouge proche obtenue au CFHT et au VLT ainsi que les redshifts spectroscopiques disponibles dans les catalogues publics du Sloan Digital Sky Survey ou issus de nos propres observa-tions. L’analyse d´etaill´ee bas´ee sur ce jeu de donn´ees est pr´esent´ee au chapitre5 et suit trois ´etapes. Tout d’abord, j’estime les comptages de galaxies dans l’infrarouge proche, puis je mesure les redshifts photom´etriques des galaxies d’avant-plan pour enfin effectuer une recherche aveugle de la s´equence rouge dans l’optique et l’infrarouge proche.
Premi`erement, l’algorithme AKDE (Adaptive Kernel Density Estimate, Pisani 1996; Valtchanov et al. 2013) permet d’estimer la densit´e de galaxies par unit´e de surface dans un champ de r´ef´erence, pour en d´eduire la position et la significativit´e des surdensit´es de sources dans la bande K. En second lieu, je combine cette analyse bidimensionelle avec les quelques redshifts spectroscopiques disponibles (3.3.2ou SDSS-DR12,Alam et al.(2015)) et nos propres redshifts photom´etriques estim´es avec le code BPZ (Bayesian Photometric Redshifts,Ben´ıtez 2000), afin d’identifier sans ´equivoque les structures de
Figure 1: Image trois couleurs d’une source de l’´echantillon ”Planck’s Dusty GEMS” utilisant les bandes r et K de MegaCam et WIRCam, respectivement, et le canal `a 4.5 µm d’IRAC. Sur ce champ de vue, les arcs gravitationnels d´etect´es par Planck et Herschel dans les domaines infrarouge lointain et sub-millim´etrique ont des couleurs tr`es rouges et une morphologie fragment´ee. Ils se situent `a z = 2.24, derri`ere deux groupes de galaxies `a z = 0.35 (cercles bleus) produisant la majeure partie de l’amplification gravitationnelle.
galaxies en direction des GEMS. Notre suivi en imagerie couvre la discontinuit´e `a 4000 ˚A (Dn(4000),
Connolly et al. 1995) – une discontinuit´e spectrale nettement marqu´ee dans les galaxies passives – pour des galaxies `a d´ecalage spectral interm´ediaire, augmentant ainsi la fiabilit´e de nos redshifts photom´etriques. Troisi`emement, j’utilise la s´equence rouge en tant que sonde des environnements denses (Gladders & Yee 2000) pour localiser les amas de galaxies les plus massifs. Apr`es avoir calibr´e nos mod`eles sur l’amas de Coma `a z = 0.023, j’effectue une recherche aveugle de cette s´equence `a z < 1.0 dans les diagrammes couleur-magnitude.
Comme r´esum´e au 5.5et sur la Figure 5.11, cette caract´erisation montre que chaque source sub-mm de notre ´echantillon est align´ee avec une structure d’avant-plan responsable de l’amplification gravitationnelle, g´en´eralement situ´ee `a z < 1. La moiti´e d’entre elles sont associ´es `a des galaxies isol´ees, tandis que seules trois d’entre elles sont clairement lentill´ees par des groupes ou amas de galaxies mis en ´evidence par l’analyse de surdensit´e et la distribution en redshift. Pour deux GEMS, nos mod`eles de s´equence rouge sont compatibles avec les exc`es de sources rouges et passives d´etect´es dans les diagrammes couleur-magnitude, sugg´erant des conglom´erats de galaxies particuli`erement denses au sein de ces potentiels gravitationels.
Mod´elisation de l’effet de lentille gravitationnelle forte avec LENSTOOL
La mod´elisation d´etaill´ee de l’effet de lentille forte est men´ee `a l’aide du logiciel LENSTOOL (Kneib 1993; Jullo et al. 2007), dans le but de d´eduire les masses int´egr´ees le long des lignes de vis´ee et les facteurs d’amplifications pr´ecis. LENSTOOLest un code public qui adopte le formalisme bay´esien pour optimiser la distribution de masse responsable du potentiel gravitationnel, `a partir des caract´eristiques structurales de la lentille et de la position et multiplicit´e des images lentill´ees. La Figure6.1pr´esente une telle association d’images multiples permettant de contraindre le mod`ele. Les incertitudes sont calcul´ees suivant une m´ethode de Monte-Carlo par chaˆınes de Markov (MCMC).
Seules quatre sources de l’´echantillon pr´esentant des contraintes observationnelles suffisantes sont mod´elis´ees de la sorte. Tout d’abord, je me focalise sur la GEMS la plus brillante r´esolue, par le SMA et ALMA, en un anneau d’Einstein quasi-complet de 1.400 de diam`etre (Fig.6.1). Je d´eduis du mod`ele de lentille qu’elle se trouve derri`ere une galaxie isol´ee produisant des amplifications de µ ∼ 10 − 20.
Cela sugg`ere que les propri´et´es apparentes de cette GEMS tracent des activit´es de formation stellaire intenses per¸cues au travers d’un t´elescope cosmique particuli`erement puissant. La masse int´egr´ee le long de la ligne de vis´ee produisant de telles amplifications et distorsions vaut (3.7 ± 0.5) × 1011 M ,
`
a l’int´erieur de l’anneau form´e par les arcs sub-mm. Le mod`ele me permet ´egalement de reconstruire la morphologie intrins`eque de cette GEMS dans le plan source et, bien sˆur, d’utiliser le facteur µ pour corriger l’ensemble des propri´et´es d´etermin´ees dans le Chapitre 4. Dans un deuxi`eme temps, je d´erive le mod`ele de lentille de chaque GEMS associ´ee `a un groupe ou amas de galaxies d’avant-plan, n´ecessitant d’introduire un halo de mati`ere noire de grande ´echelle (Kneib et al. 1996).
Etude d´etaill´ee de trois sources de l’´echantillon
Durant notre suivi de l’´echantillon complet – notamment avec l’interf´erom`etre de l’IRAM au Plateau de Bure, le SMA et ALMA – trois sources se sont av´er´e poss´eder des propri´et´es particuli`erement re-marquables. Tout d’abord le Malachite, une GEMS `a z = 2.6 et `a formation stellaire mod´er´ee, pr´esente une morphologie int´eressante dans le plan image. Elle comprend trois composantes distribu´ees le long d’une ligne critique de 1200 de diam`etre, dont deux images multiples d’une r´egion intrins`equement compacte et un arc ´etendu sur plus de 500. J’utilise les observations du CO(3-2) `a une r´esolution angulaire inf´erieure `a la seconde d’arc pour ´etudier la cin´ematique perturb´ee du gaz mol´eculaire dans cette source. Les offsets en vitesse atteignent 600 km s−1 entre chaque extr´emit´e des composantes compactes, sugg´erant qu’elles tracent une r´egion de recouvrement entre deux galaxies en interaction, comme observ´e par le pass´e dans d’autres sources sub-mm.
Ensuite, nous utilisons la raie de structure fine [CII] observ´ee avec l’interf´erom`etre ALMA `a une r´esolution de 0.300, pour sonder les propri´et´es du gaz interstellaire dans le Grenat (Nesvadba et al. 2016). Nous caract´erisons uniquement l’une des quatre composantes de la source d’arri`ere-plan. Nous pr´esentons d’une part les cin´ematiques r´esolues au sein de cette composante, d´eduites du [CII] observ´e en ´emission. Mais nous pr´esentons surtout la premi`ere d´etection d’une caract´eristique d’absorption du [CII] hors de la Voie Lact´ee (Fig.7.9). En g´en´eral, de telles raies d’absorption du [CII] tracent le milieu interstellaire diffus de notre Galaxie (e.g., Gerin et al. 2015) et sont d´etect´ees en direction de r´egions de formation stellaire produisant une ´emission continuum brillante. Dans notre cas, nous attribuons cette caract´eristique spectrale `a un r´eservoir de mati`ere gazeuse situ´e entre l’observateur et la source de continuum sub-mm, et en train de chuter vers cette derni`ere. Pour cette raison, le Garnet offre une opportunit´e rare pour ´etudier le gaz dans une galaxie `a grand d´ecalage spectral, en dehors des r´egions de formation stellaire intenses. Ces r´esultats, combin´es aux rapports L[CII]/LFIR, montrent que la
d´etection de cette raie de structure fine `a haute redshift sonde une large gamme d’environnements, du gaz dense aux r´eservoirs plus diffus et ´etendus.
Finalement, je caract´erise la source la plus brillante de notre ´echantillon, le Ruby. Cette source `a sursaut de formation stellaire poss`ede des propri´et´es extrˆemes dans le plan image. Elle est lentill´ee par une seule galaxie d’avant-plan et forme un anneau d’Einstein quasi-complet d’environ 1.400de diam`etre. Nous mesurons des intensit´es de formation stellaire exceptionnelles, de 1000 `a 5000 M yr−1 kpc−2,
au sein des amas de formation stellaire distribu´es le long des arcs sub-mm et r´esolus avec le SMA. J’utilise la distribution spectrale d’´energie en optique et infrarouge pour distinguer les populations stellaires ´evolu´ees provenant de l’avant-plan et les populations plus jeunes et att´enu´ees ´emises par le Ruby en arri`ere-plan. Cela me permet de d´eduire une masse stellaire M∗= (2.5 − 3.0) × 1011 M pour
la galaxie amplifiante qui se situe `a un d´ecalage spectral ´etonnamment ´elev´e (z = 1.52, comparable aux lentilles gravitationnelles les plus distantes,van der Wel et al. 2013;Wong et al. 2014).
Une caract´erisation pr´eliminaire des conditions du gaz mol´eculaire et des processus de formation stellaire dans cette GEMS est obtenue grˆace `a l’interf´erom´etrie CO(4-3) d’ALMA, `a une r´esolution de 0.100. Ce cube de donn´ees confirme que l’´emission du CO(4-3) et du continuum des poussi`eres `a
3-mm ont une morphologie fragment´ee (voir Fig.7.15). La majeure partie de l’´emission provient en r´ealit´e d’un total de dix noeuds, pr´esentant des offsets en vitesse ´elev´es (de -600 `a +200 km s−1) et un intervalle de dispersions de vitesse tr`es large (25-330 km s−1). Finalement, apr`es avoir d´eduit une masse dynamique Mdyn= 3 × 10¹⁰ M , je sonde la relation de Schmidt-Kennicutt r´esolue `a la
Figure7.16. Cette figure met clairement en ´evidence une efficacit´e de formation stellaire accrue dans le Ruby, en comparaison avec les galaxies actives proches (e.g., Andrews & Thompson 2011) et les nuages mol´eculaires g´eants les plus denses de notre Galaxie. L’analyse sugg`ere que pour chaque noeud, environ 30% du gaz est transform´e en ´etoiles par temps de chute libre. Il s’agit d’une valeur bien sup´erieure aux 1% mesur´es habituellement dans l’univers local (e.g.,Krumholz & Tan 2007). Elle est cependant comparable aux efficacit´es mesur´ees dans les r´egions internes des nuages mol´eculaires g´eants de la Voie Lact´ee (Alves et al. 2007). Ces r´esultats sugg`erent donc que les r´egions de formation stellaire dans les galaxies poussi´ereuses `a grand d´ecalage spectral pourraient ressembler `a des coeurs de nuages mol´eculaires g´eants ´etendus sur plusieurs dizaines de parsecs (voir aussiStacey et al. 2010;
Swinbank et al. 2011).
Cette GEMS est ´egalement id´eale pour d´eterminer les processus limitant la formation stellaire dans ses phases les plus extrˆemes. En particulier, les dispersions de vitesse mesur´ees avec le cube de donn´ees ALMA sugg`erent que la turbulence pourrait compenser l’effondrement gravitationnel, et donc limiter la formation des ´etoiles dans le Ruby. Au §7.3.6, nous discutons des processus physiques potentiellement capables de produire une telle turbulence. Cependant, les intensit´es de formation stellaire maximales pr´esent´ees `a la Figure 7.16 montrent que le Ruby tombe dans le r´egime des sursauts de formation stellaire proches de la limite d’Eddington et r´egul´es par la pression de radiation. Cela signifie donc que le processus de r´etroaction li´e `a la naissance des ´etoiles – dˆu `a la pression de rayonnement exerc´ee par les populations les plus jeunes et massives – pourrait permettre `a la formation stellaire d’ˆetre auto-r´egul´ee dans cette GEMS.
Contents
1 High-redshift star formation in the context of galaxy evolution 1
1.1 Introduction. . . 2
1.2 Why do we need to probe the universe at z∼2 ?. . . 2
1.2.1 The quenching of star formation . . . 3
1.2.2 The main sequence of star formation and the starburst mode . . . 3
1.2.3 Resolved Schmidt-Kennicutt law at high-redshift . . . 5
1.3 The populations of dusty galaxies at high-redshift. . . 7
1.3.1 Overall properties . . . 7
1.3.2 Morphology and kinematics . . . 7
1.3.3 Contribution of active galactic nuclei . . . 8
1.4 The help of strong gravitational lensing . . . 8
1.4.1 The theoretical framework. . . 9
1.4.2 Major astrophysical applications of strongly lensed systems . . . 14
1.4.3 Former surveys targeting lensed SMGs . . . 15
1.5 Zooming in on the intense star formation at z∼2-3 . . . 16
1.5.1 The need for spatially-resolved observations . . . 16
1.5.2 Toward an all-sky survey in the FIR/sub-mm . . . 17
1.5.3 Our approach : characterizing a small set of outstanding lensed sources . . . . 18
1.6 Thesis outline . . . 18
2 The Planck’s Dusty GEMS : Sample selection 20 2.1 Searching for bright star-forming galaxies at high-redshift . . . 21
2.1.1 The help of the negative k-correction . . . 21
2.2 The Planck selection of high-redshift candidates. . . 22
2.2.1 The Planck all-sky survey . . . 22
2.2.2 Selection of the candidates in the HFI maps . . . 22
2.3 Sample follow-up with Herschel/SPIRE . . . 25
2.3.1 Description of the instrument . . . 25
2.3.2 Follow-up observations and photometry . . . 25
2.4 Identification of the strongly lensed source candidates . . . 26
2.4.1 The search for high-redshift lensed galaxies . . . 26
2.4.2 Classification of the sources detected with Herschel/SPIRE . . . 27
2.4.3 Detection of lensed sources from the literature . . . 28
2.4.4 The final sample of gravitationally enhanced sub-millimeter sources . . . 28
3 Follow-up observations and data reduction 30 3.1 The need for a multiwavelength analysis . . . 31
3.2 Photometry . . . 31
3.2.1 CFHT and VLT optical/NIR photometry . . . 31
3.2.3 Band-merged catalogues in the optical and NIR. . . 41
3.2.4 IRAM 30-m telescope/GISMO imaging at 2 mm . . . 41
3.3 Spectroscopy . . . 42
3.3.1 IRAM 30-m telescope/EMIR . . . 42
3.3.2 VLT/X-Shooter observations of the brightest GEMS . . . 46
3.4 Interferometry . . . 47
3.4.1 PdBI/NOEMA . . . 47
3.4.2 SMA imaging at 850 µm . . . 49
3.5 Additional data in the mid-infrared to radio regime . . . 50
3.5.1 IRAS upper limits at 60 and 100 µm . . . 50
3.5.2 WISE photometry at 22 µm . . . 51
3.5.3 FIRST counterparts at 1.4 GHz. . . 51
3.5.4 Complementary follow-up observations . . . 52
4 Signatures of strong lensing, dust content and integrated star formation law in the GEMS 54 4.1 Secure spectroscopic redshifts in the millimeter . . . 55
4.1.1 Blind redshift search . . . 55
4.1.2 Comparison with external redshift distributions . . . 56
4.1.3 Profiles of the low-J CO lines . . . 58
4.2 Probing the dust reservoirs in the GEMS . . . 59
4.2.1 SED fitting in the far-infrared and the millimeter . . . 59
4.2.2 Measuring dust temperatures and dust masses . . . 60
4.2.3 Deriving far-infrared luminosities and star formation rates . . . 62
4.3 How can we claim that the GEMS are strongly lensed ? . . . 63
4.3.1 Flux densities and morphologies in the (sub)-millimeter . . . 63
4.3.2 Bolometric far-infrared emission compared to field galaxies . . . 66
4.3.3 Profile of the molecular gas lines . . . 68
4.4 Quantifying the AGN contribution to dust heating . . . 69
4.4.1 Standard AGN detection methods . . . 70
4.4.2 The DecompIR software . . . 70
4.4.3 AGN contributions in the GEMS . . . 72
4.5 Deriving molecular gas masses . . . 73
4.5.1 Converting the CO luminosities to molecular gas masses . . . 73
4.5.2 The molecular gas masses in the GEMS . . . 74
4.6 The FIR-radio correlation . . . 74
4.6.1 Physical principle. . . 74
4.6.2 Interpretation of the correlation for the GEMS . . . 75
4.7 Probing the integrated Schmidt-Kennicutt law in the GEMS . . . 77
4.7.1 Integrated star formation law in the GEMS . . . 77
4.7.2 Gas consumption timescales and star formation efficiencies . . . 78
4.8 Related personal publication . . . 79
5 Intervening mass distributions along the lines-of-sight 98 5.1 Overview of the methodology . . . 99
5.2 Number densities using galaxy number counts in the near-infrared . . . 99
5.2.1 The Adaptive Kernel Density Estimate . . . 99
5.3 Measuring the redshifts of foreground galaxies. . . 103
5.3.1 The foreground galaxies with spectroscopic redshifts . . . 104
5.4 The color red sequence as a probe of galaxy clusters . . . 115
5.4.1 The early-type population in galaxy clusters. . . 116
5.4.2 Modeling the galaxy red sequence . . . 117
5.4.3 Identifying lensing groups or clusters toward the GEMS . . . 121
5.5 What types of structure are magnifying the GEMS ? . . . 123
5.5.1 The nature of the lensing potentials . . . 123
5.5.2 Selection of the group/cluster members . . . 125
6 Modeling the strong gravitational lensing effect toward the GEMS 126 6.1 General methodology. . . 127
6.1.1 The global modeling approach . . . 127
6.1.2 The LENSTOOL code . . . 128
6.1.3 Identifying the multiply imaged systems . . . 128
6.1.4 Density profile of the dark matter components . . . 129
6.1.5 Optimization of the mass models . . . 130
6.2 Galaxy-galaxy strong gravitational lensing toward the brightest GEMS . . . 131
6.2.1 Simple mass model with LENSTOOL . . . 131
6.2.2 Constraining the foreground potential well. . . 131
6.2.3 Mass estimate of the foreground lensing galaxy . . . 135
6.2.4 Quantifying the gravitational magnification . . . 136
6.2.5 Source plane reconstruction . . . 138
6.3 Focus on the GEMS associated with galaxy groups or clusters . . . 139
6.3.1 Strong lensing by overdensities of foreground galaxies . . . 139
6.3.2 LENSTOOL mass models. . . 141
7 Properties of the most remarkable Planck’s Dusty GEMS 148 7.1 Spatially-resolved gas and dust properties of G080.2 at z = 2.6 . . . 149
7.1.1 Properties of the sub-millimeter source. . . 149
7.1.2 Integrated profiles of the spectral lines observed with EMIR . . . 150
7.1.3 Resolved gas kinematics from the CO(3-2) emission line . . . 151
7.1.4 Intrinsic nature of G080.2 . . . 155
7.2 An ALMA view on the extended [CII] emission and absorption at z = 3.4 . . . 158
7.2.1 Using the [CII] fine structure line as gas tracer . . . 158
7.2.2 Sub-millimeter properties of G045.1 . . . 159
7.2.3 Extended [CII] emission and absorption . . . 163
7.2.4 Comparison of the [CII]/FIR ratio and astrophysical implications . . . 166
7.2.5 Astrophysical nature of [CII] in G045.1 . . . 168
7.2.6 Related personal publication . . . 170
7.3 Probing the gas, dust and stars down to 100 pc scales in the brightest GEMS . . . 176
7.3.1 The sub-millimeter source . . . 176
7.3.2 Analysis of the optical-to-MIR spectral energy distribution . . . 177
7.3.3 Resolved dust continuum seen with the SMA at 850 µm and 0.3” beam size . . 181
7.3.4 An ALMA view of the gas kinematics and star formation law in G244.8 . . . . 181
7.3.5 Resolved star formation at the Eddington limit . . . 183
7.3.6 What limits star formation ? . . . 184
8 Summary and Outlook 187 8.1 Summary . . . 187
8.2 Future prospects . . . 189
B Optical SDSS spectra of lensing galaxies 206
List of Figures
1 Three-color image of G165.7 in r, K and IRAC channel 2 . . . IV
1.1 Cosmic evolution of the star formation rate volume density . . . 3
1.2 The star formation main sequence . . . 5
1.3 Geometric angles and angular diameter distances involved in the lens equation . . . . 10
2.1 Apparent flux densities versus redshift for typical ULIRG templates . . . 22
2.2 SED of the main astrophysical components in the sub-millimeter sky . . . 23
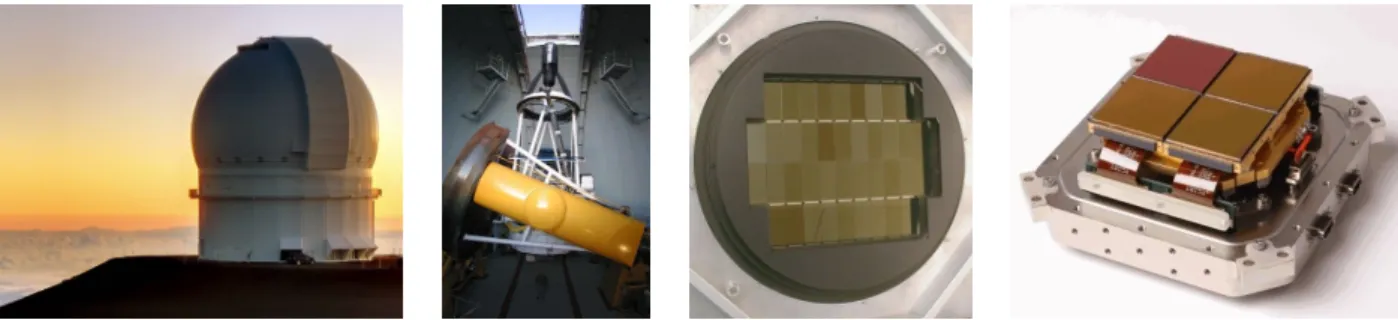
2.3 Sub-mm number counts for lensed and unlensed SMGs and the other main populations 26 2.4 Sub-mm flux densities of the GEMS compared with other samples from the literature 28 3.1 The Canada-France-Hawaii Telescope and its wide field cameras . . . 32
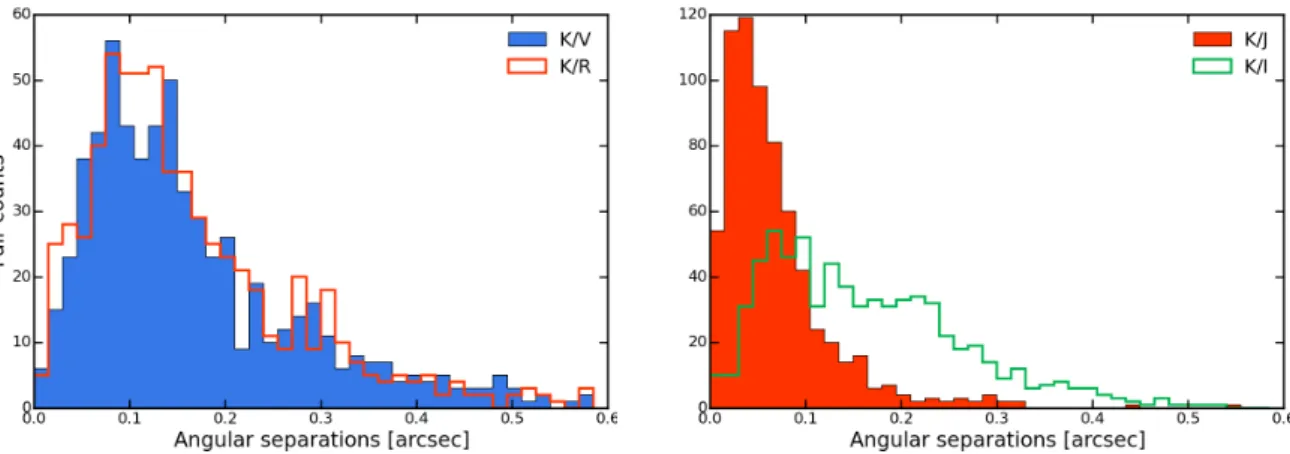
3.2 Angular separations in the field of G244.8 after applying our astrometric calibration . 34 3.3 IRAC curves of growth used to correct the aperture fluxes . . . 40
3.4 30-m telescope/GISMO images of the 2-mm continuum towards the GEMS. . . 43
3.5 VLT/X-Shooter spectrum of G244.8 showing two emission lines . . . 47
4.1 Lowest-J CO emission lines used in our redshift search . . . 55
4.2 Redshift frequency of the CO emission lines and the EMIR frequency tuning . . . 56
4.3 Lens and source redshifts for the surveys targeting lensed SMGs in the sub-mm . . . . 57
4.4 Modified black-body fit to the FIR-to-millimeter photometry . . . 61
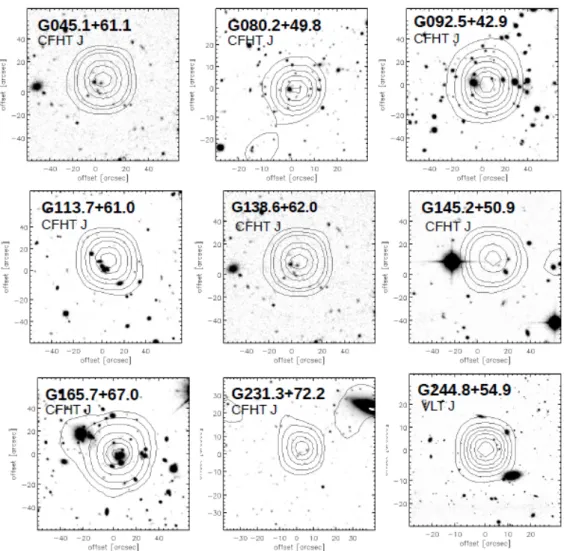
4.5 Herschel/SPIRE observations of the GEMS and J-band imaging of the foreground fields 64 4.6 Morphology of the GEMS with the SMA in the COM configuration and J-band imaging 65 4.7 FIR luminosities versus dust temperatures and FIR luminosities versus redshift . . . . 67
4.8 Magnification factors versus redshift and CO line luminosities versus line widths . . . 68
4.9 SED modeling with DecompIR for the whole sample . . . 71
4.10 Schematic illustration ruling out a dominant AGN contribution in G138.6 and G165.7 72 4.11 FIR-radio correlation of the GEMS compared to the other samples in the literature . . 76
4.12 Integrated star formation law in the GEMS . . . 78
5.1 Isodensity contours of the NIR number counts from the AKDE algorithm (1) . . . 102
5.2 Isodensity contours of the NIR number counts from the AKDE algorithm (2) . . . 103
5.3 The library of template SEDs used to derive the photo-z with BPZ . . . 108
5.4 Comparison between BPZ and SDSS photometric redshifts . . . 110
5.5 Calibration of our photo-z with the SDSS spectro-z . . . 112
5.6 Best-fitting SED for targets with robust photo-z computed with BPZ. . . 113
5.7 Full BPZ probability histograms for the GEMS behind K-band overdensities. . . 114
5.8 The BC03 templates with six different metallicities used to model the red sequence . . 118
5.9 Validation of the red sequence models with published color magnitude diagrams. . . . 121
5.10 Color-magnitude diagrams of the fields-of-view with color excesses consistent with a galaxy red sequence . . . 122
5.11 Synthesis of the foreground analysis for the four GEMS magnified by 3D structures . . 124
6.1 High resolution dust continuum of G244.8 from the SMA and ALMA. . . 132
6.2 Individual and joint PDFs for the mass profile parameters involved in the lens model of G244.8 . . . 134
6.3 Best-fitting lens model of G244.8 and predicted images . . . 135
6.4 Mass profile of the lensing galaxy toward G244.8 . . . 136
6.5 Distribution of the gravitational magnification factors toward two of the six clumps . . 137
6.6 Source plane morphology of G244.8. . . 138
6.7 The best-fitting lens model of G080.2. . . 144
6.8 Best-fitting lens model of G165.7, predicted images and source plane reconstruction. . 144
6.9 The integrated and projected mass-density towards G080.2 . . . 145
6.10 Distribution of the magnification factors toward each background object . . . 146
7.1 Single band and 3-color images of G080.2 with CO(3-2) contours from the PdBI . . . 150
7.2 Integrated spectra of the emission lines in G080.2 detected with EMIR . . . 151
7.3 Single gaussian fit to the kinematics of the CO(3-2) emission line . . . 152
7.4 Line profiles of individual pixels and integrated over the three components of G080.2 . 154 7.5 Three gaussian fit to the CO(3-2) line profile in the two compact components . . . 156
7.6 Scaling relation between the velocity dispersion and intrinsic size of molecular clouds . 158 7.7 Single band and 3-color images of G045.1 with CO(5-4) contours from the PdBI . . . 160
7.8 Integrated spectrum of the atomic carbon emission from G045.1 detected with EMIR. 161 7.9 Channel maps and integrated spectrum of CII emission and absorption detected with ALMA . . . 164
7.10 CII-to-FIR luminosity ratio of the Garnet compared to different samples from the lit-erature. . . 167
7.11 Single band and 3-color images of G244.8 with dust continuum contours from the SMA 176 7.12 Fitting the SED of the lensing galaxy toward G244.8 with the template of Arp 220 . . 179
7.13 Deblending the foreground and background components in the overall SED . . . 180
7.14 High resolution dust continuum of G244.8 from the SMA and ALMA. . . 181
7.15 Sub-arcsec resolution ALMA observations of the CO(4-3) emission line in G244.8 . . . 182
7.16 Spatially resolved Schmidt-Kennicutt law in G244.8 . . . 184
7.17 Velocity dispersion of CO(4-3) as a function of the local gas surface density . . . 185
A.1 Additional density contours in the NIR from the AKDE algorithm . . . 205
B.1 SDSS spectra of foreground galaxies aligned with the high-redshift GEMS (1) . . . 206
B.2 SDSS spectra of foreground galaxies aligned with the high-redshift GEMS (2) . . . 207
C.1 Individual PDFs of the parameters involved in the lensing model of G045.1 . . . 208
C.2 Joint PDFs of the parameters involved in the lensing model of G045.1 . . . 209
C.3 Individual PDFs of the parameters involved in the lensing model of G080.2 . . . 210
C.4 Joint PDFs of the parameters involved in the lensing model of G080.2 . . . 211
List of Tables
3.1 Observing log of the optical/NIR follow-up at the CFHT in four bands . . . 36
3.2 Observing log of the optical/NIR follow-up at the VLT in five bands . . . 37
3.3 Near-infrared imaging of the GEMS in the two IRAC bands . . . 39
3.4 Observations with GISMO on the 30-m telescope and 2 mm flux densities . . . 42
3.5 Additional mid-infrared to sub-millimeter photometry of the GEMS . . . 51
4.1 Properties of the lower-J CO emission lines obtained with EMIR . . . 58
4.2 Physical properties of the dust continuum and gas masses in the GEMS . . . 62
4.3 Radio continuum properties of the GEMS from the FIRST all-sky survey . . . 75
5.1 Results of the adaptive kernel density estimate . . . 101
5.2 Spectroscopic redshifts of foreground galaxies from the SDSS survey . . . 105
5.3 Scatter and bias between SDSS and BPZ photo-z . . . 111
5.4 Red sequence slope and intercept from our models and measured on the Coma cluster 120
6.1 Best-fitting parameters of the mass distribution towards G244.8 . . . 135
6.2 Magnification regime toward each star forming clump . . . 137
6.3 Goodness-of-fit and rms in the lens plane for each arclet beyond the group-scale lenses 142
6.4 Best-fitting parameters of the potential wells towards G045.1, G080.2 and G165.7 . . . 143
6.5 Regime of gravitational magnification toward each background clump of G080.2 and G165.7 . . . 145
7.1 EMIR observations of three atomic and molecular lines in G080.2 . . . 150
7.2 Properties of the emission lines in G080.2 measured with EMIR . . . 151
7.3 Properties of the CO(3-2) line profiles integrated for each component of G080.2 . . . . 153
7.4 High-resolution CO(3-2) line profiles stacked within individual apertures . . . 153
7.5 EMIR observations of the atomic and molecular lines in G045.1 . . . 163
7.6 Properties of the emission lines in G045.1 measured with EMIR . . . 163
7.7 Properties of the emission and absorption lines seen in the integrated spectra of G045.1 165
Chapter 1
High-redshift star formation in the
context of galaxy evolution
Contents
1.1 Introduction . . . 2
1.2 Why do we need to probe the universe at z∼2 ?. . . 2
1.2.1 The quenching of star formation . . . 3
1.2.2 The main sequence of star formation and the starburst mode . . . 3
1.2.3 Resolved Schmidt-Kennicutt law at high-redshift . . . 5
1.3 The populations of dusty galaxies at high-redshift. . . 7
1.3.1 Overall properties . . . 7
1.3.2 Morphology and kinematics . . . 7
1.3.3 Contribution of active galactic nuclei . . . 8
1.4 The help of strong gravitational lensing . . . 8
1.4.1 The theoretical framework. . . 9
1.4.2 Major astrophysical applications of strongly lensed systems . . . 14
1.4.3 Former surveys targeting lensed SMGs . . . 15
1.5 Zooming in on the intense star formation at z∼2-3 . . . 16
1.5.1 The need for spatially-resolved observations . . . 16
1.5.2 Toward an all-sky survey in the FIR/sub-mm . . . 17
1.5.3 Our approach : characterizing a small set of outstanding lensed sources . . . . 18
1.1
Introduction
Understanding the cosmic structure formation from the Big-Bang to the present day requires studying the processes that underlie the growth of gravitationally bound structures from the near homogeneous initial state. It is now well established that the small temperature inhomogeneities of the cosmic mi-crowave background probed by several ground or space-based missions, including the Planck satellite, provide the adequate initial conditions for the characterization of mass assembly. A global picture of galaxy evolution has been obtained from a large number of multi-wavelength surveys, and from the detailed characterization of specific populations at different cosmic epochs. However, the formation of the first galaxies and their evolution throughout cosmic time remains an active area of research in observational cosmology. Several studies of distant galaxies are naturally based on observations of low or intermediate redshift slices of the universe and attempt to determine the similarities and fundamental differences between each population. Generally, focusing on the high-redshift universe allows to probe the physical mechanisms that led to the formation of the large scale structures and produced the great diversity of galaxies seen at low redshift.
In the framework of the Λ-CDM paradigm, it appears that the dark energy (Λ) and Cold Dark Matter (CDM) components play a substantial role for the formation and evolution of galaxies and that the gradual mass assembly constrain their growth, sometimes through gas-rich mergers. In the hierarchical model of galaxy formation and evolution, these occasional and violent events have a significant role in the increase of their size and stellar mass over cosmic time. In addition, the continuous accretion of diffuse gas from the cosmic web filaments can also replenish the interstellar medium of galaxies, fuel the active star formation, and affect their global evolution (Kereˇs et al. 2005). In contrast, strong galactic winds from young stellar populations or mass accretion onto the central supermassive black holes can result in large-scale outflows that eject the gas from the gravitational potential of the host galaxy (Heckman et al. 1990). These competing effects result in a decrease of the molecular gas fractions from about 50% at z ∼ 2 (Tacconi et al. 2013) to about 5% locally.
1.2
Why do we need to probe the universe at z∼2 ?
The time evolution of the cosmic star formation rate (SFR) density was probed in several studies during the last two decades, in multiple wavelength regimes from the rest-frame UV to the FIR. A consensus has emerged from these studies according to which most of the stars have been formed during a peak of star formation at 1 < z < 3 (e.g. Madau et al. 1996; Hopkins et al. 2006;Madau & Dickinson 2014). Figure1.1shows that the volume averaged star formation rate density at this cosmic epoch was an order of magnitude higher than today. This means that about half of the stars we see today were already in place by z ∼ 2 (Dickinson et al. 2003). Probing the formation mechanisms at z ∼ 2 is therefeore crucial to constrain the stellar mass build up in early galaxies and their overall evolution. This also implies that the cosmic epoch corresponding to lookback times of about 10 Gyr has a direct influence on the stellar populations and overall properties of local galaxies.
Moreover, the range z ∼ 2 − 3 probes the rapid phase of mass assembly for the most massive elliptical galaxies with M∗ & 1011 M seen in the local universe. Consequently, it is associated with the
time interval where the strong color bimodality between red early-type and blue late-type galaxies was implemented. This critical phase of particularly intense star formation activity can be characterized directly in the sub-millimeter regime, through the population of bright dust-enshrouded galaxies which will be further described in this introduction (Magnelli et al. 2012). For these reasons, z ∼ 2 − 3 corresponds to a turnover epoch in galaxy evolution and has solicited special efforts in the field of extragalactic astronomy, also facilitated by ever-improved long wavelength instrumentation. In this section, I will focus on the most interesting processes occuring at these redshifts and addressed in this thesis. Some of them remain poorly understood such as, for instance, the drop of star formation density observed at z < 2.
Figure 1.1: The cosmic evolution of the star formation rate volume density of Madau & Dickinson
(2014) (their Figure 9), obtained from a compilation of multiple surveys selected from the rest-frame ultraviolet (grey, blue, light green, dark green, turquoise, magenta and black points) or the infrared (brown, orange, light red and dark red points). The best-fitting model is plotted as a black line and shows a strong peak at z ∼ 2.
1.2.1 The quenching of star formation
Given the extreme environments observed at z ∼ 2 − 3, the evolutionary models predict a higher proportion of massive Star-Forming Galaxies (SFGs) at low redshift than actually observed. Thus, the minimal gas masses observed in the most massive local galaxies suggest a rapid quenching of the star formation at old lookback times. There is also growing evidence that this process differs in disks and ellipticals, involving different timescales (Schawinski et al. 2014). A large range of powerful mechanisms have been proposed in the literature, from Active Galactic Nuclei (AGN) feedback (Springel et al. 2005), strong tidal perturbations or galaxy mergers (Sanders & Mirabel 1996; Hopkins et al. 2006), to an abrupt change in the mode of gas accretion (Kereˇs et al. 2005). It is also widely recognized that, if strong gas outflows can remove sufficient amounts of gas from the host galaxy, the overall growth of the structure can be stopped and the star formation can be efficiently quenched. On the one hand, molecular gas outflows are commonly detected in nearby ULIRGs (e.g.,Cicone et al. 2014;
Feruglio et al. 2015; Garc´ıa-Burillo et al. 2015) and are either attributed to negative feedback from the AGN activity, to winds or intense radiation pressure from massive newborn stars (i.e. directly associated with the recent star formation), or to both effects. On the other hand, the discovery of massive gas-poor and quiescent galaxies at z ∼ 2 (e.g., Daddi et al. 2005) suggest that this process also takes place in the distant universe, amongst other arguments. In fact, fast ionized outflows are commonly detected in z ∼ 2 − 3 SFGs (Carniani et al. 2015) and also seem to be driven by the intense star formation (Newman et al. 2012) or, when present, by the central AGN (Genzel et al. 2014).
1.2.2 The main sequence of star formation and the starburst mode
As a general rule, it is established that dusty galaxies with higher gas masses form stars at higher rates. However, the stellar mass build up and overall growth of galaxies is actually governed by two distinct modes of star formation clearly illustrated in Figure1.2 :
• a steady mode in normal disks that define a tight correlation in the SFR-M∗ plane called the
• a more rapid starburst mode containing outliers of this sequence and generally assumed to be driven by mergers.
The tight correlation between star formation rate and stellar mass
The main sequence of star formation plays an important role in determining the physical nature of star formation in galaxies. It was characterized in several local studies using extensive UV/optical samples, such as subsets of the Sloan Digital Sky Survey with no AGN contamination (Brinchmann et al. 2004; Salim et al. 2005). A similar correlation was found in the Extended Groth Strip by
Noeske et al.(2007) and in GOODS by Elbaz et al.(2007) at z ∼ 1, showing that this sequence was already in place when the universe was about half of its current age. Furthermore one can probe the main sequence out to z ∼ 2 by selecting moderately star forming galaxies (Rodighiero et al. 2011), for instance with their photometry in the B, z and K bands (the BzK criteria, Daddi et al. 2004).
Daddi et al. (2007) use deep multi-wavelength observations of 1.5 < z < 2.5 galaxies in the GOODS field and apply this criteria to build a complete sample of SFGs without quiescent sources. They also detect a tight SFR − M∗ correlation for the galaxies showing counterparts in their 24 µm imaging.
Consequently, the detection of this feature up to z ∼ 2.5 suggests that galaxies falling on the main sequence have formed their stars gradually and during long timescales, probably thanks to the fueling of several gas rich inflows.
The slope of the main sequence is shallower than unity and strongly depends both on the sample selection and the SFR estimate. At z . 1.3, the slope varies at a characteristic mass ∼ 1010 M and
the SFR − M∗ relation tends to flatten at higher stellar masses (Lee et al. 2015). The normalization
of the correlation is a more crucial parameter and obviously increases from z ∼ 0 to z ∼ 2 (Elbaz et al. 2007; Daddi et al. 2007; Kurczynski et al. 2016). This means that, for a given mass, a z ∼ 2 galaxy falling on the fitted main sequence would form about 4 and 30 times more stars per unit time than similar sources at z ∼ 1 and z ∼ 0, respectively (Daddi et al. 2007). This trend probably highlights that the average star formation rate in galaxies declines steadily with decreasing redshift due to lower gas fractions, while the impact of starburst frequency and feedback efficiency is probably minor (Noeske et al. 2007). The dispersion of the SFR − M∗ correlation is constant out to z ∼ 1 (Noeske et al. 2007)
and the scatter does not seem to increase as would be expected in less massive galaxies with M∗
as low as ∼ 107 M (Kurczynski et al. 2016). In fact, interpreting this trend remains challenging
because SED fitting methods used to derive the SFRs and M∗ are probably averaging the variations
over timescales <100 Myr, that are typical for the underlying physical processes.
The population of extreme starbursts
Dusty starbursting galaxies are optically thick in the UV and they are therefore usually selected in the FIR regime where the star formation rates can be directly measured. This population both includes local ULIRGs and a fraction of the high redshift SMGs. Compared to the best-fitting main sequence they show much higher integrated star formation rates, up to 4-10 times higher for a given stellar mass (see Fig.1.2). Consequently, the specific star formation rates (SFR/M∗) of starbursts
are significantly offset compared to more gradually star-forming galaxies on the main sequence, and this physical parameter can be used to distinguish the two populations. For instance, these outliers amount to a significant portion of the large sample of sub-millimeter bright galaxies ofMagnelli et al.
(2012) characterized with the Herschel satellite.
The extreme star formation activity observed in these sources has been usually attributed to the tidal perturbations during gas rich mergers. This type of interaction could result in gaseous inflows along with strong concentration of gas and, consequently, in major burst of star formation. This scenario is supported by hydrodynamical simulations (e.g. Mihos & Hernquist 1996), but only about one third of the star-forming galaxies at z ∼ 1 − 3 show clear signatures of mergers or tidal interactions in their spatially-resolved gas kinematics (e.g.F¨orster Schreiber et al. 2009). Thus, alternative modes
of triggering of extreme star formation activity have been considered in the literature, as further described in1.3.1.
These two modes in the global picture of star formation
Rodighiero et al. (2011) first quantified the relative contribution of the two modes of star formation, during the 1.5 < z < 2.5 epoch that dominates the cosmic history of star formation (Fig.1.2). Using the Herschel/PACS follow up of the COSMOS and GOODS-S fields, they find that starburst galaxies have a minor role in the formation of stars since they only account for about 10% of the cosmic star formation rate density at z ∼ 2. The contribution of the starburst population only becomes significant when considering the SFR > 1000 M yr−1 regime. In addition, these starbursts – and particularly
those that are driven by major mergers – are expected to play a crucial role on the quenching of star formation and the morphological transformation of galaxies.
Figure 1.2: The star formation main sequence of Rodighiero et al. (2011) presented in the SFR-M∗
plane using four samples of galaxies at 1.5 < z < 2.5. The figure includes Herschel/PACS observations of the COSMOS (red circles) and GOODS-S fields (cyan squares), as well as BzK galaxies in COSMOS (black dots) and GOODS-S (black filled circles). The solid black line is the best-fitting main sequence ofDaddi et al.(2007), at z ∼ 2. The inset panel shows a similar relation for the specific star formation rate (i.e. SFR/M∗).
1.2.3 Resolved Schmidt-Kennicutt law at high-redshift The Schmidt-Kennicutt law
The Schmidt-Kennicutt empirical law between the gas mass surface density and star formation rate density was first derived in the Milky Way by M. Schmidt, who found a power law relation ΣSFR∝ Σngas.
Combining an analysis of young nearby stars and white dwarfs, with measurements of Helium abun-dance, he deduced a power in the range n ∼ 1 − 3 and recommended to adopt n = 2 (Schmidt 1959). Then,Kennicutt(1998) calibrated the relation using 61 local spirals and 36 infrared-luminous galaxies, finding a slope of 1.4 ± 0.15 in the log-space. He derived averaged gas mass surface densities from the neutral and molecular components and neglected the atomic gas in the infrared starbursts. This work
confirms that in the local universe, gas mass surface density seems to be the major parameter deter-mining the star formation intensity over several orders of magnitude. A mix of physical mechanisms could also put this tight correlation in place and no clear consensus has emerged yet. Subsequent studies have nonetheless shown that it holds over scales of around 100 pc to entire galaxies.
It is worth mentioning that the star formation observed in nearby galaxies is quite inefficient, with only 1% of gas collapsing per free-fall time. This is probably due to a combination of several processes that prevent the gravitational collapse. Turbulence enhanced by interstellar shocks must play a major role by stabilizing the gas clouds on large scales. Other energetic processes such as the radiation pressure from young massive stars, or galactic winds can significantly perturb the properties and structure of star-forming clouds. The ultraviolet photons indeed alter the atomic to molecular transition phase and heat the interstellar medium, while Jeans instability only occurs if this radiation is efficiently shielded (Krumholz et al. 2012). Star formation can become more efficient in strongly compressed gas reservoirs located, for instance, in the overlap region between merging galaxies (e.g.,
Genzel et al. 2010).
Challenges of the distant star formation
Star formation feedback seems to play a crucial role on the activity and global evolution of galaxies in the early universe. This ingredient and the main other processes observed at low-redshift have been characterized during the last two decades, with a major breakthrough occuring since the last few years due to the advent of a new generation of long-wavelength facilities. At the present time, it remains to be established whether the same mix of processes regulates the star formation efficiency and hence the star formation law at low and high-redshift. The higher stellar and gas mass surface densities observed in distant galaxies could have a great impact, but different heating mechanisms by UV radiation or cosmic rays might also be considered.
Several studies have emphasized that not all galaxies may strictly obey the same empirical star formation law. Genzel et al. (2010) find similar relations between total molecular gas mass and averaged star formation in normal star-forming galaxies at low and high redshift (1 < z < 3), and independent of the environment. However, at a given gas mass and both for local and distant sources, starbursts show 4-10 times greater star formation rates than these normal disks. They interpret this effect either as a result of a top-heavy initial mass functions in these systems (Baugh et al. 2005), or as evidence for merger-driven star formation or higher gas fractions. Daddi et al. (2010) also highlight these two regimes in the Schmidt-Kennicutt diagram which can be associated with a more rapid star formation mode for starbursts than normal disks (or higher dynamical timescales in disks). These results demonstrate the need to interpret the star formation efficiencies of these extremely star-forming sources and to disentangle the influence of dynamical instabilities and molecular gas fractions. This is particularly important at high-redshift where this population shows the most outstanding properties and where the environments differ significantly from the local universe. For example, one could consider that their interstellar medium contains more star-forming clouds than in more quiescent high-redshift galaxies (Lehnert et al. 2013), or the star formation efficiency per free-fall time could be higher (Dekel et al. 2009).
It is generally accepted that distant galaxies comprise dense star-forming clumps accross a more diffuse disk. Thus, a better understanding of the high-redshift star formation requires resolved obser-vations of these compact regions, ideally including the gas, dust and stellar components. From such constraints, one can determine if star formation is fundamentally different in gas-rich galaxies at z ∼ 2 and in quiescent Milky Way like disks at z ∼ 0. These data enable us to compare the properties of low and high-redshift starbursts and, finally, to conclude whether the populations of low and high-redshift sources follow common or separate modes of star formation. Unfortunately, the limited angular reso-lutions make it extremely difficult to probe these spatial scales and to resolve the Schmidt-Kennicutt relation at high-redshift.