Publisher’s version / Version de l'éditeur:
Proceedings 18th International Symposium on Ice, IAHR'06, 1, pp. 223-230, 2006
READ THESE TERMS AND CONDITIONS CAREFULLY BEFORE USING THIS WEBSITE. https://nrc-publications.canada.ca/eng/copyright
Vous avez des questions? Nous pouvons vous aider. Pour communiquer directement avec un auteur, consultez la
première page de la revue dans laquelle son article a été publié afin de trouver ses coordonnées. Si vous n’arrivez pas à les repérer, communiquez avec nous à [email protected].
Questions? Contact the NRC Publications Archive team at
[email protected]. If you wish to email the authors directly, please see the first page of the publication for their contact information.
NRC Publications Archive
Archives des publications du CNRC
This publication could be one of several versions: author’s original, accepted manuscript or the publisher’s version. / La version de cette publication peut être l’une des suivantes : la version prépublication de l’auteur, la version acceptée du manuscrit ou la version de l’éditeur.
Access and use of this website and the material on it are subject to the Terms and Conditions set forth at
Mechanics of Ice Compressive Failure, Probabilistic Averaging and
Design Load Estimation
Jordaan, Ian; Frederking, Robert; Li, Chuanke
https://publications-cnrc.canada.ca/fra/droits
L’accès à ce site Web et l’utilisation de son contenu sont assujettis aux conditions présentées dans le site
LISEZ CES CONDITIONS ATTENTIVEMENT AVANT D’UTILISER CE SITE WEB.
NRC Publications Record / Notice d'Archives des publications de CNRC: https://nrc-publications.canada.ca/eng/view/object/?id=625b1f78-b52e-4b1d-81e0-708850a602c1 https://publications-cnrc.canada.ca/fra/voir/objet/?id=625b1f78-b52e-4b1d-81e0-708850a602c1
Reprinted from:
Proceedings 18th International Symposium on Ice, IAHR’06 Vol. 1, pp 223-230, Sapporo, Japan, 2006.
MECHANICS OF ICE COMPRESSIVE FAILURE, PROBABILISTIC
AVERAGING AND DESIGN LOAD ESTIMATION
Ian Jordaan,1 Robert Frederking2 and Chuanke Li1 1
C-CORE and Memorial University of Newfoundland, St. John’s, Canada 2
Canadian Hydraulics Centre, National Research Council Canada, Ottawa, Canada
ABSTRACT
Compressive ice failure is an important aspect in the design of offshore structures in ice environments. The authors concentrate attention on the crushing failure mode. The scale effect is a phenomenon whereby the average pressure decreases with contact area. In classical elasticity, viscoelasticity and plasticity, there is no scale effect. In the case of ice compressive failure, there is ample evidence of a scale effect. Two factors are dominant in this situation. Ice is prone to fracture, thus reducing the volume of material to be crushed, and aiding in the formation of high pressure zones. The second factor in the scale effect is the averaging process that results from the transition from local pressures on small areas (dominated by high pressure zones) to global pressures, where this effect is averaged. The analysis of probabilistic averaging is described with the example of pressures measured on the Molikpaq structure. The implications for design are significant.
KEY WORDS: Ice crushing; Pressure-area relationships Fracture; Scale effect; Probabilistic averaging
INTRODUCTION: COMPRESSIVE FAILURE
For the design of offshore structures, global loads are an important factor to be considered in ensuring the overall integrity of the structure. The structures include ships, FPSO’s, and gravity based structures. The scale effect whereby average global pressures are much smaller than those measured on small areas is an aspect in the determination of global loads. There are significant probabilistic issues in the relationship between small and large areas that are related to the scale effect. In compressive failure of ice, crushing is the dominant mechanism except at very small rates of loading. The simple word “crushing” hides rather complex mechanisms which result in localization of pressure into high pressure zones, (hpz’s) within which crushed particles of ice are created and from which they are ejected.
Figure 1 Schematic illustration of ice sheet interacting with rigid structure
Figure 1 shows schematically the main characteristics of the hpz’s, occurring at higher loading rates for the case of ice sheets. Their behaviour has been described in several articles (Frederking et al., 1990; Jordaan, 2001) based on both experimental and analytical approaches. The salient features are the high variation of pressure from small values near edge of the zones, of the order of a few MPa's to very high values near the centre, of the order of tens of MPa’s, and as high as 70 to 100 MPa. These high pressures are inevitably accompanied by high shearing stresses, where the rates of change of pressure are high. The hpz’s are always associated with a layer of microstructurally modified material. Fractures play an important part in the process, contributing areas of low or zero stress. The areas of high pressure change location as an interaction advances. Full scale data are most important in understanding and in determining design loads. In a recent report (Jordaan et al., 2006), data from the Molikpaq structure were analyzed, in particular those from the Medof panels. Since these panels cover an area less than 10% of the area of a face during interaction with ice, the local effects can dominate the measurements of loads, and extrapolation to the entire face must be done with care. In the past, conservative approaches have been taken. Here, a preliminary analysis of these results has been conducted, based on a modification of the method of Timco and Johnston (2003). First, the data shows that Medof panel forces are correlated on adjacent panels but not on detached panels. A Markov approach has been taken, resulting in a first-order autoregressive model in space. A companion paper (Li et al., 2006) describes simulations using this approach.
MECHANICS AND SCALE EFFECT
Ice is a viscoelastic material (Sinha, 1979; Jordaan, 2001), with a strong time-dependence of stress-strain behaviour. Even at low loading rates, ice undergoes microstructural change under compressive states, and is prone to fracture. As a result of the existence of the hpz’s, a tremendous variation in pressure takes place. In the initial contact in a field situation involving a real interaction, failure will be initiated in localized areas where contact is made. As the interaction continues, the global interaction area, defined as the projection of the structure onto the original shape of the ice feature, increases. This area includes spalled areas (Figure 1, which corresponds to higher loading rates) where pieces of ice have fractured off; the remaining area includes high-
and low-pressure zones as shown. If the nominal interaction area is AT, and if the area free of
pressure is A, then the effective stress on the remaining area is
(
)
/ (1 ),/ A A P A D
P T T
e = − = −
σ (1)
where P is load, and D = A/AT is a measure of the damage caused by fracture. The decrease of
average pressure with global interaction area constitutes a scale effect. In the “classical” analysis of indentation using rigid indentors against elastic or plastic materials, the failure pressure will not depend on area. For example, the von Mises plane strain solution for the applied pressure p at failure is 97 . 2 = y p σ (2) where y is the yield stress. There is no dependence of p on area in this equation. Similar results
can be found for elastic and viscoelastic materials.
Yet there is ample evidence of a scale effect, whereby the average pressure decreases with the global interaction area. There are two main reasons for this. The fracturing of ice leads to a reduction in the amount of solid ice remaining to be crushed. The second reason for the scale effect is the probabilistic averaging that results when one considers the large variation of pressure on small areas when compared to large ones.
PROBABILISTIC AVERAGING
During the interaction of ice with an offshore structure, the occurrence of spalls and fractures will result in areas of high pressure, which tend to form away from the free edges of an ice sheet or feature; otherwise they are randomly positioned and change location as an interaction advances in time. The local pressures on these areas are averaged to give the pressures on larger areas. In Jordaan et al. (1993), an averaging process of hpz’s was considered; stochastic independence between these was assumed for illustrative purposes. The average pressure is
( ) (
,)
, 2 1 dx x p f x p p x P x l l∫
= (3)where x denotes position in space, pℓ is the local pressure, fP(pℓ,,x) the spatial probability
distribution of local pressure. Although time is an important factor, we concentrate here on spatial variation. Correlation in space and time is an important factor in analysis.
The pressures are modelled as stochastic processes in space. The assumption has been made that in space and time the stochastic process is stationary. The data has many fluctuations, due to fractures, splits, and variations in ice thickness and other dimensions (for example). If all of these aspects were measured, for instance if local variations in ice thickness were measured, one could develop a model to account for these effects. In the context of the present observations, it is idle to state that there is a non-stationary process, since there is no basis to develop physical reasoning to explain the non-stationarity, and it cannot properly be modelled. Rather the causes of the load fluctuations are considered as background random events within a stationary process, contributing to the variance. The process is treated as stationary for time intervals (events) based on judgement.
Two important applications of the concept of probabilistic averaging are the study of the relation between global and local pressures for design (Li et al., 2006), and the estimation of global loads from local measurements.
DEMONSTRATION OF METHOD WITH WORKING EXAMPLE
The methodology will be introduced using a practical application corresponding to the second of the applications just noted. Ice load measurements on the Molikpaq, Amauligak I-65 deployment included local pressures on the Medof panels. Background to the Molikpaq structure and deployment can be found in Frederking et al. (1999), Hewitt et al. (1994), Jefferies and Wright (1988), Rogers et al. (1998), Timco and Johnston (2003, 2004) and Timco et al. (2005). The Medof panels do not respond to high frequency loads; Frederking et al. (1999) report that they give an accurate representation of the load up to frequencies of about 0.5 Hz.
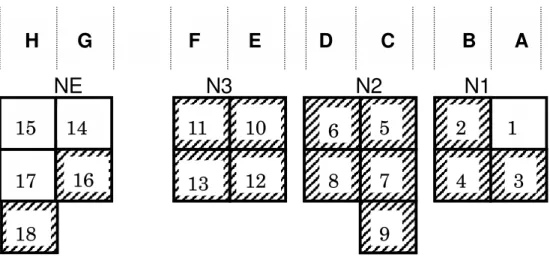
The event of March 8th, 1986 (fast file f603081731) is used as an example. The panels are 1.135 m wide and 2.715 m high, and cover about 10% of the loaded face of the structure. Figure 2 illustrates the array of these panels; the shaded ones show those that carried loads during the event. The numbering system used here for the panels and for the columns (see below) is also shown. In the event under consideration, there was relatively slow movement of the ice with crushing failure accompanied by sliding and some fracture.
Problem Definition
The question arises when attempting to extrapolate to obtain global loads from measurements on the Medof panels, as to the appropriate measure of standard deviation. To take a simple example, consider eight panels, with means and individual standard deviations all equal to µ and respectively. We know that if the pressures are stochastically independent, then the average pressure over eight panels will have a mean of µ with a standard deviation of /√(8) = /2.83. This shows that the standard deviation of an averaged load can be considerably less than the local standard deviation, and a much larger reduction can be expected for a wide face of the order of 90m. This example was based on the assumption of independence between panels, and it is important to consider correlation between adjacent panels.
Analysis; Correlation Coefficients
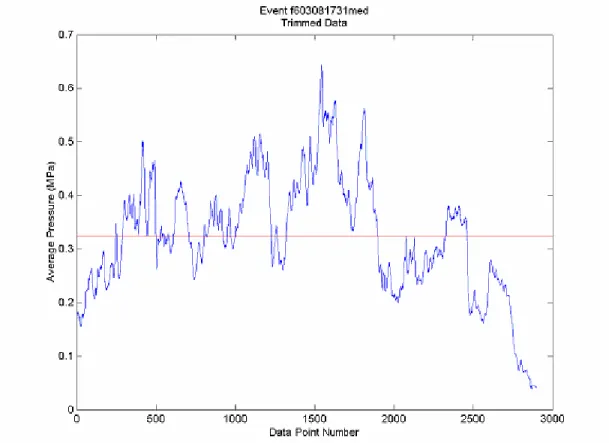
The analysis is based on the method of Timco and Johnston (2004). Figure 2 illustrates the array of loaded panels. There were eight “columns” (vertical sets) of panels showing load. The loads on each column were first determined by adding the loads together. The loads for all the columns were then added together and converted into an average pressure curve for the event. The area used to convert load to pressure is the width of a single panel multiplied by the number of columns loaded multiplied by the observed thickness of the ice during the event. The average of the observed minimum ice thickness and observed maximum ice thickness was used (3.85 m in the present case). The data were trimmed to omit periods of insignificant load. For the total load a vectorial adjustment of force was made by Timco and coworkers for the angle presented by the NE face. Here, we obtain an average pressure for all columns, without vectorial adjustment.
Figure 2 Medof panels in the working example, showing numbering of panels and columns; distance between sets of panels is in the range of 17-25 m. Shaded panels were loaded
Correlation coefficients (ρ) have been calculated for adjacent and distant panels, and for adjacent columns. First it should be noted that the mean ice thickness of 3.85m implies that only the central panels (in the vertical sense) are likely to be fully loaded. Correlation will be affected by fractures in the ice; it is common in ice sheets to have areas near the top and bottom surfaces which have little or no loads as a result of fracturing. A positive correlation would not be expected under these circumstances. This is reflected in the results. The correlation coefficient between adjacent panels is high for the horizontal pairs 3-4, 7-8, and 12-13 (Figure 2), with values of 0.58, 0.74, and 0.79 respectively, and is negligible for distant pairs. It is noted that panels 14, 15, and 17 were not functioning during this event; panels 16 and 18 were taken as representative in the present analysis. The correlation coefficients for the column pairs A-B, C-D, and E-F, were 0.57, 0.34, and 0.78 respectively. An average of 0.56 follows from these.
Variance Reduction Factors
The approach taken is the autoregressive analysis (Vanmarcke, 1983). In a process in time, an event in a Markov process depends on the previous one and not those earlier in the process (“knowledge of the present makes the future independent of the past”). The correlation is directional because time moves forward. In a process in space there is no preference of directionality. We therefore use the second-order difference equation:
[
( 1) ( 1)]
( ) )(t a X t X t U t
X = − + + + , (4)
where X(t) is the random series and the a is a constant and U(t) is an uncorrelated random series (white noise). This autoregressive model has an exponential correlation function
, 1 ) ( e / c c τ τ τ ρ − ⎥ ⎦ ⎤ ⎢ ⎣ ⎡ + = (5) where c is a constant which can be calculated based on the correlation coefficient and is the
H G F E D C B A
NE N3 N2 N1
4
3
1
2
5
6
8
10
12
13
11
14
15
17
18
7
9
16
Figure 3 Average column pressures for eight loaded columns; trimmed data. Mean pressure is 0.33 MPa and the standard deviation is 0.114 MPa
lag distance (noting that space rather than time is the key variable) which is the distance between two points, for instance adjacent panels (at a spacing of 1.13 m). Two values of ρ have been used in the present analysis, 0.6 and 0.8. The value of c in Equation (5) is about 0.82 and 1.37m for these two values respectively. A variance reduction factor γ is then developed in the theory, such that the reduced variance, taking into account the correlations is
2 2 ) ( σ γ σT = T (6)
where 2 is the column variance and T2 the variance averaged over the distance T, taken over the
distance centre-to-centre of the panels being averaged. The function γ is given by
. ) 1 ( 3 2 2 ) ( / ⎟⎟ ⎠ ⎞ ⎜⎜ ⎝ ⎛ − − + = − −c T c T e T c e T c T
γ
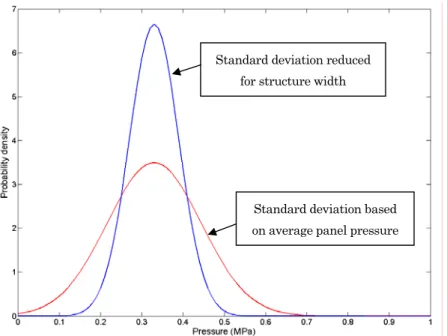
(7) We wish first to determine the standard deviation for an individual column from the average for all columns, found to be 0.114 MPa (Figure 3). The value of √(γ) in Equation (7) is 0.95 and 0.98 for two adjacent columns of panels, given correlation coefficients of 0.6 and 0.8 respectively. This gives reduction factors of 0.48 and 0.49 for the two cases, assuming independence between the four groups. This results in column standard deviations of 0.239 and 0.233 MPa respectively. Weshall use the average of 0.236 MPa in the following.
We now estimate the standard deviation for a structure 90m wide. The values of √(γ) are 0.19 and 0.25 for the correlation coefficients respectively. The standard deviation for the structure is then 0.045 and 0.059 MPa respectively. (Assuming independence between columns results in the value of 0.025 MPa.) There is a large difference between the standard deviations for the panels taken together and for the entire structure, as shown in Figure 4. Normal distributions are used, as would be expected as a result of the averaging process (central limit theorem).
Figure 4 Comparison of the two results for working example; variance based on ρ = 0.6
CONCLUSIONS
The analysis suggests that estimates of global loads from small instrumented areas, such as the Medof panels and also those based on strain gauges, should be evaluated using variance reduction to account for the probabilistic averaging that takes place. The method leads to realistic standard deviations and load estimates. The work of Hewitt and others (1994) contains significant issues that need to be addressed. There is a need for an exhaustive and integrated analysis of all Molikpaq data.
Assumptions made in the analysis can be improved; for example, stationarity, both temporally and spatially, needs to be studied. The use of simulations, such as in the work in Li et al. (2006), provides potentially useful insights.
ACKNOWLEDGEMENTS
Financial support provided by the Natural Sciences and Engineering Research Council of Canada (NSERC), and the Program on Energy Research and Development (PERD), Government of Canada, is gratefully acknowledged. The assistance of Arash Nobahar, Thomas Mackey and Jonathon Bruce is much appreciated.
Standard deviation reduced for structure width
Standard deviation based on average panel pressure
REFERENCES
Frederking, R.M.W., Jordaan, I.J. and McCallum, J.S (1990), “Field tests of ice indentation at medium scale: Hobson's Choice Ice Island”, Proceedings, 10th International Symposium on Ice, IAHR, Espoo, Finland, Vol. 2, pp. 931-944.
Frederking, R., Timco, G., and Wright, B. (1999), “Ice pressure distributions from first-year ice features interacting with the Molikpaq,” Proceedings of the Ninth Int. Offshore and Polar Engineering Conference, Brest France, May 30 - June 4, 1999, Volume II, pp 541-548.
Hewitt, K. J. (1994), “Molikpaq ice interactions: predicted and actual performance,” IAHR Ice Symposium. Canadian Marine Drilling Ltd.
Hewitt; K.J., Kennedy, K.P., and Fitzpatrick P.J. (1994) “Global ice loads on arctic structures interpreted from foundation displacements,” 7th Int. Cold Regions Engineering Specialty Conference.
Jefferies M.G. and Wright, W.H. (1988), “Dynamic response of “Molikpaq” to ice-structure interaction”, 7th International Conference, OMAE, Houston, Texas, Vol. IV, pp. 201-219. Jordaan, I. J. (2001), “Mechanics of ice-structure interaction”, Engineering Fracture Mechanics,
vol. 68, pp. 1923-1960.
Jordaan, I.J. (2005) Decisions under Uncertainty: Probabilistic Analysis for Engineering
Decisions, Cambridge University Press, 672 pp.
Jordaan, I.J., Xiao, J. and Zou, B. (1993), “Fracture and damage of ice: towards practical implementation,” First Joint ASCE-EMD, ASME-AMD, SES Meeting, Virginia, June, 1993. Published by ASME, AMD-Vol. 163, pp. 251-260.
Jordaan, I.J., Li, C., Mackey, T. and Nobahar, A. 2006 “Design Ice Pressure-Area Relationships;
Molikpaq Data”, Report prepared for Canadian Hydraulics Centre, National Research Council
of Canada, Version 2.0
Li, C., Frederking, R. and Jordaan, I.J. (2006), “Simulation of probabilistic averaging in ice load estimation,” Proceedings of 18th International Symposium on Ice, IAHR, Sapporo, Japan. Rogers. B, Hardy, M.D., Jefferies, M.G, Wright, B.D. (1998), “DynaMAC: Molikpaq Ice
Loading Experience,” Klohn-Crippen, PERD/CHC Report 14-62.
Sinha, N.K. (1979), “Grain boundary sliding in polycrystaline materials,” Philosophical Magazine A, Vol. 40, No, 6, pp.825-842
Timco, G. and Johnston, M. (2003), “Ice loads on the Molikpaq in the Canadian Beaufort Sea,” Cold Regions Science and Technology, Vol. 37, pp. 51- 68.
Timco, G. and Johnston, M. (2004), “Ice loads on the caisson structures in the Canadian Beaufort Sea,” Cold Regions Science and Technology, Vol 38, pp.185- 209.
Timco, G. and Johnston, M., Wright, B.D. (2005), “Multi-year ice loads on the Molikpaq: May 12, 1986 event,” Proceedings 18th International Conference on Port and Ocean Engineering under Arctic Conditions, POAC'05. Vol. 1, pp 453-462, Potsdam, NY, USA.