Publisher’s version / Version de l'éditeur:
Vous avez des questions? Nous pouvons vous aider. Pour communiquer directement avec un auteur, consultez la
première page de la revue dans laquelle son article a été publié afin de trouver ses coordonnées. Si vous n’arrivez pas à les repérer, communiquez avec nous à PublicationsArchive-ArchivesPublications@nrc-cnrc.gc.ca.
Questions? Contact the NRC Publications Archive team at
PublicationsArchive-ArchivesPublications@nrc-cnrc.gc.ca. If you wish to email the authors directly, please see the first page of the publication for their contact information.
https://publications-cnrc.canada.ca/fra/droits
L’accès à ce site Web et l’utilisation de son contenu sont assujettis aux conditions présentées dans le site LISEZ CES CONDITIONS ATTENTIVEMENT AVANT D’UTILISER CE SITE WEB.
Physical Review A, 76, 1, pp. 1-16, 2007-07-16
READ THESE TERMS AND CONDITIONS CAREFULLY BEFORE USING THIS WEBSITE.
https://nrc-publications.canada.ca/eng/copyright
NRC Publications Archive Record / Notice des Archives des publications du CNRC :
https://nrc-publications.canada.ca/eng/view/object/?id=fe4d05be-f0cc-4c45-b25c-414a91fc3b90
https://publications-cnrc.canada.ca/fra/voir/objet/?id=fe4d05be-f0cc-4c45-b25c-414a91fc3b90
Archives des publications du CNRC
This publication could be one of several versions: author’s original, accepted manuscript or the publisher’s version. / La version de cette publication peut être l’une des suivantes : la version prépublication de l’auteur, la version acceptée du manuscrit ou la version de l’éditeur.
For the publisher’s version, please access the DOI link below./ Pour consulter la version de l’éditeur, utilisez le lien DOI ci-dessous.
https://doi.org/10.1103/PhysRevA.76.013405
Access and use of this website and the material on it are subject to the Terms and Conditions set forth at
Dynamic nuclear interference structures in the Coulomb explosion
spectra of a hydrogen molecule in intense laser fields: reexamination
of molecular enhanced ionization
Chelkowski, Szczepan; Bandrauk, André D.; Staudte, André; Corkum, Paul
B.
Dynamic nuclear interference structures in the Coulomb explosion spectra of a hydrogen
molecule in intense laser fields: Reexamination of molecular enhanced ionization
Szczepan Chelkowski,1,*André D. Bandrauk,1André Staudte,2and Paul B. Corkum2
1Laboratoire de Chimie Théorique, Faculté des Sciences, Université de Sherbrooke, Sherbrooke, Québec, Canada J1K 2R1 2
National Research Council, 100 Sussex Drive, Ottawa, Ontario, Canada K1A 0R6 共Received 2 June 2007; published 16 July 2007兲
Several theoretical models are used to explain the origin of the recently observed共unexpected兲 spectral progression in the Coulomb explosion spectra of the hydrogen molecule photoionized by an intense ultrashort laser pulse. In the first ionization step the molecule loses its first electron and then the H2+ molecular ion dissociates. Next, at the intermediate stage of the dissociation process, a localized electron state is created from which the second ionization occurs at each laser half-cycle. It is shown that interference between a net-two-photon and a one-net-two-photon transition introduces a dynamic structure into the nuclear wave packet corresponding to this localized electron state which leads to the regular spectral progressions seen in the experiment. We confirm these spectral progressions using numerical simulations based on a time-dependent Schrödinger equa-tion describing the exact three-body dynamics of H2+in one dimension.
DOI:10.1103/PhysRevA.76.013405 PACS number共s兲: 33.80.Rv, 33.80.Gj, 42.50.Hz
I. INTRODUCTION
Interaction of intense 共I ⬎ 1013 W / cm2兲 laser fields with matter leads to many new multiphoton, nonperturbative phe-nomena such as high harmonic generation, generation of at-tosecond pulses and above threshold ionization 共ATI兲 关1,2兴. These important phenomena were first observed and inter-preted in atomic gases. Molecules exposed to intense laser fields add a new perspective into the study of intense laser-matter interactions related to the entanglement of the elec-tron and nuclear motion, often called dissociative ionization, which cannot be easily separated as it has been in the past for stationary perturbative phenomena with the help of the Born-Oppenheimer approximation 关3兴. Thus the additional mo-lecular parameters such as internuclear distance lead to vari-ous phenomena specific to molecules like Above Threshold Dissociation关3,4兴 ATD. Most important inherently molecular aspects of intense laser-matter interaction show up in kinetic energy spectra of nuclear fragments originating from Cou-lomb explosion of photoionized molecules. If a molecule ex-posed to an intense laser field loses several electrons within the time interval so short that nuclei can be considered as frozen then共if sufficient number of electrons was lost within this short time interval兲 by measuring kinetic energies of charged nuclear fragments we can use a simple mapping pro-cedure to reconstruct the vibrational共bound or dissociating兲 nuclear wave function from Coulomb explosion spectra. Such a procedure, called Coulomb Explosion Imaging共CEI兲, has been extensively studied both theoretically关5,6兴 and ex-perimentally 关1,7,8兴. CEI seems to be of interest from the fundamental perspectives as one the most direct measure-ment of the absolute value of the nuclear wave function, i.e., the measured momenta of exploding charged fragments are directly related in a simple way to the probability distribution of nuclear positions just before the classical Coulomb explo-sion has been triggered by the rapid removal of few elec-trons.
Another typically molecular aspect of intense laser inter-action with matter is related to the phenomenon called En-hanced Ionization共EI兲 or Charge-Resonance Enhanced Ion-ization 共CREI兲. This process was thoroughly studied theoretically in symmetric molecules共like H2
+ , D2
+兲 关
11–17兴 and recently in nonsymmetric molecules as well关18兴. So far very few experiments were performed directly on H2
+ ions. Most experiments were performed using neutral H2 mol-ecules and H2
+
ions were produced during the rise of the laser femtosecond laser pulse共40– 140 fs兲. These pulses are usually focused to peak intensities of ⬃1013– 1015 W / cm2 into the gas jet of unaligned H2 or D2 neutral molecules. Typically, the electrons are not ejected instantaneously at the equilibrium configuration as one would require in an ideal CEI procedure. The double ionization process of a hydrogen molecule usually occurs in three steps shown in Fig.1. Dur-ing the first step, takDur-ing place durDur-ing the rise of the laser pulse, the first electron is ejected nearly instantaneously via tunnelling. This process prepares a nuclear wave packet nearly identical to the initial vibrational state of H2 via a vertical Franck-Condon transition onto the H2
+
ground g
state关9,10兴. Next, the second part of the laser field envelope launches the dissociation of H2
+
driven by the strong cou-pling between thegand the lowestuelectronic surface of
the molecular ion. Finally, the last electron is ejected at much larger internuclear distances than the equilibrium internu-clear separation, as illustrated in Fig. 1 which shows these two steps for a H2
+
molecule in intense laser fields. Surpris-ingly, it was discovered theoretically that for a dissociating H2
+
ion there exists a critical distance Rc at which the
mo-lecular ionization rate exceeds the atomic rate by several order of magnitudes. The EI occurs when the electron wave function is well localized on one nuclei 关11–17兴. In an aligned H2
+
along the laser field there are two such localized states which in the absence of the field are nearly degenerate at R ⬎ 6 a.u.. The enhanced ionization occurs from the higher, +, up-hill, quasi-static electronic energy state 关13,16兴 from which the force from the laser electric field and the force from neighboring nuclei add up leading to a much *s.chelkowski@usherbrooke.ca
lower barrier to overcome or even to overbarrier ionization; see Fig. 1共b兲兲. The ionization rate from the second lower state is much lower since the electron has a high and wide barrier to overcome. The Coulomb explosion spectrum will thus depend strongly on the R-dependence of the populations in this upper localized electron state. So far in the literature related to molecular EI it has been assumed that this popu-lation is smooth and constant or that the spectra are propor-tional to the total populations. In most previous investiga-tions it was assumed that the Coulomb explosion spectra are directly proportional to the frequency dependent static ion-ization rate 关17,19,20兴 calculated by solving a time-dependent Schrödinger equation 共TDSE兲 for frozen nuclei and it was usually assumed that any dynamical R-dependent factor is irrelevant despite the fact that such a light molecule as H2
+
dissociates with the speed of 1 a.u. per laser cycle. Clearly, after few laser cycles the nuclear wave packet un-dergoes a large change which means that predictions based on wavelength dependent ionization rates computed from TDSE for frozen nuclei are unreliable. More realistic is a new dynamic model we propose here based on the cumula-tive effect of instantaneous Coulomb explosions occurring at each laser half-cycle at maxima of the兩E共t兲兩 field weighed by a corresponding DC rate and the shape of the wave packet obtained from a two-surface calculation.
In this work, we present a detailed analysis of the role of this nuclear wave packet factor, in the case of Coulomb ex-plosion of H2
+ and D2
+
, which is crucial for understanding of the experimental data reported earlier in 关21兴. Because of numerical limitations our theoretical work is limited to the dynamics of H2+共or D2
+
兲 in an intense laser field. However, the experiment is performed by focusing the laser pulse on
the neutral molecules. Therefore, an exact modelling would require to solve the H2 two-electron共⫹ two-protons兲 prob-lem. The measured Coulomb kinetic energy spectra of pro-tons共or deuterons兲 show a regular progression in the sub-eV range. Our experimental technique 关21兴 allowed to reveal these regular structures in the kinetic energy release共KER兲 of the Coulomb explosion spectra, for the first time. We sug-gested in关21兴 that this structure is related to population dy-namics, as it occurs, when the dissociating wave packet evolves and traverses the EI region. The electron is ejected only at maxima and minima of the electric field via tunnel-ling or overbarrier ionization mechanisms. Thus the mea-sured Coulomb explosion KER spectrum is a cumulative re-sult of successive instantaneous Coulomb explosion imaging processes of the evolving wave packet. We show, by solving numerically the two-surface dynamics of the dissociating ion, that this wave packet has a very regular structure result-ing from the interference between two possible dissociation pathways. The principal goal of this work is to establish theoretically, in more details than in the previous short letter 关21兴, a link between the modulations in the experimental spectra and the spatial structure in the dissociating nuclear wave packet. Another goal is to explain the origin of this spatial structure. We show that this structure, dependent on the internuclear separation R, is directly determined, in a simple way, by the nuclear momenta of dissociating wave packets on the gerade共g兲 and ungerade 共u兲 H2
+
surfaces which in turn are related to the number of net-absorbed pho-tons in the dissociation channel. In other words, our work completes previous theoretical investigations of EI in which this dynamic factor related to the wave packet shape has never been fully investigated. Other previous work on H2
+ has also emphasized the importance of this quasi-static upper surface, called a doorway state关3,13,22兴. Our work relates also to earlier experimental work关23,24兴 in which observed structures in KER Coulomb explosion spectra were attrib-uted to the light-induced trapped state.
The paper is organized as follows: In Sec. II we briefly describe the experiment and the results; in Sec. III we com-pare the experimental Coulomb spectra for H2
+
and for D2 + with theoretical spectra obtained from a numerical solution of TDSE describing the exact non-Born-Oppenheimer three-body dynamics in one dimension共electron and nuclei mov-ing along one axis兲; in Sec. IV we investigate the interfer-ence structure in molecular wave packets obtained from the two-surface 共g andu兲 dynamics; and in Sec. V we
con-struct a simple Coulomb explosion model based on two-surface dynamics and DC-ionization rates. In this model the kinetic energy spectra are calculated as a sum of instanta-neous Coulomb explosion at each laser half-cycle weighed by the DC-ionization rates corresponding to the electric-field value at each consecutive half-cycle, as shown in Fig. 1 共lower panel兲.
II. EXPERIMENTAL RESULTS
Femtosecond laser pulses共40– 140 fs兲 of different wave-lengths共800 nm, 1.2m, and 1.4m兲 were focused to peak intensities of共1.0– 4.5兲 ⫻ 1014W / cm2into the gas jet of un-FIG. 1. 共Color online兲 Sketch of the processes occurring in a
H2+intense laser field. The multiphoton or tunneling ionization of the first electron transfers populations from the ground state surface of a H2+molecule to the the gsurface of H2
+共or D 2
+兲 and creates
a wave packet that rapidly moves toward the outer turning point. The two dissociation pathways, net-two-photon共absorption of three photons and reemission of one photon兲 and one-photon, interfere on the quasistatic upper state. Enhanced ionization samples the popu-lation on this surface at the field maximum of each half laser cycle. Right panel shows the electronic potential as function of the elec-tron coordinate zel at the internuclear distance R = 6 a.u. and the
corresponding quasistatic levels ±. The second electron ionizes
aligned H2and D2. The peak intensity was determined using the radial electron and ion momentum of single ionization in circularly polarized light 关25兴. The uncertainty in the peak intensity is ⬇10% at 800 nm and 30% at 1.2m and 1.4m. We determined the pulse duration using an SHG autocorrelator for all wavelengths with an uncertainty of ±10%.
Ions and electrons created in the focus are guided by elec-tric and magnetic fields共23 V / cm, 12 G兲 towards two chan-nel plate detectors with delay line position encoding. Ion momenta of up to 30 a.u. are collected with 4 solid angle. The electrons and ions were measured in coincidence which allowed to achieve an overall spectrometer momentum reso-lution of ±0.1 a.u. along and ±0.5 a.u. perpendicular to the spectrometer axis. Further details on the experimental setup can be found in关21,26兴.
The experimental KER spectra of protons or deuterons exhibit a sequence of spectroscopic lines which are formed during enhanced ionization共EI兲 of H2共or D2兲 关11–13,17,18兴. The lines appear for both linear and circular polarizations and at all wavelengths 共800 nm– 1.4m兲 and pulse dura-tions共40– 140 fs兲 that we have studied, see 关21兴. The peak positions are nearly intensity independent in the intensity range I = 1014to 3 ⫻ 1014 W / cm2. Whereas increasing inten-sity blurs the feature, it does not affect the line position. Although the overall structure of the spectral part associated with enhanced ionization curves change, there is always a spectral progression up to the intensity I = 3 ⫻ 1014W / cm2. The peak positions共and the spacings between lines兲 depend on the wavelength and the isotope. The experiment shows that the lines positions shift to lower energies with increasing wavelength but the peak separations are rather slightly larger for longer wavelength 共if compared in the similar energy range兲. The opposite should happen if the spacing were pro-portional to the photon energy. It also shows that the spacing between lines are smaller for a heavier isotope. The peak positions are, however, insensitive to a change of pulse du-ration 共within a 40– 140 fs range兲 but the line intensity is shifted from the high energy lines to the lower energetic lines when the pulse duration is increased.
In the next sections we reproduce these structures using the 1-D TDSE for H2
+ and D2
+
. We also construct a simple model of the instantaneous Coulomb explosion occurring at subsequent laser half-cycles. The model describes the disso-ciation using the two-surface model. It allows us to establish the origins of the modulation appearing in the laser-molecule dynamics, more specifically, this model shows a link be-tween the spatial structure of the wave packet and the ob-served experimental spectral lines.
III. EXACT THREE-BODY TDSE SIMULATIONS
The most rigorous and adequate, ab-initio theoretical ap-proach to this experiment would require to solve the TDSE for a H2 molecule, i.e. one should solve the time evolution problem involving the wave function depending on 9 spatial coordinates for two electrons and two nuclei, 4 ⫻ 3 − 3 共where 3 coordinates of the center of mass are subtracted兲, which is not feasible since the electron spatial grid should be
sufficiently large in order to track the fast electron wave packets. Even if we restrict the nuclear motion to 1D共which may be a reasonable approximation for a non-rotating H2 perfectly aligned with a linearly polarized laser electric field兲 we cannot numerically solve this 2-electron problem in its full dimensionality 共i.e., 6 coordinates for the electrons+ 1-coordinate for the nuclear motion兲. Conse-quently, one is compelled to restrict the dynamics to the one-electron problem and one nuclear degree of freedom and one has to make an ad-hoc assumption about the initial state. One assumes usually that the first electron is instantaneously re-moved at a specific maximum or minimum of the laser elec-tric field. Additionally, one assumes that a H2
+
molecule is instantaneously created via a vertical Franck-Condon transi-tion onto the H2
+
gstate and at this moment our code starts
to describe the dissociative ionization of H2 +
or D2 +
. The validity of these assumptions and the corrections to this Franck-Condon transition model were discussed in关9,10,24兴. After a turn-off of the laser pulse we project the final wave function on Coulomb nuclear continua and thus obtain the kinetic energy spectra of exploding nuclear fragments. We have already solved numerically in the past关27,28兴 the TDSE for a H2
+
molecule aligned along the linearly polar-ized共along z-axis兲 laser electric field. Because of the sym-metry this involves only two electron degrees of freedom 共e.g the cylindrical coordinates and z electron coordinate with respect to the center of mass of two nuclei兲 and inter-nuclear separation R. So far, even for this reduced problem there are no reported converged calculations of Coulomb ex-plosion spectra. The difficulty consists in the necessity to use extremely huge electron grids. To allow the use of smaller electron grids, in most calculations absorbing boundaries are introduced but unfortunately this leads to the loss of the elec-tron flux after few elecelec-tron cycles and consequently the Cou-lomb explosion spectra are affected by the use of an ab-sorber. In关29兴 we have overcome in part this difficulty by using a wave function splitting technique which so far has been successfully used only for electron-proton motion in 1-D. It allows to recover the absorbed wave function which is next propagated in time using the exact Volkov propagator 关29兴. Results presented here are based on this technique.
We have solved numerically the complete, 3-body, 1-D, TDSE with both electronic and nuclear degrees of freedom included共in atomic units, ប = me= e = 1兲
i
共z,R,t兲
t =关HR共R兲 + VC共z,R兲 + Hz共z兲兴共z,R,t兲, 共1兲
where z is the electron coordinate共with respect to the nuclear center of mass兲, R is internuclear distance, with correspond-ing electronic Hz共z兲, nuclear HR共R兲 Hamiltonians,
Hz共z兲 = − 2 z2+zE共t兲, H共R兲 = − 1 mN 2 R2+ 1 R, 共2兲 where
=共2mN+ me兲 4mNme
, = 1 + me 2mN+ me
,
and the regularized Coulomb potential VC originating from
the two nuclei,
VC共z,R兲 = − 1
冑
共z − R/2兲2 + 1+ − 1冑
共z + R/2兲2 + 1. 共3兲meand mNare the electron and nucleus共proton or deuteron兲
masses. The Hamiltonian used in Eq. 共1兲 is the exact three body Hamiltonian obtained after separation of the center-of-mass motion关29兴 in 1D. We solve the TDSE 共1兲 numerically, using the method described in关29兴. The initial wave func-tion, at t = 0 was assumed to be in the following form:
共z,R,0兲 =共R兲g0共R,z兲, 共4兲 whereg0共R , z兲 is the field-free eigenfunction of the molecu-lar electronic Hamiltonian of H2
+
at fixed R. We used共except
in the case of Fig. 6兲共R兲 equal to the vibrational ground state共v = 0兲 of H2or D2, shown in Fig.1. This is equivalent to assuming that, during the ionization of H2, the nuclei re-mained frozen and a direct vertical Franck-Condon-like tran-sition from H2 to H2
+
takes place.
Since the most likely moment for the ionization of the first electron in H2 is within few cycles around the peak of the pulse envelope, we use in our simulations an artificial laser pulse envelope关24兴 which rises from zero to its maxi-mal value within the time trise= 2 laser cycles and then falls as a Gaussian corresponding to the experimental pulse char-acterized by the FWHM duration p. Although within the
tunnelling picture H2 +
appears abruptly at the peak of the laser electric field we are using a 2-cycle rise time in order to avoid the artifacts in our code which would have been in-duced by an abrupt turn-on of the pulse. More specifically, we use the linearly polarized共along z-axis兲 laser electric field in the following form
E共t兲 =
再
E0sin 2关t/共2trise兲兴cos共t兲 for 0 ⬍ t ⬍ trise, E0exp关− 2 ln共2兲共t − trise兲2/p
2
兴cos共t兲 for t ⬎ trise.
冎
共5兲
The TDSE, Eq. 共1兲, has been solved using the wave function-splitting technique which allows to use the absorber for the electron in the internal zone defined by兩z兩 ⬍ zinwith the absorbing zone of size z0, see Fig. 1 in关29兴. The absorber was applied at each ␦t= 10dt 共dt = 0.03, zin= 1024, z0= 150, all in a.u.兲 time interval. The Fourier transform in the z elec-tron coordinate from the recovered part关given by Eq. 共7兲 in 关29兴兴 was computed and added to that computed in the pre-vious step. The propagation in the external zone is much faster than in the internal zone due to the Volkov propagator 关see Eq. 共14兲 in 关29兴兴. Thus at the final simulation time tf
共tfⰇp兲 the wave function corresponding to the external
zone共pel, R , tf兲 is found, where pelis the electron momen-tum. In关29兴 共pel, R , tf兲 has been projected on the nuclear
plane waves exp共ipNR兲 and the nuclear kinetic energy release
共KER兲 spectra were calculated with the help of these projec-tions. We found in关5,6兴 that since the nuclei at the final time
tfare only 20– 40 a.u. apart it is necessary to project the final
wave function on exact Coulomb wave functions instead of plane waves. Therefore, we project the final wave function 共pel, R , tf兲 共obtained from the recovered flux of the
absorb-ing zone兲 on the Coulomb wave functions 关6,30兴: C共EN,R兲 =
冋
2 k册
1/2 F0共,kR兲 where= q2 k , 共6兲whereis the reduced mass of two exploding nuclei, q is a charge of each nuclei共q = e = 1兲, k =
冑
2ENis the asymptoticmomentum and F0 is expressed by the following integral 共see Eq. 14.3.3 in Ref. 关30兴兲,
F0共,kR兲 =␣kR
冕
0 ⬁dt关1 − tanh2共t兲兴cos关kR tanh共t兲 − 2t兴, 共7兲 where ␣=
冋
e 2 − 1 2e2册
1/2 ⬇ 共2兲−1/2 =冋
k q2册
1/2 . 共8兲The approximation made in the above equation is valid for ⬎ 3, i.e. in the case of exploding protons for EN⬍ 30 eV,
which is always satisfied in our considerations. Our choice of normalization in 共6兲 ensures that for large R the outgoing plane wave coefficient is
冑
/共k兲 关i.e., the plane wave ex-p共ikR兲 is normalized to the␦共E − E⬘
兲 function兴. The nuclear KER spectrum is thus given byS共EN兲 =
冕
−⬁ ⬁ dpel兩C共EN, pel兲兩2, C共EN, pel兲 =冕
0 ⬁ dRC*共EN,R兲in共pel,R兲. 共9兲 Figures 2–6 show KER spectra for the wavelength = 800 nm obtained using the TDSE共1兲. In Fig.2we compare the experimental results with theoretical results based on the 1D 共three-body兲 TDSE for H2+and D2+ molecules, respec-tively. The numbers close to the peaks indicate possible lo-cations Rexpl 共in a.u.兲 of Coulomb explosion if it had oc-curred with zero initial speed, Rexpl= e2/ EN. Both, theory and
ex-plosion locations Rexplare nearly same. This suggests that the origin of the spectral lines may be related to a spatial regular structure 共R-dependent兲. We note that the theoretical peak positions do not perfectly coincide with the experimental ones although the energy spacing between the peaks is accu-rately reproduced. Also, our 1D theory does not reproduce well the intensity of experimental lines. In particular, the high KER values are underestimated. Figure6 shows that it can be partially accounted for by assuming a lower than ex-perimental intensity. This discrepancy is probably due to the reduced dimensionality of our model calculation; note that the 1D dressed potentials exhibit the one photon crossing at
R= 5.2 a.u. and the 3-photon crossing point at R = 3.6 a.u., whereas the corresponding exact 3-D values are smaller: 4.8 and 3.3 a.u.. This leads to the most favorable explosion con-ditions for 3-D model at smaller internuclear distances than in the case of a 1-D model. Fig. 3共a兲 also shows that the structure is more pronounced at lower intensities, I = 8 ⫻ 1013W / cm2, and that the line progression entirely disap-pears in our calculations at I = 1.5⫻ 1014W / cm2, see Fig.
3共b兲, whereas the experiment, shows a clear structure at I = 1.4⫻ 1014W / cm2.
Since we have chosen an artificial pulse envelope with the two-cycle rise-time, see Eq.共5兲, we check in Fig.4the effect of the shape of the pulse envelope on the KER nuclear spec-trum. Increasing the rise-time is related to assuming that the H2
+
ion was born earlier. Clearly, the peak position depend slightly on this rise-time, however, the spacing between peaks in the KER spectra is the same for all rise-time be-tween 2 to 8 cycles.
Next, we check whether the peak structure in KER spectra depends on the initialization. In most previous investigations of the H2+dynamics the wave function was initialized from a specific vibrational state of H2
+
. We choose the v = 6 state of H2
+
since the threshold for the one photon Floquet channel opens for v⯝ 6 关31兴. Thus, from v = 6, both one and net-two-photon processes can directly occur共even at low intensities兲, whereas the initialization from lower vibrational states al-lows only for two or more photon process. We show in Fig. 5 the corresponding KER spectra for a H2+ molecule. Sur-prisingly, the line positions are identical for both, previous 共Franck-Condon兲 and the v = 6 state of H2
+
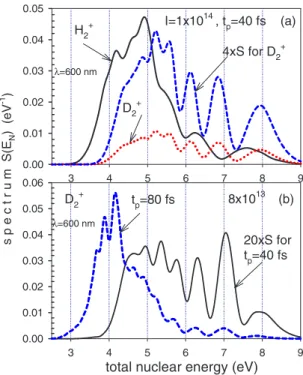
initializations suggesting that the structure in the KER spectra is related to FIG. 2. Kinetic energy release共KER兲 spectra for H2
+
in共a兲, 共b兲 and for D2+ in 共c兲, 共d兲, as function of total ion energy calculated using the time-dependent Schrödinger equation共TDSE兲, given in Eq. 共1兲, for the laser wavelength = 800 nm, pulse duration 共FWHM of the intensity profile兲 p= 40 fs 共solid line兲, compared with experimental spectra共line with symbols兲, at intensity 共a兲,共c兲 I= 1014W / cm2 and 共b兲,共d兲 I = 1.2⫻ 1014W / cm2. Numbers near
peak position indicate a possible location Rexplof Coulomb
explo-sion, in a.u., calculated via Rexpl= e2/ E
N. 3 4 5 6 7 8 0.0000 0.0005 0.0010 0.0015 0.0020 0.0025 theory 8x10¹³ 1x10¹⁴
(a)
nuclear energy (eV)
3 4 5 6 7 8 spect rum S( E) (e V -1 ) 0.00 0.02 0.04 0.06 0.08 0.10 0.12 0.14 0.16 theory, 1.5x10¹⁴ expt. expt. 1.4x10¹⁴
(b)
FIG. 3. 共Color online兲 Kinetic energy release 共KER兲 spectra for D2+for laser intensity共a兲 I = 8 ⫻ 1013and共b兲 I = 1.5⫻ 1014W / cm2.
D2+ 800 nm, I=8x10¹³W/cm2 d+d energy (eV) 3 4 5 6 7 8 spec tr u m (eV -1 ) 0.000 0.002 0.004 0.006 0.008 0.010 0.012 0.014 0.016 trise= 4 cycles trise= 2 cycles trise= 6 cycles trise= 8 cycles
FIG. 4. 共Color online兲 Kinetic energy release 共KER兲 spectra for D2+as function of total deuteron energy calculated using the TDSE given in Eq.共1兲 for several values of the pulse rise times.
the superposition of one and two photon processes, which we will show in the next two sections.
In Fig. 6 we changed the pulse duration from tp
= 40 fs to tp= 80 fs while keeping the peak intensity
con-stant. The line intensity is shifted from the high energy lines to the lower energetic lines when the pulse duration is in-creased. Again, the peak positions remain unaffected. We also show in the same figure the isotope effect at I = 8 ⫻ 1013
and for tp= 80 fs. We observe a clear isotope effect in
the separation between central peaks, for D2 +
the spacing is 0.537 eV whereas for H2
+
the spacing is 0.353. Thus the ratio of these spacings is 1.52 which is close to the square root of reduced mass ratio, suggesting that the nuclear mo-mentum is a parameter controlling these spacings. Clearly, the nuclear wave packet phase is responsible for this isotope effect which we will clarify in the next sections.
Figure7shows the nuclear KER spectra for wavelengths 1200 nm and 1400 nm. As in the case of 800 nm our simu-lations give correct spacing of the lines which are shifted by 0.4– 0.5 eV with respect to the experimental line, most
prob-ably due to the shift of the one and three photon crossings occurring in our 1-D model. Also the intensity of lines is different from the experimental line which may be also re-lated to our artificial preparation scheme of the molecular ion which experimentally is created by photo-ionization of a neutral molecule during the rise of the laser pulse. Compari-son of the KER spectra for shorter wavelength, = 600 nm 共Fig.8兲 with that for much longer wavelength, Fig.7, shows that overall shape of KER spectra is strongly wavelength dependent: for = 600 nm we see a strong peak at nuclear energy as high as EN= 8 eV which means that the Coulomb
explosion already occurs at R = 3.4 a.u., which is much less than the typical EI region: 6 ⬍ R ⬍ 11关11–17兴. As a general rule, we observe that the spacing between peaks in our KER spectra is much smaller for = 600 nm than for a longer wavelength. We also see a similar isotope effect for 600 nm, Fig.8, as in the 800 nm case. Note, that in our earlier work, see Figs. 7–9 in 关29兴, we already reported the structure in KER spectra for the wavelength = 600 nm. However, in our current work we achieved better resolution and precision due to a longer simulation time 共larger R-grids兲 and due to the fact that we project here the final wave function on exact Coulomb waves instead of projecting on plane waves.
Summarizing, our complete simulations based on the 1-D TDSE reproduce reasonably well the spectral progression seen in the experiment, in particular the spacings between the peaks and the total number of peaks are accurately repro-duced. Our simulations reproduce also the isotope depen-dence seen in the experiment, i.e. they show that the spacings between peaks are smaller for a heavier isotope, as well as, the dependence of peak position on the wavelength is also confirmed by theory. The dependence of the overall shape of the spectrum on the pulse duration is also similar to that seen
nuclear energy (eV)
3 4 5 6 7 sp ect ru m S(E ) (eV -1 ) 0.00 0.02 0.04 0.06 0.08 0.10 0.12 0.14 I=1x10¹⁴W / cm2, λ=800 nm H2+,v=6 initialization H2,v=0 initialization
FIG. 5.共Color online兲 Same calculations as in Fig.2共a兲but for the H2+ molecule initialized in its v = 6 vibrational state compared with the Franck-Condon initialization used in Fig.2.
I=8x10¹³W/cm2
nuclear energy (eV)
3 4 5 6 7 spect rum (e V -1 ) 0.00 0.02 0.04 0.06 D2+, tp=80 fs D2 + , tp=40 fs, 10xS H2+, tp=80 fs
FIG. 6.共Color online兲 Kinetic energy release 共KER兲 spectra for D2+ 共solid line兲 compared with those for H2+ 共dashed lines兲 at I
= 8 ⫻ 1013W / cm2and for pulse duration tp= 80 fs, calculated using the TDSE given in Eq.共1兲.
D2+, tp =140 fs 3 4 5 6 7 8 s p e c t r u m (eV -1 ) 0.00 0.05 0.10 0.15 0.20 0.25 0.30 1.0x10¹⁴ expt. 1.0x10¹⁴ theory d+d energy (eV) 3 4 5 6 7 8 0.00 0.01 0.02 0.03 0.04 1.2x10¹⁴ theory (a) λ=1200 nm (b) λ=1400 nm 8x10¹³ theory 6x10¹³ expt. D2+, tp =140 fs
FIG. 7. 共Color online兲 Kinetic energy release 共KER兲 spectra for D2+at wavelength = 1200 nm calculated using the TDSE given in Eq.共1兲.
in the experiment. Some discrepancies in peak position be-tween the experiment and theory are due to the reduced di-mensionality of our model and initialization of the nuclear wave packet with a Franck-Condon overlap which only ap-proximate the strong field reality involving two-electron, two nuclei dynamics.
Nevertheless, this although complete and rigorously solved model does not reveal the physical mechanism and the origin of the observed spectral progression in the KER spectra. Therefore, we present in the following two sections a model that only includes the two lowest electronic surfaces of the molecular ion, shown in Fig. 1. The nuclear wave packet is then solved rigorously. The resulting spatial shapes of the wave packet show a clear interference structure. Using this simple model we calculate the KER Coulomb explosion spectra with the help of the hypothesis that at each laser half-cycle, when the laser field reaches maximum or mini-mum, the instantaneous ionization occurs predominantly from a coherent nuclear wave packet on the quasi-static up-per electronic surface+ 关13,16兴; see Fig.1. We show that the spectral lines in the KER spectra are directly linked to the spatial interference structure present in this coherent nuclear wave packet.
IV. SPATIAL INTERFERENCE STRUCTURE IN THE DISSOCIATING WAVE PACKET OBTAINED
FROM THE TWO-SURFACE DYNAMICS
We model the nuclear dissociation dynamics using the two-surface TDSE in which the complete wave function 共rជel, R , t兲 is approximated as a superposition of two elec-tronic eigenfunctions gel共rជel, R兲 and u
el
共rជel, R兲 共g and u兲
weighted by the corresponding nuclear amplitudesg共R , t兲, u共R , t兲 关3,24兴: 共rជel,R,t兲 =g共R,t兲g el 共rជel,R兲 +u共R,t兲u el 共rជel,R兲. 共10兲 Inserting the above equation into the TDSE describing the full electron-nuclear dynamics 共we assume that the laser electric field is parallel to the molecular axis and limit the nuclear dynamics to 1D along z axis兲 yields the following two coupled differential equations for the nuclear functions g共R , t兲,u共R , t兲 关3兴: ig共R,t兲 t = − 1 2 2 R2g共R,t兲 + Vg共R兲g共R,t兲 +E共t兲 ⫻具g el兩z兩 u el典 u共R,t兲, iu共R,t兲 t = − 1 2 2 R2u共R,t兲 + Vu共R兲u共R,t兲 +E共t兲 ⫻具uel兩z兩gel典g共R,t兲 共11兲 were兩g共R , t兲兩2and兩
u共R , t兲兩2 represent the probability
den-sity for the molecule in the g andu states, respectively,
and Vg共R兲, Vu共R兲 are the corresponding, exact 3-D,
molecu-lar potentials. We solve these Equations numerically assum-ing that initially共as in the previous section兲u共R , 0兲 = 0 and
g共R , 0兲 is equal to the vibrational ground state v = 0 of H2 共D2兲, i.e. we use the same initial condition as described by eq.共4兲. Eq. 共11兲 describes correctly the dissociation dynam-ics of H2+ or D2+at low intensities at which ionization oc-curring in one cycle is negligible. We use the same artificial laser pulse envelope as in the previous section.
The essential ingredient of our Coulomb explosion model 共introduced in the next section兲 is an assumption that the tunnel 共or overbarrier兲 instantaneous ionization occurs at each half-cycle of the laser field when the electric field E共t兲 reaches maximum or minimum, tk= kTlas/ 2, k = 1 , 2 , . . ., where Tlas is the laser period. This ionization takes place from the upper quasistatic electronic state+共Fig.1兲 calcu-lated at E共t兲 = E共tk兲. This assumption is supported by Fig. 4 in
关16兴 which shows the values of two electronic states+and −of H2
+in the DC-electric field calculated at E共t
k兲. Clearly,
at the laser intensity I = 1014W / cm2the upper共up-hill兲 state +is well over barrier for 4 a.u.⬍ R ⬍ 10 a.u., as illustrated in Fig.1共b兲. Consequently, the ionization rate from this state is several order of magnitude higher关13,16,35,36兴 than from the down-hill−state. The terms “down-hill”/“up-hill” origi-nate from the fact that at large internuclear distance these states correspond to the well localized electrons on the left or right proton correspondingly, i.e. in order to displace the electron from its location in lower energy − state into its location in the + state one moves against 共“up-hill”兲 the force originating from the laser. Hence, we believe, that ion-ization occurs primarily from the up-hill state and that the KER spectra are directly related to the shape of the R-dependent population兩+共R , tk兲兩2and to the R-dependence
of the DC-ionization rates investigated earlier in 关13,16,35,36兴. λ=600 nm 3 4 5 6 7 8 9 sp ectr um S (E N )( e V -1 ) 0.00 0.01 0.02 0.03 0.04 0.05 I=1x10¹⁴, tp=40 fs (a)
total nuclear energy (eV)
3 4 5 6 7 8 9 0.00 0.01 0.02 0.03 0.04 0.05 0.06 H2+ tp=80 fs D2+ 8x10¹³ (b) 4xS for D2+ 20xS for tp=40 fs D2+ λ=600 nm
FIG. 8.共Color online兲 Kinetic energy release 共KER兲 spectra for D2+at wavelength = 600 nm, calculated using the TDSE given in Eq.共1兲.
More specifically, the electronic surface+共R兲 and its cor-responding nuclear component +共R , tk兲 are calculated via
diagonalization of the electronic molecular Hamiltonian with the laser interaction term E共t兲zel. If we represent this Hamil-tonian in the basis of just two electronic states we only need to diagonalize the following 2 ⫻ 2 matrix:
冋
Vg共R兲 − E共t兲g,u − E共t兲g,u Vu共R兲册
, 共12兲
where g,u is the dipole transition matrix element, g,u =具gel兩zel兩u
el
典 ⯝ R / 2 关3兴 called a charge-resonance transition 关3兴. The above matrix has the following eigenvalues:
±共R,t兲 = 1 2兵Vg共R兲 + Vu共R兲 ±
冑
关Vu共R兲 − Vg共R兲兴 2 +关E共t兲R兴2其. 共13兲 −共R兲 corresponds to “bond-softening” whereas+共R兲 leads to laser induced bound states关3,23,37,38兴, and is time de-pendent, Fig.1共b兲. At large internuclear distance R ⬎ 6 a.u. the upper+共R , t兲 electronic state eigenvalue simplifies to+共R,t兲 ⯝ 关Vg共R兲 + Vu共R兲兴/2 + 兩E共t兲兩R/2.
The corresponding electronic time-dependent eigenfunction is ⌿+共rជel,R,t兲 = 关1 + a共R,t兲2兴−1/2关u el 共rជel,R兲 − a共R,t兲g el 共rជel,R兲兴, a共R,t兲 = RE共t兲 Vu共R兲 − Vg共R兲 +
冑
关Vu共R兲 − Vg共R兲兴2+ R2E共t兲2 . 共14兲 ⌿+共t兲 coincides with the doorway 共upper兲 state ⌿2共R , t兲 used in关22兴 and also called eigenfunction of the adiabatic “instan-taneous” electronic Hamiltonian. In our simple Coulomb ex-plosion model presented in the next section, we assume that the KER spectrum is directly determined via projection of the time dependent state关Eq. 共10兲兴 onto the adiabatic upper eigenstate ⌿+共t兲, at t = tk= kTlas/ 2 where Tlas is the laser cycle. This projection can also be defined for any time t in the following way:+共R,t兲 = 具⌿+共t兲兩共rជel,R,t兲典 =关1 + a共R,t兲2兴−1/2关
u共R,t兲 − a共R,t兲g共R,t兲兴.
共15兲 Note that this is a coherent superposition of two nuclear wave functions g共R , t兲 and u共R , t兲. At large internuclear
separations, R ⬎ 6 a.u., and when兩E共t兲兩 Ⰷ Vu共R兲 − Vg共R兲, Eq.
共15兲 simplifies to
+共R,t兲 ⯝ 2−1/2兵u共R,t兲 − sgn关E共t兲兴g共R,t兲其,
sgn关E共t兲兴 = E共t兲/兩E共t兲兩. 共16兲 Thus at R ⬎ 6 a.u.兩+共R , t兲兩2is the probability of finding the electron localized on the left or on the right center, depend-ing on the changdepend-ing sign of the laser field E共t兲.
We have calculated the nuclear wave packets u共R , t兲,
g共R , t兲 and +共R , t兲 by solving numerically the coupled
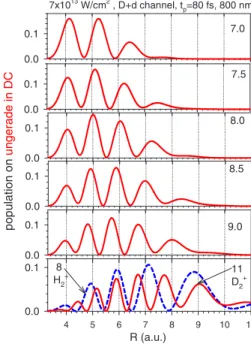
equations 共11兲 and using Eq. 共15兲. We plot the resulting populations 兩+共R , t兲兩2 on the up-hill surface in Fig. 9共a兲 which shows a very strong interference pattern. Since we expect the ionization to occur at maxima of兩E共t兲兩 we exam-ine this interference pattern in more detail by looking at populations兩+共R , t兲兩2 calculated at consecutive half-cycles, t= 7 , 712, 8 , 821. . . etc. cycles, which we show separately in Figs.10and11, for = 800 nm and for = 1200 nm, respec-tively. Note that we use two-cycle rise time, i.e., 7 cycles means 5 cycles after the pulse envelope reached the maxi-mum, Eq. 共5兲. Populations on the upper surface, shown in Fig. 9共a兲, appear abruptly at t ⬎ 3.5 cycles 共1.5 cycle after the pulse envelope reached a maximum. During this short time the wave packet has moved quite a large distance from
R= 1.4 a.u. 共its location at t = 0兲 to R = 4.0 a.u. where the population was transferred up to the+surface and, surpris-ingly, stays constant around R1= 4.2 a.u. during next 3-cycles. This trapped population should lead to a clear peak in the nuclear KER spectra. If the ionization occurs at R
R (a.u.) t (laser cycles) (a) 3 4 5 6 7 8 3 4 5 6 7 8 9 0.05 0.1 0.15 0.2 0.25 R (a.u.) t (laser cycles) (b) 3 4 5 6 7 8 3 4 5 6 7 8 9 0.05 0.1 0.15 0.2 0.25
FIG. 9.共Color online兲 Populations 兩+兩2on the quasistatic uphill
surface on D2+obtained using共a兲 two-surface Schrödinger equation 共11兲 for the wavelength = 800 nm, laser intensity I = 8 ⫻ 1013W / cm2, t
p= 40 fs and 共b兲 shows 兩+兩2 calculated with the
help of Eq.共16兲 using Eg= 1.05 eV and Eu= 0.24 eV.
7x10¹³ W/cm2 , D+d channel, tp=80 fs, 800 nm 0.0 0.1 po pu la ti on on un ge ra de in D C 0.0 0.1 0.0 0.1 7.0 7.5 8.0 4 5 6 7 8 9 10 11 0.0 0.1 0.0 0.1 R (a.u.) 8.5 11 D2+ 0.0 0.1 9.0 8 H2+
FIG. 10. 共Color online兲 Same as in Fig.9共a兲but displayed at consecutive half-cycles, i.e., at times 7.0, 7.5, 8.0,…optical cycles T, as indicated in the right corner of each panel. I = 7 ⫻ 1013W / cm2; t
= R1 the released Coulomb explosion energy is Eexpl= e2/ R1 = 6.5 eV which is indeed close to the highest energy peak seen in experimental spectra shown in Fig.2共c兲.
In Fig.11 we also show the population in the down-hill surface兩−共R , tk兲兩2共dashed line兲. The total population is
un-modulated because the lower level has the complementary population. Both populations seem to have simple cosine like shapes shifted by/ 2 with respect to each other, suggesting a simple interference mechanism taking place. Therefore, the total 共incoherent兲 probability distribution P共R , t兲 =兩+共R , tk兲兩2+兩−共R , tk兲兩2 will not exhibit the interference
structure.
It is surprising how wide the wave packet becomes at only
t= 10 cycles when it extends over 6 a.u. and initially its width was only 0.4 a.u.. This drastic widening of the wave packet during only a few cycles time interval tells us that the nuclear dynamics is an essential coherent factor. Conse-quently, static, frequency dependent rates calculated at fixed internuclear distance关11,13–18兴 cannot be used directly for calculations of KER Coulomb explosion spectra since even for a heavier isotope we see significant changes of the wave packet shapes in Figs. 10 and 11 occurring during few cycles. Thus, the computation of the KER should be rather done by projecting the instantaneous wave packet+共R , t兲 at each consecutive half-cycle weighed by the ionization ampli-tude corresponding to each half-cycle. We present such a model calculation of KER spectra in the next section.
The positions of peaks共and of minima兲 seen in Figs. 10 and11 remain nearly unchanged within 5 to 9 laser cycles and for small internuclear separation, whereas for later times, new peaks appear at R ⬎ 6 a.u.. The spatial position od this peaks moves to towards smaller R
⬘
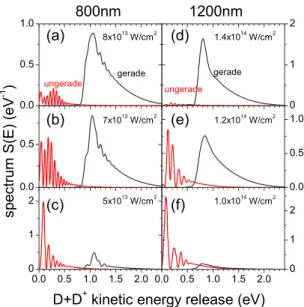
sas function of time. The sharpness and regularity of these structures suggests that they are the direct origin of the spectral lines seen in the experi-mental and theoretical spectra, shown in the previous sec-tion. We already suggested earlier that the spacings between spectral depend on final nuclear momenta kg, ku.In order to establish more precisely this relation we plot in Figs.12共a兲–12共c兲the KER for the D + D+dissociation chan-nel for = 800 nm. We observe that at lower intensity, I Ⰶ 7 ⫻ 1013
W / cm2, the dissociation proceeds predominantly via the ungerade u surface with low energy nuclei Eu
⬍ 0.3 eV共with one photon absorbed兲 whereas at higher in-tensities, I Ⰷ 7 ⫻ 1013 W / cm2, the molecule dissociates pre-dominantly on the gerade共gsurface, achieving much higher
energy, Eg⯝ 1.05 eV. Thus, at intensities close to 7 − 8
⫻ 1013
W / cm2 we expect the strongest interference pattern since both these channels contribute nearly equally. Hence the choice of a lower laser intensity than the experimental value in Fig.9共a兲and10is justified in order to explore the origin of the interference phenomenon.
We now propose a very simple quantitative explanation of spacings between minima seen in Figs.9–11. At large inter-nuclear distance and after turning-off of the laser pulse we expect that the nuclear wave packets have the following ap-proximate, simple共field free兲 form:
g共R,t兲 = ag共R,t兲exp共ikgR− iEgt兲 and
u共R,t兲 = au共R,t兲exp共ikuR− iEut兲, 共17兲
where kg共u兲=
冑
2Eg共u兲 are the momenta of the gerade and ungerade surface and ag共u兲are slowly varying complexfunc-0.0 0.1
1.2x10
14W/cm
2, t
p=80 fs, 1200 nm
6.5 0.0 0.1popul
at
ion
on
unger
ade
and
ger
ade
(D
C)
0.0 0.1 0.0 0.1 7.0 7.5 8.0 4 5 6 7 8 9 10 11 0.0 0.1 0.0 0.1R (a.u.)
8.5 9.0FIG. 11. 共Color online兲 Same as in Fig.10 but for the wave-length = 1200 nm.
FIG. 12. 共Color online兲 Dissociation KER in the channel D + D+ calculated using two-surface Schrödinger equation 共11兲 for 共a兲–共c兲 the wavelength = 800 nm, and for 共d兲–共f兲, for various laser intensities given in each panel. Longer pulse duration, p= 80 fs, is used.
tions. Inserting Eq. 共17兲 into Eq. 共16兲 yield the following approximate shape of the coherently dissociating wave packet projected onto the up-hill quasistatic:
P+共R,t兲 = 兩+共R,t兲兩2⯝ 1 2兵兩ag兩
2
+兩au兩2− 2 sgn关E共t兲兴兩ag兩
⫻兩au兩cos关共kg− ku兲R − 共Eg− Eu兲t +␦兴其, 共18兲
where␦ is the relative phase between two complex ampli-tudes ag and au. Assuming that␦ does not depend on R we
conclude that for any fixed time共in particular, at each con-secutive half-cycle兲 the function P+共R , t兲 has minima sepa-rated by
⌬R = 2
kg− ku
. 共19兲
In Fig.9共b兲we directly plot Eq.共18兲 where we assumed ag
= au= 1 and␦= 0 and Eg= 1.05 eV and Eu= 0.24 eV
共theoret-ical values in Fig.12兲. The resemblance of Fig.9共b兲and Fig. 9共a兲at R ⬎ 6 a.u. constitutes a strong support for the scenario in which two waves given in Eq.共17兲 interfere.
We expect from Eq. 共18兲 that the phase inside the cos-function in Eq.共18兲 changes by 共Eg− Eu兲Tlas/ 2 from one to the next half-cycle. However, since共Eg− Eu兲 ⯝this change
is close to . We also have: E共t + Tlas/ 2兲 = −E共t兲. Conse-quently, if 共Eg− Eu兲 were equal to the laser frequency the
positions of minima would be identical for each laser half-cycle. This simple argument explains the “stability” of the minima positions seen in Figs.10and11. The slight shift to left of these minima results from the fact that 共Eg− Eu兲 is
usually smaller than the photon energy. This shift to the left is clearly seen in Fig. 9共a兲 if we draw the lines along the minima or maxima we observe that the lines have a negative slope. Equation 共18兲 reveals that this negative slope origi-nates from the fact that共Eg− Eu兲 ⬍ ប. We also checked that
the lines are vertical when 共Eg− Eu兲 ⬍ ប and the slope is
positive for共Eg− Eu兲 ⬎ ប.
Using the values of the dissociation energies, Eg
= 1.05 eV and Eu= 0.24 eV we can check directly that indeed
the above simple relations 共19兲 give correct spacings be-tween the interference minima seen in Fig.9共a兲and in Figs. 10 and 11. We thus get the corresponding values of mo-menta: kg= 11.901 a.u., ku= 5.6897 a.u., and the separation
between the minima is: ⌬R = 2/共kg− ku兲 = 1.012 a.u.. This
compares well with the minima separations 1.1 a.u. seen in Fig. 10 for a D2+ molecule. Since the momenta kg共u兲 are proportional to the molecular reduced masswe expect the corresponding spacings for a H2
+
molecule to be larger: ⌬R = 1.431 a.u. These estimates of the isotope effect agree with the spacings seen in the lowest panel in Fig.10where we superimposed the populations 兩+共R , tk兲兩2 for both
iso-topes. Clearly, the spacing ratio is close to the square-root of the mass ratio. Hence our simple relation共19兲 explains the isotope effect seen in the experimental and theoretical KER spectra, in where spacings between minima are in fact larger for H2
+
than for D2 +
.
Similarly, since the momentum, kg is related to the
ab-sorption of two-photons and kuis related to the absorption of
just one photon we expect kgto be smaller for = 1200 nm
than for = 800 nm, as indeed seen in Fig.12共d兲–12共f兲which gives us: Eg= 0.83 eV and Eu= 0.2 eV at I= 1.2
⫻ 1014W / cm2. Consequently, the corresponding expected spacing ⌬R calculated with the help of Eq.共19兲 for 1200 nm is ⌬R = 1.166 a.u. which is larger than ⌬R = 1.012 a.u. for = 800 nm and agrees with the spacings seen in Fig. 11. Larger ⌬R spacings correspond to larger separations in KER spectra共when compared within similar energy intervals兲 for = 1200 nm than for 800 nm. This is a surprising result since it is natural to expect that the separation between spectral lines is proportional to the photon energy which would lead to the smaller spacing for 1200 nm compared to 800 m. In-stead, we observe the opposite effect reflecting the coherent nature of the one and two-photon absorptions. This effect is directly related to the fact that the beating between different components of the same packet slows down as as their en-ergy difference becomes smaller with longer wavelength. Summarizing, the interference of two plane waves explains the isotope and wavelength dependence of the peak spacings.
V. SIMPLE MODELS OF THE DISSOCIATIVE IONIZATION FROM THE UPHILL
QUASISTATIC SURFACE
We now introduce a simple Coulomb explosion model based on coherent dissociating wave packets +共R , t兲 关de-fined in Eq.共15兲兴 obtained numerically from the two-surface model described in the previous section. The model relies on the assumption that at each consecutive minimum and maxi-mum of the laser electric field E共t兲, i.e., at t = tk= kTlas/ 2, a fraction of the nuclear wave packet+is transferred instan-taneously from the quasi-static surface+onto the p + p共or d+ d兲 repulsive p + p 共or d + d兲 surface. The nuclear eigen-functionsC共EN, R兲 on this repulsive surface are given in eq.
共6兲. Subsequent contributions to the instantaneous Coulomb explosion from each consecutive half-cycle are added inco-herently as a sum of transition probabilities to the p + p + e continuum states. Let us assume that the amplitude for for this instantaneous electronic jump occurring at fixed internu-clear separation R, at E共t兲 = E共tk兲 is Bel(pជel, R , E共tk兲).
Assum-ing that the initial and final wave functions are proportional to the “pure”共i.e. only R-dependent兲 nuclear wave functions +共R , tk兲 and C共EN, R兲 we calculate the nuclear spectra
S共EN兲 共integrated over the electronic momenta pជel兲 in the following way: S共EN兲 =
兺
k=1 kf冕
d3pel兩A„pជel,EN,E共tk兲…兩2, 共20兲 where A„pជel,EN,E共tk兲… =冕
0 ⬁ dR Bel共pជel,R,E共tk兲…C * 共EN,R兲+共R,tk兲 共21兲 is the transition amplitude共at instantaneous field E共tk兲兲 fromelec-tron state characterized by the momentum pជeland free p + p 共or d + d兲 state having the kinetic energy ENand described by
C共EN, R兲, where ⌿+共rជel, R , t兲 was defined in Eq. 共15兲. Knowing that the Coulomb wave functionC共EN, R兲 is well
localized at R⯝ Rexpl= e2/ EN关5兴 共in fact, standard Coulomb
explosion imaging relies on replacing the Coulomb wave function by the Dirac␦共R − e2
/ EN兲 function兲 we expect that
the function Bel共pជel, R , E共tk兲兲 varies little in comparison with
C共EN, R兲 and therefore it can be extracted outside the
inte-gral with the substitution R = e2/ E
N. This leads us to the
model I共which was already used earlier in 关21兴兲:
SI共EN兲 =
兺
k=1 kf 兩fk FC兩2兩P k共R兲兩R=e2/EN, 共22兲 where the value of the index kf is fixed by the requirementthat the summation stops when the laser intensity I共t兲 falls to
Imax/ 8. In Eq.共22兲 fkFC=
冕
0 ⬁
⌿C共EN,R
⬘
兲+共R⬘
,tk兲dR⬘
共23兲are the Franck-Condon factors for the transition from the quasistatic + surface fk
FC
to the p + p 共or d + d兲 repulsive surface and
Pk共R兲 =
冕
d3pel兩B„pជel,R,E共tk兲…兩2at R = e2/EN 共24兲are the ionization probabilities which we calculate using published ionization rates ⌫(R , E共tk兲) 共averaged over a
half-cycle兲 from the upper state ⌿+共R , tk兲 given in Tables 1, 2 in
关35兴. We plot these rates in Fig.13. The probabilities Pk共R兲
are calculated in the following way:
Pk共R兲 = 1 − exp关− ⌫„R,E共tk兲…Tlas/2兴 at R = e2/EN. 共25兲
Model I was derived with the help of the assumption that the variation of the electronic amplitude Bel(pជel, R , E共tk兲) is
neg-ligible in comparison with the variationC共EN, R兲 and
there-fore we extracted the amplitude Bel outside the integral present in Eq.共21兲. However, we conclude from Fig.13that
at intensities I ⬍ 1014W / cm2 and at R ⬍ 4.5 a.u. the ioniza-tion rates ⌫共R兲 vary rapidly.
We propose model II which takes into account approxi-mately the R dependence of Belinside the integral present in Eq. 共21兲. Since we do not know the complex amplitude
Bel(pជel, R , E共tk兲) we extract from it its fast varying factor
Pk共R兲 obtained after the integration of 兩Bel兩2over the electron momenta, i.e. we write this amplitude in the form:
Bel„pជel,R,E共tk兲… =
冑
Pk共R兲Bel„pជel,R,E共tk兲…
冑
Pk共R兲. 共26兲
We now retain the first factor Pk共R兲 from the above equation
inside the integral present in Eq.共21兲 and extract outside this integral the factor Bel/
冑
Pk. We expect that the latter factorvariation as function of R is slower than the variation of
Pk共R兲. This leads us to model II described by
SII共EN兲 =
兺
k=1 kf 兩fk⬘
FC 兩2 , 共27兲 where fk⬘
FC=冕
0 ⬁ ⌿C共EN,R兲冑
Pk共R兲+共R,tk兲dR. 共28兲This model resembles a model used earlier in关9,10兴 for the first step ionization of H2, where the variation due to ioniza-tion rates was introduced inside the Franck-Condon factor for transition from the v = 0 state of H2 to the vibrational states of H2
+ .
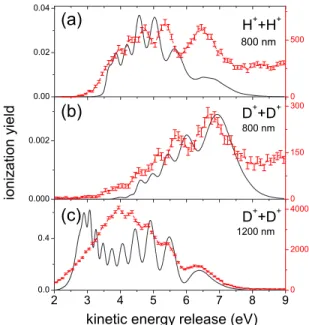
In Fig.14we compare the results of our model I with the experimental data. Sampling each 1 / 2 laser period by field ionization and adding incoherently, as described in Eq.共22兲 we obtain a reasonably good agreement of the peak spacing with the experiment. We note, by comparing Fig.14共a兲with Fig.14共b兲 that the isotope effect seen in the experiment is
R (a.u.) 3 4 5 6 7 8 9 10 11 12 io ni za ti on ra tes Γ(f s -1 ) 10-3 10-2 10-1 1.3x10¹⁴ 8x10¹³ W/cm2 1.5x10¹⁴ 1.0x10¹⁴ 1.2x10¹⁴
FIG. 13.共Color online兲 Ionization rates ⌫ in the dc-electric field obtained from Tables 1 and 2 in关35兴.
FIG. 14. 共Color online兲 KER nuclear spectra obtained using model I described by Eq.共22兲.
correctly reproduced by our simple model. For the case of wavelength = 800 nm, we note a systematic shift of theo-retical peaks compared to the experimental one which origi-nates probably from the simplicity of our model which does not describe properly the initial 共involving two-electron ef-fect兲 part. Note, however, that for the longer wavelength case, = 1200 nm, the experimental and theoretical peak po-sitions are very close one to another. Furthermore, by com-paring Fig. 14共b兲 with Fig. 14共c兲 we confirm the general trend in wavelength dependence of peak spacings in the KER nuclear spectra.
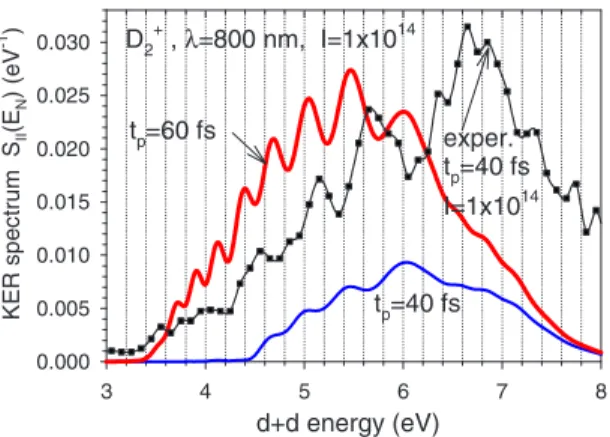
Despite the conceptual improvement model II yields worse agreement with the experiment, see results for the pulse duration tp= 40 fs, for which the spectrum exhibit
nearly no oscillations. The oscillations appear for longer, tp
= 60 fs pulses, but the high energy tail 共EN⬎ 5 eV兲 differs
significantly from the experimental results. We suspect that this negative result is related to the fact that at an intensity
I= 1014W / cm2the ionization probability strongly suppresses the wave packet part for R ⬍ 4.5 a.u.; see Fig.13. By using higher intensity one allows to conserve the full shape of the wave packet during the projection process onto the repulsive Coulomb p + p 共or d + d兲 surface. But at the same time, the use of higher intensities leads to the destruction of the ference pattern which we believe originates from the inter-play between two dissociation channels leading to two dis-tinct dissociation peaks in the H + p共or D + d兲 channel.
This observation suggests to introduce model III, which takes into account the fact that part of the spectrum may originate from non-aligned molecules which “feel” weaker electric field than molecules whose axis are perfectly parallel to the laser polarization. Note that models I and II assume that all molecules are perfectly aligned with the linearly po-larized laser field, whereas ionization of H2 occurs from an isotropic ensemble leading to the creation of H2
+
molecules with a small degree of alignment. The possible importance of this nonalignment effect is indeed supported by angle re-solved experimental KER shown in Fig.16, where angleis an angle between the molecular axis and the laser polariza-tion. In Fig.16we examine the experimental distribution of deuterons in the laboratory frame in linearly polarized, 800 nm laser pulses of 40 fs duration at a peak intensity of 1.4⫻ 1014W / cm2. Only deuterons produced by enhanced
ionization of D2 are included. Figure 16共a兲 shows the mo-mentum components along the laser polarization and along the axis of the gas jet. Clearly, not all molecules are perfectly aligned with the polarization. Therefore, a considerable frac-tion of the molecules experiences a decreased laser field strength along the molecular bond. Figure 16共b兲 plots the kinetic energy release of exploding molecules versus the lar angle of the molecular axis with respect to the laser po-larization. We then make cuts for different solid angle inter-vals and project the corresponding kinetic energy release as shown in Fig.16共c兲. The fixed binning size of the solid angle is responsible for the seemingly vanishing ionization yield for almost perfectly aligned molecules. Consequently, the maximum number of counts Nmax peaks for the solid angle interval of 11°–20°关see line labels in Fig.16共c兲兴. Strikingly, the peak position seems to be dependent on the angle be-tween molecule and laser field, i.e., better alignment shifts the peaks to lower energies. At angles larger than 40° struc-ture in the enhanced ionization cannot be found. We also note, the peaks from the interval of rather large angles, 21° –40° and from the interval 11°–20° are sharper than from smallest angle interval. This is probably related to the fact that the nonaligned molecules dissociate in the weaker field, since the field component along the molecular axis is
E共t兲cos共兲, and the weaker field should lead to stronger in-terference structure as expected from the discussion in pre-vious section related to Fig.12.
We investigate in model III these rotational effects by choosing an angle = 35° in the dissociation step, i.e., we perform the dissociation simulation based on Eq. 共11兲 in which E共t兲 is replaced by E共t兲cos共兲. We assume, however, that the ionization occurs at the full field value, i.e., it is assumed that the Coulomb explosion rate from the “up-hill” state is angle independent. This scenario accounts for the different alignment sensitivities of the dissociation and ion-ization steps, clearly, the dissociation cannot occur 共within our two-surface model兲 at an angle= 90° while ionization is possible at this angle. We may also expect that during the wave packet motion from R = Req= 1.4 a.u to the critical EI distance R = RC⯝ 5 – 10 a.u. the molecular ions become better
aligned with the field.
We show in Fig.17spectra obtained using the model III for= 35°, and for an intensity I = 1.2⫻ 1014W / cm2, the lat-ter is slightly higher than the experimental intensity. We note a much better agreement between theory and the experiment for a H2
+
molecule and only slight improvement of theoret-ical peak position for D2
+
molecule共with respect to model I兲. However, for the wavelength = 1200 nm at an intensity I = 1.5⫻ 1014W / cm2, the model III agrees very well with the experimental spectra共see Fig.18.兲
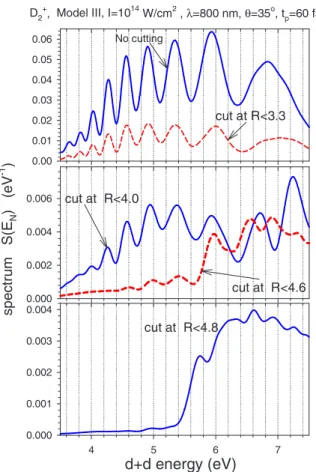
Our studies of the wave packet spatial shapes presented in the previous section suggest that the regular spectral progres-sion seen in the KER spectra may originate from the inter-ference of two wave packet having two, rather well defined momenta kgand ku. In order to demonstrate directly this link
we performed a series of calculations based on the model III in which we altered the two-surface dissociation dynamics by removing the populations on the ungerade surface at a series of chosen intervals R ⬍ Rcut. Starting from Rcut = 3.3 a.u. we remove the contribution from the three-photon
3 4 5 6 7 8 0.000 0.005 0.010 0.015 0.020 0.025 0.030 KE R s pe ct rum SII (E N )( e V -1 ) D2+, λ=800 nm, I=1x10¹⁴ d+d energy (eV) tp=60 fs tp=40 fs exper. tp=40 fs I=1x10¹⁴
FIG. 15. 共Color online兲 KER nuclear spectra obtained using model II described by Eq.共27兲.
crossing. For R = Rcut⯝ 4.4 a.u. we eliminate the net-two-photon contribution which occurs via the intermediate u
state. The results presented in Fig.19and also in Fig.20共for model I and very low intensity兲 demonstrate that by increas-ing, step by step, the cutting interval defined by Rcut we gradually decrease the amplitude of oscillation in the spectral progression. When the transitions occur only close to the one-photon crossing共which occurs at R = 4.8 a.u.兲 the struc-ture vanishes in the spectrum. More specifically, we see in Fig.20 that if we remove a part of the wave packet corre-sponding to the first maximum in R = 4.2 a.u seen in Fig.9共a兲 the interference is removed. This proves that the fast compo-nent of the wave packet+共R , t兲 created at R ⯝ 4.2 a.u. 关see Fig.9共a兲兴 is essential in the interference process. Clearly, the origin of the lines has thus a rather dynamical character, since when the wave packet is prepared only via an one-photon crossing共thus it has only a low momentum ku
com-ponent兲 the structure vanishes.
Finally, since we have used an artificial pulse envelope, see Eq.共5兲, we have checked using model I the sensitivity of the model spectra to the rise time trise. We observed that the peak position remains unchanged for trise= 1 and 0.5 cycle. The sensitivity of spectra to pulse rise共for longer trise兲 was also checked with the help of our TDSE code; see Fig.4.
Summarizing, we have established the origin of the modulation on the two surfaces. From Eq. 共16兲 we expect that effectively two coherent plane waves will interfere lead-ing to the appearance of a cosine like structure in兩+共R兲兩2
-40 -30 -20 -10 0 10 20 30 40 -40 -20 0 20 40 0 20 40 60 80 100 pTOF(a.u.) pjet (a.u.)
D
+of EI only
(a)
0 20 40 60 80 100 120 140 160 180 2 3 4 5 6 7 8 9 0 100 200 300 400 500 KER (eV) polar a ngle θ (deg)(b)
2 2.5 3 3.5 4 4.5 5 5.5 6 6.5 7 7.5 8 8.5 9 D++ D+KER (eV) ion yield 1.4 x 10¹⁴W/cm2 linear pol. 800 nm, 40 fs 0.2o- 10o(Nmax: 612) 11o- 20o(Nmax: 978) 21o- 40o(Nmax: 832) 41o- 90o(Nmax: 130)(c)
FIG. 16. 共Color online兲 Mo-mentum and angle resolved ex-perimental KER spectra. Panel 共a兲: Experimental distributions of deuterons produced by enhanced ionization共EI兲 at the laser param-eters indicated in 共c兲. The polar-ization is horizontal. Panel 共b兲 Same data as in共a兲, but different presentation. Kinetic energy re-lease of deuteron pairs in the EI region vs the angle between the molecular axis and polarization. Horizontal lines indicate position of angular intervals projected in panel共c兲. Panel 共c兲: Projection of angular intervals. Number of maximum counts Nmax for each projection is given in the figure.
total ion energy energy (eV)
4 5 6 7 0.00 0.02 0.04 0.06 0.08
KER
spe
ctru
m
(eV
-1)
4 5 6 7 0.000 0.005 0.010 0.015 0.020 0.025 0.030 D2+ model III I= 1.2x10¹⁴W/cm2, λ=800 nm, θ=35o. D2 experiment I=1014 H2+ model III H2-experiment I=1014(a)
(b)
FIG. 17. 共Color online兲 KER nuclear spectra obtained using model III described by Eq.共27兲 using an angle = 35° and a laser intensity I = 2 ⫻ 1014. Wavelength = 800 nm and pulse duration tp = 40 fs are used.