Publisher’s version / Version de l'éditeur:
Cement and Concrete Research, 37, February 2, pp. 200-209, 2007
READ THESE TERMS AND CONDITIONS CAREFULLY BEFORE USING THIS WEBSITE. https://nrc-publications.canada.ca/eng/copyright
Vous avez des questions? Nous pouvons vous aider. Pour communiquer directement avec un auteur, consultez la
première page de la revue dans laquelle son article a été publié afin de trouver ses coordonnées. Si vous n’arrivez pas à les repérer, communiquez avec nous à PublicationsArchive-ArchivesPublications@nrc-cnrc.gc.ca.
Questions? Contact the NRC Publications Archive team at
PublicationsArchive-ArchivesPublications@nrc-cnrc.gc.ca. If you wish to email the authors directly, please see the first page of the publication for their contact information.
NRC Publications Archive
Archives des publications du CNRC
This publication could be one of several versions: author’s original, accepted manuscript or the publisher’s version. / La version de cette publication peut être l’une des suivantes : la version prépublication de l’auteur, la version acceptée du manuscrit ou la version de l’éditeur.
For the publisher’s version, please access the DOI link below./ Pour consulter la version de l’éditeur, utilisez le lien DOI ci-dessous.
https://doi.org/10.1016/j.cemconres.2006.11.005
Access and use of this website and the material on it are subject to the Terms and Conditions set forth at
An Experimental approach for the analysis of early-age behaviour of high-performance concrete structures under restrained shrinkage
Cusson, D.; Hoogeveen, T. J.
https://publications-cnrc.canada.ca/fra/droits
L’accès à ce site Web et l’utilisation de son contenu sont assujettis aux conditions présentées dans le site LISEZ CES CONDITIONS ATTENTIVEMENT AVANT D’UTILISER CE SITE WEB.
NRC Publications Record / Notice d'Archives des publications de CNRC:
https://nrc-publications.canada.ca/eng/view/object/?id=f127bc0b-7fbc-409c-be4f-69c41a588ac7 https://publications-cnrc.canada.ca/fra/voir/objet/?id=f127bc0b-7fbc-409c-be4f-69c41a588ac7
http://irc.nrc-cnrc.gc.ca
A n E x p e r i m e n t a l a p p r o a c h f o r t h e a n a l y s i s o f
e a r l y - a g e b e h a v i o u r o f h i g h - p e r f o r m a n c e
c o n c r e t e s t r u c t u r e s u n d e r r e s t r a i n e d
s h r i n k a g e
N R C C 4 8 6 6 4
C u s s o n , D . , H o o g e v e e n , T . J .
2 0 0 7
A version of this document is published in / Une version de ce document se trouve dans: Cement and Concrete Research, Vol. 37, No. 2, February 2007, pp. 200-209.
The material in this document is covered by the provisions of the Copyright Act, by Canadian laws, policies, regulations and international agreements. Such provisions serve to identify the information source and, in specific instances, to prohibit reproduction of materials without written permission. For more information visit http://laws.justice.gc.ca/en/showtdm/cs/C-42
Les renseignements dans ce document sont protégés par la Loi sur le droit d'auteur, par les lois, les politiques et les règlements du Canada et des accords internationaux. Ces dispositions permettent d'identifier la source de l'information et, dans certains cas, d'interdire la copie de documents sans permission écrite. Pour obtenir de plus amples renseignements : http://lois.justice.gc.ca/fr/showtdm/cs/C-42
An experimental approach for the analysis of early-age behaviour
of high-performance concrete structures under restrained shrinkage
Daniel Cusson* and Ted Hoogeveen
National Research Council Canada, Ottawa, Ontario, K1A 0R6, Canada
Abstract
This paper presents a systematic approach for the experimental testing and analysis of the early-age thermo-mechanical behaviour of large prismatic high-performance concrete specimens under restrained autogenous shrinkage and realistic temperature conditions. The loading system can apply a partial degree of restraint in order to enable the characterisation of high-performance concrete specimens without premature termination of the test in case of significant restrained shrinkage. The instrumentation system can measure the strains and other parameters from the setting time with high accuracy and reliability. The analysis method takes into account the temperature effects on the measured properties and provides equations to determine the time-evolution of shrinkage, thermal expansion, stiffness and creep of the concrete. Results from the testing of 200x200x1000 mm specimens made with a 0.34 water-cement ratio concrete are presented, analysed and discussed in the paper to demonstrate the application of the proposed approach.
1. Introduction
The 1990’s saw a significant increase in the use of high-performance concrete (HPC) in structures. Although HPC can offer superior strength and low permeability, it may develop considerable autogenous shrinkage due to self-desiccation at early age. The main factors
responsible for the development of tensile stresses in HPC structures are thermal and autogenous deformations under restrained conditions, and external loads. If these stresses reach the tensile strength of the concrete, cracking will occur and possibly result in premature corrosion of the steel reinforcement, and spalling of the concrete. Considering the practical importance of this problem in HPC structures, there is still a scarcity of systematic experimental investigations on autogenous and thermal deformations of HPC specimens under realistic thermal regimes and restrained conditions [1]. A review of existing approaches for testing linear shrinkage under restrained conditions [2,3] indicates that most studies have been conducted on mortar specimens of relatively small sizes (usually not larger than 100 mm in width) and under isothermal
conditions. These mortar specimens may behave differently from larger size concrete specimens tested under semi-adiabatic conditions.
This paper presents a systematic approach for the experimental testing and thermo-mechanical behaviour analysis of large prismatic HPC specimens at early age under restrained autogenous shrinkage and realistic temperature conditions. Results from the testing of 200x200x1000 mm specimens made with a 0.34 water-cement ratio (w/c) concrete are presented, analysed and discussed in the paper to demonstrate the application of the proposed approach.
2. Proposed testing system
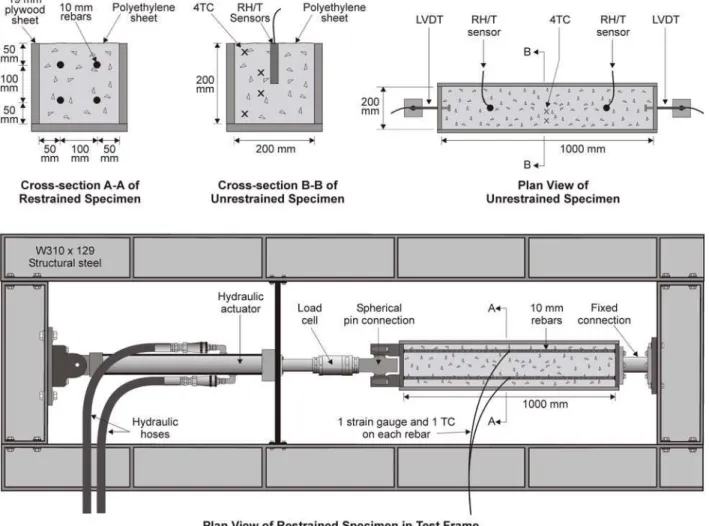
The method proposed for the study of the early-age thermo-mechanical behaviour of HPC specimens under restrained shrinkage is based on an approach originally developed by Kovler [4]. The proposed method includes modifications and innovations made to the original approach in order to enable the testing of relatively large-size reinforced HPC specimens under realistic thermal conditions and varying degrees of mechanical restraint. As shown in Fig. 1, a specimen size of 200x200x1000 mm was selected to allow the testing of concrete specimens that can include coarse aggregate, fibre reinforcement and/or reinforcing bars. The loading system uses a preset degree of restraint (partial or full) by transferring the axial force to the concrete specimen through continuous embedded reinforcing bars, such as in actual reinforced concrete structures. Several challenges related to the specimen size and weight had to be overcome, such as the friction between the concrete and the form during testing, and temperature effects due to the heat of cement hydration released at early age. The test method allows separation of the thermal strain from the autogenous shrinkage strain, and accurate measurements and calculations of shrinkage, thermal expansion, stiffness and creep of the concrete from the setting time.
3. Proposed analysis procedure 3.1. Definition of Time Zero
In restrained shrinkage tests, the precise determination of the time at which stresses start to develop in concrete is of major interest. Deformations occurring before this “Time Zero” can be ignored for stress calculation purposes, since they do not result in stresses. There is no general consensus in the literature on the definition of Time Zero [5], whether it corresponds to the initial
setting, final setting, or some other time. The Japanese Concrete Institute [6], however, recommends measuring autogenous shrinkage from the time of initial setting.
Similar to the Rate of Heat Evolution Method [7], it is proposed to determine Time Zero when the rate of temperature in concrete starts to increase sharply. Figure 2 presents the rate of temperature (left vertical axis) and the measured temperature (right vertical axis) developing in concrete as a function of time after casting. During the dormant stage, the rate of temperature in concrete was zero as expected. Ten hours after casting (Time Zero), the rate of temperature started to increase linearly (which may be due to the onset of cement hydration) and reached a peak 6 hours later. The onset and peak of this increase in the temperature rate may represent the initial setting and final setting times, respectively. It will be shown later that Time Zero, as defined here, corresponds to the time when the axial force started to develop in the restrained concrete specimen, which is in line with the recommendation of the Japanese Concrete Institute.
The amount and rate of temperature increase due to cement hydration will vary according to the concrete formulation, size of the concrete specimen, and type of formwork used during testing. Preliminary tests, however, showed that the onset of the increase in the temperature rate does not depend on those factors, and can be considered as a reliable indicator of Time Zero at which stresses start to develop in the concrete.
3.2. Strain calculation procedure
Conventionally, to study the mechanical behaviour of concrete under restrained shrinkage, two specimens made of the same concrete are tested simultaneously under identical curing conditions:
one under fully-restrained shrinkage, the other under completely-free shrinkage. The strain analysis is usually based on the following compatibility of strain equation:
) ( ) ( ) ( ) ( ) (t el t cr t sh t th t tot ε ε ε ε ε = + + + (1)
where εtot, εel, εcr, εsh and εth are the total, elastic, creep, shrinkage, and thermal strains measured
over time (t), respectively.
In real concrete structures, movement of concrete may be free or partially restrained in some cases, or fully restrained in more severe cases. The proposed testing procedure was designed to offer partial or full restraint to the concrete specimen in order to simulate restrained conditions similar to those found in real concrete structures. A clear advantage of using a partial degree of restraint is that restrained shrinkage testing can be conducted without prematurely failing the concrete specimen under investigation if severe shrinkage develops.
In order to impose a preset degree of restraint (K) in the restrained specimen, it is proposed to determine an amount of total strain that can be controlled during the experiment, such as:
[
( ) ( ) ) 1 ( ) (t K sh t th t tot ε ε]
ε = − + (2)where εtot is the free total strain measured and controlled in the restrained specimen as a function
of time (t), and εsh and εth are the free shrinkage and free thermal strains measured in the
unrestrained concrete specimen, respectively. The degree of restraint may be manually lowered down temporarily by reducing the imposed amount of total strain in order to prevent premature failure of the specimen if the tensile force is expected to reach the estimated tensile capacity.
In conventional approaches, the elastic strain is usually measured by monitoring the total strain and correcting it for free shrinkage by applying increments of tensile force when the total strain reaches a threshold value, usually taken as 10 με [4]. In these approaches, the modulus of elasticity of concrete is usually calculated from the measured stress and the elastic strain data.
In the proposed approach, the loading procedure is different as the force adjusts automatically in response to the predefined amount of total strain imposed during the experiment (Eq. 2). This approach provides very stable strain readings with insignificant noise in the feedback signal. Since the elastic strain is not calculated directly, partial unload/reload cycles must be performed periodically during the experiment in order to determine the concrete modulus of elasticity (Ec) in
tension. The elastic modulus is then calculated as a function of time by regression analysis of the stress-strain data obtained during the partial unload/reload cycles conducted at different times. The elastic strain (εel) developing in the restrained specimen was calculated as follows:
) ( ) ( ) ( t E t t c c el σ ε = (3)
where σc is the concrete stress developing in the restrained specimen. Finally, the creep strain
(εcr) in the restrained specimen (which is the only remaining unknown) was determined from the
compatibility of strain equation (i.e. Eq. 1).
In such a restrained deformation test, the stress in concrete is not constant and may even go in compression due to an initial expansion at very early age caused by the heat of hydration and/or swelling. After the cooling period, the concrete stress will reverse into tension when the rate of shrinkage becomes more significant. The conventional definition of the creep coefficient cannot
be used in such a case. It is proposed to calculate the tensile creep coefficient (φ) from the time at which both the elastic strain (εel) and the change in creep strain (Δεcr) become positive (i.e.
resulting in tensile stresses):
0 ) ( ) ( ) ( ) ( = Δ for t ≥ t t t c el cr σ ε ε φ (4)
During the initial expansion (when σc<0), the creep coefficient may be estimated by linear
interpolation between the value of zero (at t=0) and the first value calculated with Eq. 4. Similarly, the specific creep of concrete (Csp) was calculated as follows:
0 ) ( ) ( ) ( ) ( =Δ for t ≥ t t t C c c cr sp σ σ ε (5)
Finally, the effective modulus of elasticity (Eeff), accounting for the effect of creep on the
concrete stresses, was calculated with the following equation:
) ( 1 ) ( ) ( t t E t Eeff c φ + = (6)
3.3. Corrections for temperature effects on sensor readings
Strain readings – Large-size HPC specimens can generate significant temperature increases at early age due to cement hydration. This temperature variation can affect the readings of the electrical strain gauges (SG) installed on the steel bars embedded in the restrained specimen. This variation must be corrected during the test in order to ensure a precise determination of the total strain and a precise control of the degree of restraint during the experiment. To determine the true strain, one has to subtract the thermal output of the strain gauge (εto) from the strain reading (εrdg),
correct for the difference between the thermal expansion coefficients of concrete (αc) and steel
(αs), and add the thermal strain based on the temperature change (ΔT) measured in the concrete
after setting. After simplification, the true total strain measured by the strain gauges can be calculated by the following equation:
) ( ) ( ) ( ) (t rdg t to T s T t tot =ε −ε +α Δ ε (7)
The thermal output of the strain gauges should be carefully determined in an environmental chamber, in which strain gauges mounted on unrestrained reinforcing steel bars are subjected to a given range of temperatures (T), say from 10°C to 50°C. In cases where displacements are
measured with sensors located outside the concrete specimen (as in the unrestrained specimen), these temperature corrections are not absolutely necessary, provided that the ambient room temperature near the sensors remains constant during the test.
Relative humidity readings – Temperature can influence the readings of relative humidity (RH) sensors. In order to remove this effect (especially during the heating and cooling periods), the following equation was used to normalize the RH readings to a reference temperature of 25°C [8]: ⎥ ⎥ ⎥ ⎥ ⎥ ⎦ ⎤ ⎢ ⎢ ⎢ ⎢ ⎢ ⎣ ⎡ − ⎟⎟ ⎠ ⎞ ⎜⎜ ⎝ ⎛ − ⎟ ⎠ ⎞ ⎜ ⎝ ⎛ = ) ( ) ( 1 298 1 100 ) ( ln ) ( exp ) ( ) ( 298 t T B A t T t RH t T A t RH t RH K (8)
where the parameters A (0.11784 N/m) and B (0.000154 N/m/K) define the surface tension of the pore water [8], and T is the concrete temperature in Kelvin near the RH sensors.
3.4. Temperature effects on concrete behaviour
Coefficient of thermal expansion – The measurement of shrinkage always includes the thermal strain component when testing under semi-adiabatic conditions, which makes it difficult to evaluate the true shrinkage of the concrete under investigation. In order to remove the thermal strain from the total strain measured in concrete, the coefficient of thermal expansion (CTE) of concrete was used to calculate the thermal strain component. The influence of moisture in concrete on thermal expansion is considerable, especially at early-age with the rapid changes in the kinetics of the concrete constituents during cement hydration. As a result, the CTE of concrete is not constant at very early age. Research on the time-evolution of CTE at early age, however, is rather limited [9] and no agreement exists on the test method to adopt.
The following paragraphs introduce the procedure used in this study to measure the coefficient of thermal expansion of concrete at very early age, with the assumption that thermal deformations are reversible. A group of three sealed concrete prisms (75x75x300mm) were tested
simultaneously in an environmental chamber using high-precision temperature-calibrated LVDTs with their pins firmly secured in fresh concrete through small openings in the ends of the steel moulds. The steel moulds were not taken apart during testing to allow the measurement of
displacement in very young concrete without disturbing the test conditions. The interior end sides of the steel moulds were lined with 1.5-mm thick layers of rubber foam to ensure free movement of the concrete, especially during the first heating phases of the test.
Temperature cycles ranging from 20°C to 30°C were performed for 7 days at the rate of 4 full
recommended to perform more than 4 full temperature cycles per day, since the temperature in
the concrete may not have enough time to stabilize and become uniform in the cross-sections of the specimens. More recent work [10] showed that accurate measurements of CTE can be obtained using a reduced temperature range of 25°C to 30°C and 6 full cycles per day for the same specimen size of 75x75x300mm.
As illustrated in Fig. 3, the measured shrinkage strain (averaged from the three specimens) is the sum of 2 separable components: the shrinkage strain determined by averaging the peak values of each temperature cycle, and the thermal strain obtained by subtraction. It is noted that the
shrinkage values measured on these specimens cannot be directly compared to shrinkage values measured on other concrete specimens of different sizes and curing/thermal conditions.
The temperature was monitored in each concrete specimen and was used to calculate the thermal expansion coefficient as a function of time with the following equation:
) ( ) ( ) ( t T t t th c Δ Δ = ε α (9)
Figure 4 presents the coefficient of thermal expansion obtained for the concrete as a function of time after casting. An initial value of 7.3 με/°C was found shortly after the setting time and increased linearly for approximately one day until an ultimate value of 10.5 με/°C was reached. This increase in the concrete CTE at the very early-age may be due to several factors including self-desiccation (hindering free exchange of moisture in the capillary pores).
A recent study [11] reported that the CTE of concrete at very early age decreased sharply from high values in fresh concrete down to low values (below 10 με/°C) some time after setting,
followed by a gradual increase up to a constant value (near 10 με/°C) one day later. This is in agreement with the results presented in Fig. 4, except that the proposed method cannot measure the initial value of CTE in fresh concrete. It is clear, though, that the use of a constant CTE of 10 με/°C from the setting time to a later age (as often done in practice) would result in an inaccurate estimation of the true thermal and shrinkage strains of concrete at very early age.
Maturity – Temperature has a direct impact on the degree of hydration and the development of mechanical properties of concrete. Since significant heat is produced during the curing of large HPC specimens, mechanical properties may develop at different rates, according to their
temperature sensitivities and the temperature variations experienced during testing. In such tests, especially when some measurements are made on specimens of different sizes (thus having different temperature histories), the time scale used for each measured property needs to be normalised for comparison purposes by the use of the maturity concept [12]. This concept assumes that two concrete specimens of identical formulations under different temperature histories will have the same values of a given mechanical property for a given maturity. Recent work [13] demonstrated that the thermo-visco-elastic behaviour of early-age concrete can be modelled adequately by the maturity concept. The maturity concept using the Arrhenius law as the temperature function was shown to be equivalent to the degree of hydration method based on a temperature-independent relation between strength development and degree of hydration.
The following equation was used to transform the time scale into a maturity scale, M(t), which is also known as the equivalent age calculated for a given reference temperature:
dt t T T R E t M t ref a ∫ ⎥ ⎥ ⎦ ⎤ ⎢ ⎢ ⎣ ⎡ ⎟⎟ ⎠ ⎞ ⎜⎜ ⎝ ⎛ + − + = 0 273 ( ) 1 273 1 exp ) ( (10)
where Ea/R is the activation energy factor of the concrete, and Tref is the reference temperature
(taken here as 25°C). This is somewhat equivalent to testing the concrete specimens under isothermal conditions at a temperature of 25°C. For the analysis presented in this paper, an activation energy factor of 4000 Kelvin was selected for this particular concrete, based on actual test results [14] and recommendations from current design codes on maturity calculations [15,16].
3.5. Stress calculation procedure
In the restrained shrinkage test apparatus (Fig. 1), the load is transmitted from a rigid test frame to the concrete specimen by 4 continuous 10-mm reinforcing bars embedded in concrete. Other load-transfer methods [2,3] (such as pulling directly on a plain concrete specimen with dovetail ends; or pulling on steel anchors embedded in the ends of a plain concrete specimen) were tried and found unsatisfactory for the large specimen size used in this study. The main problem was that the application of the axial load was not as smooth and gradual as required, and resulted in unstable load control and unexpected premature failure of the concrete specimens.
When a restrained steel-reinforced concrete specimen is subjected to a tensile force (P), the strains in the reinforcing steel (εs) and concrete (εc) are:
) ( ) ( ) ( ) ( T t A E t P t R t s s s s + Δ + = α ε (11) ) ( ) ( ) ( ) ( ) ( ) ( t T t t A t E t R t c sh c c c α ε ε = − + Δ + (12)
where R is the internal reaction in the specimen; Es and As are the elastic modulus and
cross-sectional area of the concrete, respectively. Assuming compatibility of strains between the steel reinforcement and concrete, the stress in concrete (σc) was calculated as follows:
c s s tot s s s c A A E t t P A E t T t) ( ) ( ) ( ) ( α ε σ = Δ + − (13)
As shrinkage develops, the reinforcing bars in the restrained specimen produce a small restraint in the concrete specimen that needs to be accounted for in the calculations. This restraint was determined by the following equation:
) ( ) ( t E A E A E A t k c c s s s s s = + (14)
Since no reinforcement was used in the unrestrained companion specimen, Eq. 1 should be corrected by multiplying the values of [εsh+εth] by (1-ks), otherwise the creep strain in the
restrained specimen would be slightly underestimated.
4. Experimental program 4.1. Concrete materials
The concrete selected for this study was made of ASTM Type I cement, with a cement-sand-coarse aggregate ratio of 1:2:2 by mass, and a water-cement ratio of 0.34. Table 1 provides the concrete mix design, along with the resulting slump, air content, and 7-day compressive strength (50 MPa). The quantities shown in the table represent the amount of concrete required to make two large-size specimens for the restrained and free shrinkage testing, and a number of small concrete samples for testing other mechanical properties, such as compressive strength, tensile strength, and coefficient of thermal expansion.
The concrete was prepared in a portable tumble concrete mixer with a 170-liter dry-batch
capacity, and placed in wooden forms using a needle-type vibrator. The forms were not removed during the testing to simulate field conditions at early age, to avoid disturbing the sensors, and to prevent thermal shock. In order to prevent friction between the concrete specimens and the forms, two layers of plastic sheets were used to line each side of the forms. Small concrete samples for secondary testing were placed in moulds and consolidated on a vibrating table. All concrete specimens were sealed with plastic sheets to prevent external drying shrinkage, and their temperature was monitored.
4.2. Experimental apparatus and procedures
As shown in Fig. 1, the restrained specimen had a rigid connection at one end and a pinned connection at the actuator end. Four 10-mm reinforcing bars were embedded in the restrained specimen with a concrete cover thickness of 50 mm, which was 2.5 times the maximum aggregate size to prevent placement problems. The axial strain was measured with electrical strain gauges placed at the centre of the 4 reinforcing bars. Preliminary testing on restrained concrete specimens indicated that the use of strain gauges mounted on longitudinal rebars was more reliable than other methods for the stability of the readings in very young concrete (e.g. settlement problems). The test apparatus included a closed loop servo hydraulic system to control the actuator, using the rebar-mounted strain gauges as the feedback signal for the control loop. The force developing in the restrained specimen was measured by a load cell installed between the actuator and the specimen in the test frame. The concrete temperature was measured on each rebar at mid-length (see Fig. 1). This temperature was assumed to be uniform in the longitudinal direction over the central portion of the specimen where the strain gauges were embedded.
The unrestrained companion specimen, which was prepared in parallel to the restrained specimen, was of the same size and concrete formulation but did not include reinforcing bars. The free shrinkage was measured axially with two external high-precision LVDTs with their pins firmly secured in concrete through small openings made in the form at the ends of the specimen (Fig. 1). Two RH sensors were placed vertically in the unrestrained specimen with their heads located at mid-height for the assessment of internal drying in concrete due to self-desiccation. To avoid failure of the RH sensors due to excessive condensation on their heads, the sensors were inserted into plastic sleeves firmly attached to the form eight hours after concrete placement. Embedded thermocouples (TC) were distributed in the central cross-section of the specimen, as illustrated in Fig. 1.
The readings from the sensors were recorded by a data logging system at 15-minute intervals for at least 7 days. When partial unload/reload cycles were performed (for the determination of the elastic modulus), readings were taken at 15-second intervals. During such cycles, the restrained specimen was unloaded to 60% of the current load and fully reloaded at a rate of 1 kN/sec. The first cycle was performed 24 hours after casting and subsequent cycles at a rate of 1 or 2 cycles per day, especially at early age. In such a restrained shrinkage test, the use of full unload/reload cycles (i.e. unloading to 0 kN) is not recommended, as it may weaken the specimen.
During such experiment, several tests were performed simultaneously in order to gather all the data needed for the analysis of the thermo-mechanical behaviour of the concrete specimen under restrained shrinkage. Table 2 provides a summary of these tests, including the size and number of specimens used.
5. Results and analyses
5.1. Hygro-thermal conditions
The free and restrained specimens were tested under realistic temperature conditions (i.e. semi-adiabatic conditions). Figure 5 presents the average temperature and the average RH measured in the concrete specimens over time after casting. The concrete reached an average peak
temperature of 41°C at about 18 hours after casting and cooled down to the ambient lab temperature after 2 days. The temperature difference between the core and the surface of the specimens during the heating/cooling period never exceeded 4°C (not shown in the figure). The relative humidity reduced rapidly from 100% in the fresh concrete to 94% after two days, and down to below 92% at 7 days. This reduction in concrete RH is attributed to self-desiccation, typical of HPC with a low w/c. This rapid decrease in RH combined with a sharp decrease in temperature at very early age can produce significant tensile stresses in the concrete if the resulting contraction is restrained in the structure.
The temperature data shown in Fig. 5 and the procedure illustrated in Fig. 2 were used to determine Time Zero at a value of 10 hours after casting. The concept of maturity, as described earlier, was used in the calculations with a reference temperature of 25°C.
5.2. Free shrinkage testing
Figure 6 shows the total strain measured in the unrestrained specimen (i.e. shrinkage and thermal strains combined), the calculated thermal strain, and the resulting autogenous shrinkage strain as
functions of maturity. It can be seen that the autogenous shrinkage curve presents a sharp
decrease, down to an ultimate value of −260 με after only one day. This observation suggests that the effective prevention of autogenous shrinkage in HPC structures must involve measures that are effective shortly after setting of concrete.
Figure 6 also shows that after one day, no significant additional autogenous shrinkage strain was observed. This fact illustrates the importance of measuring autogenous shrinkage from the setting time, especially for concretes with low water-cement ratios [17]. For instance, the ASTM
Standard C157 for the measurement of free shrinkage recommends taking the first reference reading after a humid cure of 24 hours. In this case, the autogenous portion of the measured shrinkage would be underestimated by about –260 με for the concrete used in this study. As it will be shown later, this amount of shrinkage is sufficient to produce failure of the concrete specimen after 1.5 days if its movement was fully restrained.
5.3. Restrained shrinkage testing
Figure 7 presents the degree of restraint imposed on the restrained shrinkage specimen during testing. The target degree of restraint selected for this experiment was 0.9 in order to prevent the failure of the specimen at very early age. The small restraint (ks) from the reinforcing bars is also
shown in the figure. With a total steel area of 400 mm2 and a concrete cross-sectional area of
39600 mm2 in the restrained specimen, it is shown that ks stabilized at a value of 0.06 very shortly
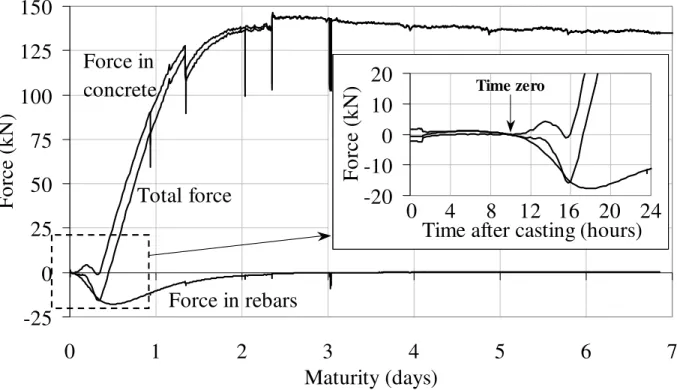
Figure 8 compares the axial force applied on the cross-section of the restrained specimen and the axial forces calculated for the concrete and the steel reinforcement alone. It can be seen that the force in the steel reinforcement became negligible after 2 days, which corresponded to the time at which the total shrinkage strain stopped increasing significantly (Fig. 6). The insert in Fig. 8 illustrates the same forces over time for the first 24 hours after casting. It can be seen that Time Zero, as defined earlier, corresponds exactly to the time at which the forces in the concrete and steel started to develop (in opposite directions).
Figure 9 shows the direct tensile stress developed in the restrained specimen due to the combined effects of restrained shrinkage and tensile relaxation. It can be seen that the specimen did not fail during testing due to the partial degree of restraint selected for this test (K~0.9). A second stress curve is displayed, which represents the normalized tensile stress for a degree of restraint of 1.0 (taken as the stress divided by the degree of restraint). This normalization of the tensile stress can be validated by rearranging Equations 1 to 4 and solving for the tensile stress:
[
]
) ( 1 ) ( ) ( ) ( ) ( ) ( t t t t E t K t c sh th c φ ε ε σ + + − = (15)which shows that the concrete stress in the specimen is proportional to the degree of restraint.
The stress curves are compared to the strength curve, which was determined by regression analysis of the results obtained from the splitting tensile strength tests performed on 100x200mm cylinders at different times. Reduction factors to account for the size difference between the specimens and cylinders and the difference in the mechanisms between direct and splitting tensile strengths were not used. It is shown that the concrete specimen would have cracked at 1.5 days if
the degree of restraint used in the experiment had been 1.0. As expected, the predicted failure under full restraint occurred at a time when both the rates of internal drying and cooling were the most severe in the restrained specimen (Fig. 5), thus resulting in a high risk of cracking.
Figure 10 presents the total strain along with the elastic and creep strains that developed in the restrained concrete specimen. The total strain in the restrained specimen was not zero, as opposed to conventional restrained shrinkage testing, for which a degree of restraint of 1.0 is normally used. As explained earlier, approximately 10% of the total strain was released in the restrained specimen in order to achieve a partial degree of restraint near 0.9. Note that the discontinuities in the total strain curve were caused by the manual unload/reload cycles. Figure 10 also indicates that the tensile creep strain increased rapidly in the first two days, and reached a strain of 150 με at 7 days. This rapid increase in creep strain at early age was beneficial as it reduced the tensile stress from the restrained autogenous shrinkage, which was also found to develop rapidly at early age.
Figure 11 shows the creep coefficient and the specific creep that developed in the restrained specimen. At seven days, these parameters reached values of 1.2 and 40 με/MPa, respectively, and were still increasing. This shows that stress relaxation reduced the tensile stress in the concrete by a factor of 2.2 at 7 days (i.e. φ+1). At 1.5 days, however, the stress relaxation would not have been sufficient to prevent failure of the specimen, had it been tested under full restraint (K=1.0), as predicted in Fig. 9.
Finally, the effective tensile modulus of elasticity obtained for the concrete of the restrained specimen is shown in Fig. 12 with a 7-day value of 15000 MPa. The best-fit curve for the corresponding instantaneous tensile modulus of elasticity is also shown. This curve was determined by regression analysis of the strain and stress data obtained during periodic unload/reload cycles on the restrained specimen. It is also found that the 7-day instantaneous modulus of elasticity measured on the restrained concrete specimen in tension (32900 MPa) was very close to that measured on the concrete cylinders tested in compression (31600 MPa).
6. Summary and conclusions
A complete testing and analysis approach is proposed to study the thermo-mechanical behaviour of large-size high-performance concrete specimens under restrained autogenous shrinkage and realistic temperature conditions. The loading system can apply a partial degree of restraint to enable the characterisation of high-performance concrete (HPC) specimens without premature termination of the test. The instrumentation system can measure the strains and other parameters from setting time with high accuracy and reliability. The analysis method takes into account the temperature effects on the measured properties and provides equations to determine Time Zero and the development of shrinkage, thermal expansion, stiffness and creep of concrete.
Results from tests on 200x200x1000 mm specimens made with high-performance concrete (w/c = 0.34; f'c = 50 MPa at 7 days) were presented in the paper to demonstrate the application of the
proposed approach. For this particular HPC, the following conclusions can be drawn on the early-age thermo-mechanical behaviour of the HPC specimens using the proposed approach:
1. Internal drying (or self-dessication) of the concrete was pronounced at very early age, with the RH decreasing to values below 94% in 2 days. This internal drying, combined with the sharp temperature decrease during the cooling period, increased considerably the risk of cracking, which was estimated to be highest at the age of 1.5 days.
2. The onset of stress development in the concrete specimen under restrained condition corresponded to the proposed definition of Time Zero, which was clearly identified by the onset of a sharp increase in the rate of temperature monitored in the concrete specimen. 3. The coefficient of thermal expansion was not constant at very early-age, as it was found to
increase from 7.3 με/°C, one day after casting, to 10.5 με/°C, one day later, and remained constant thereafter. The characterization of the concrete CTE enabled an accurate
determination of the autogenous shrinkage from the measured strain values.
4. The autogenous shrinkage strain reached a value of –260 με in only one day. Consequently, measures for the prevention of autogenous shrinkage cracking in HPC structures must involve mechanisms that are effective shortly after the setting of concrete.
5. After one day, no significant additional autogenous shrinkage was found, stressing the importance of measuring autogenous shrinkage of HPC from the setting of concrete as opposed to 24 hours after casting as suggested in the ASTM C157 Standard for shrinkage measurement.
6. The creep strain was also found to develop rapidly at very early age with a value of 100 με after 2 days, and 150 με at 7 days. Due to creep, the tensile stresses caused by restrained shrinkage were reduced by a factor of two approximately, so was the effective modulus of elasticity (15 GPa) compared to the instantaneous modulus (33 GPa) at 7 days.
7. It was predicted that restrained shrinkage of specimens made with such HPC would fail prematurely at the age of 1.5 days under full restraint if no shrinkage-compensating measures were taken. In this case, stress relaxation due to creep could not overcome the rapidly
increasing shrinkage-induced tensile stress at early age under full restraint.
Acknowledgments
The authors would like to thank Mr. Glendon Pye of NRC for his valuable technical assistance.
References
[1] Bjontegaard, O., Sellevold, E.J., “Autogenous and thermal deformations”, in Early Age
Cracking in Cementitious Systems, Report of RILEM Committee TC 181-EAS, Editor: A.
Bentur, RILEM Publications Sarl, Bagneux, France, 2002, pp. 65-88.
[2] Bentur, A., “Early age cracking tests”, in Early Age Cracking in Cementitious Systems,
Report of RILEM Committee TC 181-EAS, Editor: A. Bentur, RILEM Publications Sarl,
Bagneux, France, 2002, pp. 241-255.
[3] Hansen, W., “Early age creep and stress relaxation tests”, in Early Age Cracking in
Cementitious Systems, Report of RILEM Committee TC 181-EAS, Editor: A. Bentur, RILEM
Publications Sarl, Bagneux, France, 2002, pp. 257-265.
[4] Kovler, K., “Testing system for determining the mechanical behaviour of early-age concrete under restrained and free uniaxial shrinkage”, Materials & Structures, 27, 1994, pp. 324-330.
[5] Weiss, J., “Experimental determination of the time-zero (maturity-zero)”, in Early Age
Cracking in Cementitious Systems, Report of RILEM Committee TC 181-EAS, Editor: A.
Bentur, RILEM Publications Sarl, Bagneux, France, 2002, pp. 195-206.
[6] JCI Committee on Autogenous Shrinkage of Concrete, “Committee Report on Autogenous Shrinkage of Concrete”, Japan Concrete Institute, Proceedings of the International Workshop on Autogenous Shrinkage of Concrete, Editor: E. Tazawa, Hiroshima, Japan, Publisher: Routledge, New-York, 1998, pp. 1-67.
[7] Mindess, S., Young, J.F., “Concrete”, Prentice-Hall, Englewood Cliffs, USA, 1981, 671 pp. [8] Pruckner, F., Gjorv, O.E., “Measurements of relative humidity in concrete”, 3rd International
Conference on Concrete Under Severe Conditions, Editors: N. Banthia, K. Sakai and O.E. Gjorv, University of British Columbia, Dept. of Civil Engineering, Vancouver, Canada, 2001, pp. 1489-1496.
[9] Boulay, C., “Determination of coefficient of thermal expansion”, in Early Age Cracking in
Cementitious Systems, Report of RILEM Committee TC 181-EAS, Editor: A. Bentur, RILEM
Publications Sarl, Bagneux, France, 2002, pp. 217-224.
[10] Cusson, D., Hoogeveen, T. “Measuring early-age coefficient of thermal expansion in high-performance concrete”, Intl RILEM Conference on Volume Changes of Hardening Concrete: Testing and Mitigation, Lyngby, Denmark, August 2006, pp. 321-330.
[11] Shimasaki, I., Rokugo, K., Morimoto, H. “On thermal expansion coefficient of concrete at very early ages”, International Workshop on Control of Cracking in Early-age Concrete, Sendai, Japan, August 2000, pp. 49-56.
[12] Saul, A. G. A., “Principles underlying the steam curing of concrete at atmosphere pressure”, Magazine of Concrete Research, 1 (2), 1949, pp. 79-88.
[13] De Schutter, G. “Applicability of degree of hydration concept and maturity method for thermo-visco-elastic behaviour of early age concrete”, Cement & Concrete Composites, Vol. 26, 2004, pp. 437-443.
[14] Zhang, J., Cusson, D., Mitchell, L., Hoogeveen, T., Margeson, J., “The maturity approach for predicting different properties of high-performance concrete”, 7th International
Symposium on Utilization of High-Strength/High-Performance Concrete, Washington, USA, ACI SP 228-11, 1, June 20-24, 2005, pp. 135-154.
[15] CEB, “CEB-FIP Model Code 1990”, Information Bulletin No. 213/214, Euro-International Concrete Committee, Lausanne, Switzerland, 1993, 437 p.
[16] ACI Committee 209, “Prediction of Creep, Shrinkage and Temperature Effects in Concrete Structures (209R-92, Re-approved 1997)”, ACI, Farmington Hills, USA, 1997, 47 p. [17] Aitcin, P.C., “Autogenous shrinkage measurement”, Proceedings of the International
Workshop on Autogenous Shrinkage of Concrete, Editor: E. Tazawa, Hiroshima, Japan, Publisher: Routledge, New-York, 1998, pp. 245-256.
Table 1 – Concrete mix design (w/c=0.34)
Constituent Quantity
Water
Cement (ASTM type I) Dry sand (max. 5 mm)
Table 2 – Series of tests conducted simultaneously Test Description Number of
specimens Dimensions (mm) Test age (day) Restrained shrinkage
(incl. tensile elastic modulus)
1 200x200x1000 Continuous
Free shrinkage (large scale) 1 200x200x1000 Continuous
Free shrinkage (small scale) 3 75x75x300 Continuous
Thermal expansion 3 75x75x300 Continuous
Splitting tensile strength 15 100x200 (cyl.) 1, 2, 4, 7, 28
Compressive strength & modulus of elasticity
6 100x200 (cyl.) 7, 28
Note: Preliminary tests on instrumented bars were conducted: (i) in environmental chamber for temperature calibration, and (ii) in test frame for ensuring concentricity of axial loading.
Dry coarse aggregate (max. 20 mm) Superplasticizer (solid) 21.3 kg 62.5 kg 125.0 kg 125.0 kg 2.1 kg Slump Air content 215 mm 4 % f’c at 7 days 50 MPa
-4
-2
0
2
4
6
0
4
8
12
16
20
24
28
32
36
Time after casting (hours)
T
emp
erat
u
re rat
e (°
C/
h
o
u
r)
20
25
30
35
40
45
T
emp
erat
u
re (°
C)
Rate of
temperature
Time Zero
Temperature
Fig. 2. Determination of Time Zero from temperature measured in concrete specimen
-600
-400
-200
0
200
0
1
2
3
4
5
6
7
Time after casting (days)
St
rai
n
(
με
)
Thermal strain
Total strain
(as measured)
Shrinkage strain
Temp. cycles: 10°C-30°C
7
8
9
10
11
0
1
2
3
4
5
6
7
Time after casting (days)
Coe ff . of t h e rm a l e xpa ns io n
(μ
ε/
°C
)
Average of
three prisms
Fig. 4. Measured coefficient of thermal expansion of concrete
20
25
30
35
40
45
0
1
2
3
4
5
6
7
Time after casting (days)
T
emp
erat
u
re (°
C)
90
92
94
96
98
100
R
ela
tive
hum
idity (
%
)
.
Concrete relative humidity
Ambient lab temperature
Mean concrete temperature
-300
-200
-100
0
100
200
0
1
2
3
4
5
6
7
Maturity (days)
St
rai
n
(
με
)
Thermal strain
Total strain (as measured)
Autogenous shrinkage strain
Fig. 6. Axial strains in unrestrained concrete specimen
0.0
0.2
0.4
0.6
0.8
1.0
0
1
2
3
4
5
6
7
Maturity (days)
De
gr
ee
of
r
estr
aint
Total restraint
(from actuator and rebars)
Partial restraint
(from rebars only)
Partial unload/reload cycles
(to calculate elastic modulus)
Temporary release due
to thermal expansion
-25
0
25
50
75
100
125
150
0
1
2
3
4
5
6
7
Maturity (days)
Fo
rce (k
N
)
Total force
Force in rebars
Force in
concrete
-20
-10
0
10
20
Time after casting (hours)
Fo
rce (k
N
)
0 4
8 12 16
20
24
Time zeroFig. 8. Axial forces in restrained specimen
0
1
2
3
4
5
0
1
2
3
4
5
6
7
Maturity (days)
St
re
ss
(
M
Pa
)
Tensile strength (f
t)
Concrete stress:
- as measured (K~0.9)
- as predicted for K=1
Predicted failure
⎥ ⎦ ⎤ ⎢ ⎣ ⎡ ⎟ ⎠ ⎞ ⎜ ⎝ ⎛ − = t days f t f t ( ) t ( 7 days) exp 0 .034 1 7-50
0
50
100
150
0
1
2
3
4
5
6
7
Maturity (days)
St
rai
n
(
με
)
Elastic strain
Creep strain
Total strain
Fig. 10. Axial strains in restrained concrete specimen