The Biogeochemistry of Marine Nitrous Oxide
By
Caitlin Frame B.A. Harvard University, 2004
Submitted in partial fulfillment of the requirements for the degree of Doctor of Philosophy
at the
Massachusetts Institute of Technology and the
Woods Hole Oceanographic Institution June 2011
0
Caitlin FrameAll rights reserved
The author hereby grants to MIT and WHOI permission to reproduce and to distribute publicly paper and electronic
copies of this thesis document in whole or in part in any medium now known or hereafter crafted.
ARCHIVES
MASSACHUSETS INSTITUTE OF TECHNOLOGYOCT 2
5
2011
LIBRARIES
Signature of Author
Joint Program in Oceanography/Applied Ocean Science and Engineering Massachusetts Institute of Techology
and Woods Hole Oceanographic Institution March 112011
Certified by
Dr. Kae Casciotti Thesis Surpervisor Dr. Mark Kurz n Supervisor Accepted by Dr. Rog SummonsChair, Joint Committee for Chemical Oceanography Massachusetts Institute of Technology
THE BIOGEOCHEMISTRY OF MARINE NITROUS OXIDE
BY CAITLIN H FRAME
Submitted to the Department of Marine Chemistry and Geochemistry, Massachusetts Institute of Technology-Woods Hole Oceanographic Institution Joint Program in
Chemical Oceanography on March 15, 2011
In partial fulfillment of the requirements for the degree of Doctor of Philosophy
Abstract
Atmospheric nitrous oxide N20 concentrations have been rising steadily for the past century
as a result of human activities. In particular, human perturbation of the nitrogen cycle has increased the N20 production rates of the two major sources of this greenhouse gas, soil and
the ocean. Nitrification, and particularly ammonia oxidation, is one of the major processes that produces N20 in the ocean. In this thesis, a series of stable isotopic methods have been
used to characterize the biogeochemical controls on N20 production by marine nitrification
as well as the natural abundance stable isotopic signatures of N20 produced by marine
nitrifiers. This thesis shows that in addition to chemical controls on N20 production rates
such as oxygen (02) and nitrite (NO2 ) concentrations, there are also biological controls such as nitrifier cell abundances and coastal phytoplankton blooms that may influence N20
production by ammonia oxidizers as well. Ammonia oxidizers can produce N20 through
two separate biochemical mechanisms that have unique isotopic signatures. Using culture-based measurements of these signatures, we conclude that one of these pathways, nitrifier-denitrification, may be a significant source of N20 produced in the South Atlantic Ocean
and possibly the global ocean.
Thesis Supervisor: Dr. Karen Casciotti
Acknowledgements
I would like to acknowledge and thank my advisor, who continually dedicates herself to her students. She has been an amazing role model as a scientist and a human being. Very few days went by at WHOI when I didn't think about how lucky I was to have wandered into her lab five years ago. The Casciotti lab group-Matt Mcilvin, Carly Buchwald, Dan Rogers, Erin Banning, Alyson Santoro, and Ed Leadbetter-was a particularly creative and friendly group of people to work with, and their varied scientific expertise was always on hand and cheerfully given.
I am awed to have had such standout scientists on my committee. I'd like to thank them
all for their time and help completing this work. Victoria Orphan provided me with an opportunity to work with her fantastic lab group, especially Abbie Green, out at Caltech. Anton Post provided kind advice and molecular expertise that carried into the Caltech project. Dave Glover was instrumental in much of the data analysis and modeling used in this thesis and was a continuous source of free flowing ideas and inspiration. Penny Chisholm provided her extensive biological and culturing expertise. Mark Kurz stepped in as co-advisor at the end of my time at WHOI.
I would also like to thank my mother and father for their steadfast love and support. I'm
sure I couldn't have done it without them, or without my friends, both in Woods Hole and scattered around the country and the globe. Dad, Hui, and Sylvie thanks especially for the
late night pep talks towards the end. Funding for this work was provided by...
My time at WHOI was funded by the Academic Programs office at WHOI, as well as a
National Science Foundation Graduate Research Fellowship and a National Defense Science and Engineering Grant.
Thesis Supervisor: Dr. Karen Casciotti Assistant Professor, Stanford University
TABLE OF CONTENTS
0.1. Abstract. 3
0.2. Acknowledgements. 5
1. INTRODUCTION: NITROUS OXIDE IN THE OCEAN
1.1. Introduction. 11
1.2. Overview. 14
1.3. References. 16
1.4. Figures. 20
2. BIOGEOCHEMICAL CONTROLS AND ISOTOPIC SIGNATURES OF NITROUS OXIDE PRODUCTION BY A MARINE AMMONIA OXIDIZING BACTERIUM
2.1. Abstract. 23 2.2. Introduction. 23
2.3. Materials and Methods. 25
2.4. Results and Discussion. 27
2.5. Conclusions. 33 2.6. Appendix A. 33 2.7. Appendix B. 34 2.8. Acknowledgments. 35 2.9. References. 35 2.10. Supplementary Material. 39
3. NITROUS OXIDE PRODUCTION BY NITRIFICATION DURING A COASTAL PHYTOPLANKTON BLOOM
3.1. Abstract. 51 3.2. Introduction. 51
3.3. Materials and Methods. 53
3.5. Discussion. 61 3.6. Conclusions. 65 3.7. Acknowledgments. 65 3.8. Appendix A. 65 3.9. Appendix B. 66 3.10. Appendix C. 67 3.11. References. 68 3.12. Figures. 73
4. NITROUS OXIDE PRODUCTION AND TRANSPORT IN THE SOUTH ATLANTIC OCEAN
4.1. Abstract. 91 4.2. Introduction. 92
4.3. Materials and Methods. 96 4.4. Results and Discussion. 97 4.5. Conclusions. 113 4.6. Acknowledgments. 113 4.7. References. 113 4.8. Figures. 122 4.9. Tables. 137 5. CONCLUSIONS 5.1. Summary. 143 5.2. Outlook. 145 5.3. References. 147
1. INTRODUCTION
Nitrous oxide (N20) is the third most important greenhouse gas in terms of anthropogenic
climate forcing (Solomon et al., 2007). Human activities have increased the flux of N20
from the earth's surface by 40-50% since the industrial revolution (Hirsch et al., 2006), so that at 322 ppb, its current atmospheric concentration is 17% higher than the preindustrial concentration (Sowers et al., 2002; Prinn et al., 1990). Accelerating rates of microbial nitrogen cycling driven by agricultural use of nitrogen fertilizer have probably fed rising
N20 concentrations. Biomass burning, cattle farms, and fossil fuel combustion also make
smaller contributions to the atmospheric N20 budget (Solomon et al., 2007; Galloway
et al., 2004). In the atmosphere, N20 has a 120 year life span before reactions in the
stratosphere destroy it (Prinn et al., 1990; Volk et al., 1997). These reactions include photolytic and photo-oxidation processes that also destroy ozone (03), increasing the earth surface's exposure to ultraviolet radiation (Crutzen, 1970; Johnston, 1971). With the phase out of industrially manufactured 03-depleting substances, N20 is now ranked as the most
important 03 depleting substance in the atmosphere (Ravishankara et al., 2009).
The oceans are an important source of N20, contributing up to 25% of global
emis-sions (Nevison et al., 2004; Solomon et al., 2007). Marine N20 is produced by cycling of
the ocean's natural or baseline nitrogen inventory as well as growing amounts of nitrogen supplied to the ocean by human activities. Several microbial processes are involved in
N20 cycling. In oxic thermocline waters, nitrifying microorganisms are thought to produce N20, while in suboxic and anoxic waters, denitrification can both produce and consume N20 (Cohen and Gordon, 1978; Naqvi et al., 2009). Nitrification is the sequential
con-version of ammonia (NH3) to nitrite (N02) and then nitrate (N0 ). This 02 dependent
two-step process is carried out by distinct groups of chemolithoautotrophic microorganisms: ammonia-oxidizing bacteria and archaea convert NH3 to N02 and nitrite oxidizing bacteria
convert N02 to N03 (Martens-Habbena et al., 2009; Ward and O'Mullan, 2005). N20 is
a byproduct of ammonia oxidation, the first nitrification step. In contrast, denitrification is an anaerobic heterotrophic process that reduces N03 to dinitrogen N2 during organic
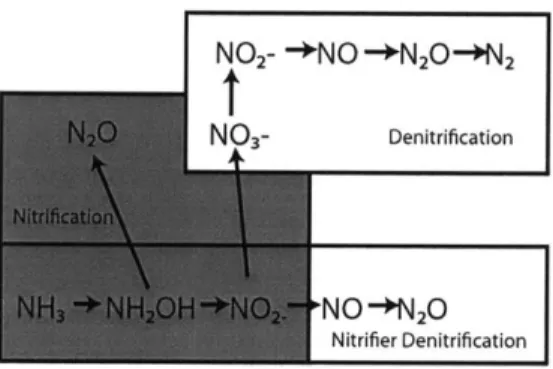
carbon respiration. The enzyme-mediated steps of this process reduce NO to N02, nitric oxide (NO), N20, and then N2 (Figure 1).
Marine N20 was originally attributed to nitrification or denitrification based on where
its distributions were in relation to maxima and minima in 02, NO, and N03 concen-tration profiles. In aging, oxic water masses, decreasing 02 concenconcen-trations and increasing
N03 concentrations are usually associated with increasing N20 concentrations,
produc-ing especially tight linear correlations between N20 and 02 and implicating nitrification
as the source of most marine N20 (Elkins et al., 1978; Oudot et al., 1990; Naqvi and
Noronha, 1991; Yoshinari, 1976; Nevison et al., 2003, 1995). However, in low 02 (<5tM) environments, the linear relationship found in higher 02 waters breaks down as more N20
is produced relative to 02 consumption (Codispoti and Christensen, 1985). Two different phenomena may explain this nonlinearity. The first is the increased production of N20 by
nitrifiers under low 02 conditions (Goreau et al., 1980; Nevison et al., 2003). The second is denitrification interrupted by turbulent injections of 02 that disrupt the full denitrifi-cation sequence (Figure 1) and allow the intermediate, N20, to escape further reduction
(Firestone and Tiedje, 1979; Naqvi et al., 2000). There is also a sink for N20 in anoxic
waters such as those in the cores of the stable oxygen deficient zones (ODZs) in the East-ern Tropical North and South Pacific and the Arabian Sea where low N20 concentrations
are maintained, providing evidence that denitrification consumes N20 in addition to NO3
and N02 (Elkins et al., 1978; Cohen and Gordon, 1978; Naqvi and Noronha, 1991; Farias et al., 2009). Although N20 is destroyed in these core anoxic waters, the ODZs are still net
sources of N20 because of high production rates above and below their main anoxic zones
(Naqvi and Noronha, 1991).
Microbiological and enzymological research has provided a mechanistic understanding of how nitrification and denitrification produce N20 (Payne et al., 1971; Poth and Focht, 1985; Ritchie and Nicholas, 1972; Hooper and Terry, 1979). A fraction of the NH3 oxidized by ammonia oxidizers is released as N20 rather than N02 (Goreau et al., 1980; Ritchie
and Nicholas, 1972). The size of this fraction, or yield, is variable and understanding what controls it is a primary focus of marine N20 research. There are two pathways of N20
production in ammonia-oxidizing bacteria (Figure 1). The first occurs during the oxidation step, during which NH3 and 02 are converted to an intermediate, hydroxylamine (NH 2OH)
that is then oxidized to NO. This intermediate can also decompose to N20 through an
unknown mechanism (Hooper and Terry, 1979; Ritchie and Nicholas, 1972). The second pathway is known as nitrifier-denitrification, which reduces NO to nitric oxide (NO) and then N20 using enzymes that bear genetic similarity to those of certain denitrifiers (Poth
and Focht, 1985; Ritchie and Nicholas, 1972; Casciotti and Ward, 2001, 2005). It is un-certain whether there is an adaptive significance of nitrifier-denitrification. It is thought to occur preferentially at low 02 concentrations (Sutka et al., 2004) and in the presence of higher concentrations of NO (Beaumont et al., 2004). Some have proposed that when 02 is scarce, NO acts as an alternative terminal electron acceptor, as it does during deni-trification (Zumft, 1997). Others have concluded that the reaction is a means of removing accumulating NO, which can become toxic at high concentrations (Beaumont et al., 2004; Laanbroek et al., 2002; Ritchie and Nicholas, 1972). In either case, nitrifier-denitrification can significantly increase the amount of N20 produced by nitrifiers.
Low 02 environments such as coastal and continental shelf regions as well as the periferies of the ODZs are known to be large net sources of N20 to the atmosphere (Naqvi et al.,
2009). Although some of these suboxic regions occur naturally, several studies have noted that they are expanding and intensifying as a result of global climate change (Stramma et al., 2008). If these trends continue, marine emissions of N20 may rise substantially
(Codispoti, 2010). Low 02 environments are unique in that aerobic nitrification and anaer-obic denitrification may co-occur, leading to significant N20 production. Identifying their
individual contributions to the overall N20 source is a necessary step before quantitative
predictions can be made about the effects of eutrophication and expanding low 02 zones on marine N20 production. Stable isotopic measurements of N20 can provide a way to
distinguish between these two processes.
Measuring the amounts of the heavier stable isotopes (15N, 180, 170) relative to the
lighter stable isotopes (14N, 160) of nitrogen and oxygen in N20 provides a passive way
to track them through the various nitrogen cycle transformations linked to N20. During 13
these transformations, molecules that contain different isotopes of the same element react at slightly different rates. The rate differences impart characteristic isotopic signatures on
N20 molecules as they are produced or consumed. Kinetic fraction factors, designated ak,
are used to keep track of these differences. For example, ak = 14k/15k and '4k and 15k
are the respective rates of reaction of molecules containing the light and heavy nitrogen isotopes. When the kinetic fractionation factors are known for individual biological reac-tions they can be used to reconstruct or constrain the reaction's individual contribution to environmental N20 distributions. With the development of techniques for measuring
in-tramolecular nitrogen isotope distributions in N20 (Toyoda and Yoshida, 1999), isotopomer
ratios of N20 are also used to interpret how production and consumption processes shape
marine N20 distributions.
If the isotopic signatures of N20 from different environments (e.g. soil versus marine
versus combustion) are unique and well constrained, they can be used to construct global atmospheric isotope budgets. Such budgets are typically used as a way of accounting for all of the known sources and sinks contributing to the net flux of N20 into the atmosphere.
In the ocean, a similar approach may also be taken towards accounting for the relative contributions of different biological processes (e.g. nitrification and denitrification) to the marine N20 source. This thesis focuses on marine nitrification as a source of N20, a process
whose environmental rates are typically slow, have high spatial and temporal variability, and produce a low yield of N20. As discussed below, stable isotopic measurements are
particularly well suited to the study of this process because they are sensitive to low rates but can also integrate information about biological N20 production over large temporal
and spatial scales.
2. OVERVIEW
In the following three chapters, the stable isotopic composition of N20 is used to answer
three questions: how much marine N20 is being produced?, how it is being produced?, and
what environmental variables control the yield of N20? Stable isotopic methods provide
a way to specifically track certain processes and also to integrate the effects of multiple
processes occurring at the same time or in the same location. Different stable isotopic approaches have different strengths and weaknesses. Here, three separate stable isotopic approaches have been adopted to address the same three questions.
In Chapter 2, pure cultures of ammonia-oxidizing bacteria were used to study the effects of basic biogeochemical variables like 02 and N02 concentrations, and cell density on the yields and isotopic signatures of N20 that they produced. The advantage of culture based
studies is that they allow experimental control over the chemical and isotopic composition of the growth environment and culture conditions for a single species of N20 producing
organisms. The drawback of such studies are that organisms that can be obtained in pure cultures are often not representative of the diversity of nitrifiers found in natural communities and culturing conditions are usually enriched in substrate (NH3) relative to
concentrations found in the ocean. Nevertheless, these effects were reduced by working with a marine strain of ammonia oxidizer and using relatively low substrate concentrations.
In Chapter 3, the motivating questions were whether coastal nitrification rates and the yields of N20 from nitrification change as the overall productivity of the water increases.
Here, the sensitivity of 15N tracer-incubations was used to measure low in situ potential
nitrification rates and N20 production rates during a spring phytoplankton bloom in the
coastal waters off Cape Cod, Massachusetts. While this technique achieves specificity and sensitivity in the rate measurements, they are potentially influenced by "bottle effects" that cause naturally occurring biological assemblages to behave differently in an incubation environment than they would in their natural environment. Whenever possible, we made an effort to minimize these effects by using large incubation volumes and by keeping incubation periods short (12 and 24 hours). In highly productive natural waters, nutrient regeneration can also have a significant impact on nitrification rate calculations by changing the isotopic composition of the ammonium (NH+) pool over time. Here, the measurements necessary to correct this effect were made by adding NH+ above ambient concentrations, possibly perturbing actual process rates.
In Chapter 4, the natural abundance stable isotope signatures of N20 measured in the
South Atlantic were used to identify the microbial sources and the yields of N20 in this 15
region. While the process rates measured in the isotope tracer-incubations of Chapter 3 were subject to some experimental uncertainties and low spatial and temporal coverage, in Chapter 4 oceanographic isotopic measurements of dissolved N20 were collected with
high spatial resolution across the central South Atlantic. These data integrate the isotopic impacts of different biological and mixing processes, providing a more holistic view of what processes contribute to marine N20 production and where in the water column they occur.
The study region included the transition from the oligotrophic subtropical gyre to the low 02 upwelling zone off the coast of southwestern Africa allowing us an opportunity to investigate how natural gradients in productivity, 02, nutrients, and water mass distributions influence the concentration and isotopic compositions of dissolved N20.
Although different techniques are applied in each of the studies that follow, they target the same underlying question of what controls N20 production by marine nitrifiers. The
ultimate goal is to understand the present contribution of the ocean to the global N20 source
and how that contribution will change as human activities influence the climate and the marine nitrogen cycle. By pairing specific N20 production mechanisms with their isotopic
signatures as well as the chemical and biological variables that favor these mechanisms, we have expanded and refined the biogeochemical toolkit used to measure and model marine
N20 production.
REFERENCES
Beaumont, H. J. E., Lens, S., Reijnders, W. N. M., Westerhoff, H. V., and van Spanning, R. J. M. (2004). Expression of nitrite reductase in Nitrosomonas europaea involves nsrr, a novel nitrite-sensitive transcription repressor. Molecular Microbiology, 54(1):148-158. Casciotti, K. L. and Ward, B. B. (2001). Dissimilatory nitrite reductase genes from
autotrophic ammonia-oxidizing bacteria. Applied and Environmental Microbiology,
67(5):2213-2221.
Casciotti, K. L. and Ward, B. B. (2005). Phylogenetic analysis of nitric oxide reductase gene homologues from aerobic amrnonia-oxidizing bacteria. FEMS Microbiology Ecology,
Codispoti, L. A. (2010). Interesting times for marine N20. Science, 327:1339-1340.
Codispoti, L. A. and Christensen, J. P. (1985). Nitrification, denitrification and nitrous oxide cycling in the eastern tropic south pacific ocean. Marine Chemistry, 16:277-300. Cohen, Y. and Gordon, L. I. (1978). Nitrous oxide in the oxygen minimum of the eastern
tropical north pacific: evidence for its consumption during denitrification and possible mechanisms for its production. Deep-Sea Research, 25:509-524.
Crutzen, P. J. (1970). The influence of nitrogen oxides on the atmospheric ozone content.
Quarterly Journal Review of the Meteorological Society, 96:320-325.
Elkins, J. W., Wofsy, S., McElroy, M. B., Kolb, C. E., and Kaplan, W. A. (1978). Aquatic sources and sinks for nitrous oxide. Nature, 275:602-606.
Farias, L., Castro-Gonsalez, M., Cornejo, M., Charpentier, J., Faundez, J., Boontanon,
N., and Yoshida, N. (2009). Denitrification and nitrous oxide cycling within the upper
oxycline of the eastern tropical south pacific oxygen minimum zone. Limnology and
Oceanography, 54(1):132-144.
Firestone, M. K. and Tiedje, J. M. (1979). Temporal change in nitrous oxide and dini-trogen from denitrification following onset of anaerobiosis. Applied and Environmental
Microbiology, 38(4):673-679.
Galloway, J. N., Dentener, F. J., Capone, D. G., Boyer, E. W., Howarth, R. W., Seitzinger,
S. P., Asner, G. P., Cleveland, C. C., Green, P. A., Holland, E. A., Karl, D. M., Michaels, A. F., Porter, J. H., Townsend, A. R., and Vorosmarty, C. J. (2004). Nitrogen cycles:
past, present, and future. Biogeochemistry, 70:153-226.
Goreau, T. J., Kaplan, W. A., Wofsy, S. C., McElroy, M. B., Valois, F. W., and Watson,
S. W. (1980). Production of NO and N20 by nitrifying bacteria at reduced
concentra-tions of oxygen. Applied and Environmental Microbiology, 40(3):526-532.
Hirsch, A. I., Michalak, A. M., Bruhwiler, L. M., Peters, W., Dlugokencky, E. J., and Tans, P. P. (2006). Inverse modeling estimates of the global nitrous oxide surface flux from
1998-2001. Global Biogeochemical Cycles, 20(GB1008):doi:10.1029/2004GB002443.
Hooper, A. B. and Terry, K. R. (1979). Hydroxylamine oxidoreductase of Nitrosomonas production of nitric oxide from hydroxylamine. Biochimica et Biophysica Acta, 571:12-20.
Johnston, H. (1971). Reduction of stratospheric ozone by nitrogen oxide catalysts from supersonic transport exhaust. Science, 173(3996):517-522.
Laanbroek, H. J., Bar-Gilissen, M.-J., and Hoogveld, H. L. (2002). Nitrite as a stimulus for ammonia-starved Nitrosomonas europaea. Applied and Environmental Microbiology, 68(3):1454-1457.
Martens-Habbena, W., Berube, P. M., Urakawa, H., de la Torre, J. R., and Stahl, D. A.
(2009). Ammonia oxidation kinetics determine niche separation of nitrifying archaea and
bacteria. Nature, 461:976-981.
Naqvi, S. W. A., Bange, H. W., Farias, L., Monteiro, P. M. S., Scranton, M. I., and Zhang, J. (2009). Coastal hypoxia/anoxia as a source of CH4 and N20. Biogeosciences
Discussions, 6:9455-9523.
Naqvi, S. W. A., Jayakumar, D. A., Narvekar, P. V., Naik, H., Sarma, V. V. S. S., D'Souza,
W., Joseph, S., and George, M. D. (2000). Increased marine production of N20 due to
intensifying anoxia on the indian continental shelf. Nature, 408:346-349.
Naqvi, S. W. A. and Noronha, R. J. (1991). Nitrous oxide in the arabian sea. Deep-Sea
Research, 38(7):871-890.
Nevison, C., Butler, J. H., and Elkins, J. W. (2003). Global distribution of N20 and the
AN20 - aou yield in the subsurface ocean. Global Biogeochemical Cycles, 17(4):30-1-18.
Nevison, C. D., Lueker, T. J., and Weiss, R. F. (2004). Quantifying the nitrous oxide source from coastal upwelling. Global Biogeochemical Cycles,
18(GB1018):doi:10.1029/2003GB002110.
Nevison, C. D., Weiss, R. F., and Erickson III, D. J. (1995). Global oceanic emissions of nitrous oxide. Journal of Geophysical Research, 100(C8):15809-15820.
Oudot, C., Andrie, C., and Montel, Y. (1990). Nitrous oxide production in the tropical atlantic ocean. Deep-Sea Research, 37(2):183-202.
Payne, W. J., Riley, P. S., and Cox, C. D. J. (1971). Separate nitrite, nitric oxide, and nitrous oxide reducing fractions from Pseudomonas perfectomarinus. Journal of
Poth, M. and Focht, D. (1985). 15N kinetic analysis of N20 production by Nitrosomonas
europaea: an examination of nitrifier denitrification. Applied and Environmental Micro-biology, 49(5):1134-1141.
Prinn, R., Cunnold, D., Rasmussen, R., Simmonds, P., Alyea, F., Crawford, A., Fraser, P., and Rosen, R. (1990). Atmospheric emissions and trends of nitrous oxide deduced from
10 years of ALE - GAGE data. Journal of Geophysical Research, 95(D11):18369-18385.
Ravishankara, A. R., Daniel, J. S., and Portmann, R. W. (2009). Nitrous oxide (N20: the
dominant ozone-depleting substance emitted in the 21st century. Science, 326:123-125. Ritchie, G. A. F. and Nicholas, D. J. D. (1972). Identification of the sources of nitrous oxide
produced by oxidative and reductive processes in Nitrosomonas europaea. Biochemistry
Journal, 126:1181-1191.
Solomon, S., Qin, M., Manning, M., Chen, Z., Marquis, M., Averyt, K., Tignor, M., and Miller, H. (2007). Climate Change 2007: The Physical Science Basis. Cambridge University Press, New York, NY, USA.
Sowers, T., Rodebaugh, A., Yoshida, N., and Toyoda, S. (2002). Extending records of the isotopic composition of atmospheric N20 back to 1800 a.d. from air trapped in snow
at the south pole and the greenland ice sheet project ii ice core. Global Biogeochemical
Cycles, 16(4):doi:10.1029/2002GB001911.
Stramma, L., Johnson, G. C., Sprintall, J., and Mohrholz, V. (2008). Expanding oxygen-minimum zones in the tropical oceans. Science, 320:655-658.
Sutka, R. L., Ostrom, N. E., Ostrom, P. H., Gandhi, H., and Breznak, J. A. (2004). Nitrogen isotopomer site preference of N20 produced by Nitrosomonas europaea and Methylococcus
capsulatus bath. Rapid Communications in Mass Spectrometry, 18:1411-1412.
Toyoda, S. and Yoshida, N. (1999). Determination of nitrogen isotopomers of nitrous oxide on a modified isotope ratio mass spectrometer. Analytical Chemistry, 71:4711-4718. Volk, C. M., Elkins, J. W., Fahey, D. W., Dutton, G. S., Gilligan, J. M., Loewenstein, M.,
Podolske, J. R., Chan, K. R., and Gunson, M. R. (1997). Evaluation of source gas lifetimes from stratospheric observations. Journal of Geophysical Research, 102(D21):25543-25564.
Ward, B. B. and O'Mullan, G. D. (2005). Community level analysis: genetic and bio-geochemical approaches to investigate community composition and function in aerobic ammonia oxidation. Methods in Enzymology, 397:395-413.
Yoshinari, T. (1976). Nitrous oxide in the sea. Marine Chemistry, 4:189-202.
Zumft, W. G. (1997). Cell biology and molecular basis of denitrification. Microbiology and
molecular biology reviews, 61(4):533-616.
NO2--+NO+-)0N20-*N2 t
NO3- Denitrinication
NO -*N20 Nitrifier Denitrification
FIGURE 1. The steps in the nitrogen cycle that produce N20 are
nitrifi-cation, nitrifier-denitrifinitrifi-cation, and denitrification. Denitrification can also consume N20, converting it to N2
2. BIOGEOCHEMICAL CONTROLS AND ISOTOPIC SIGNATURES OF
NITROUS OXIDE PRODUCTION BY A MARINE
Biogeosciences, 7, 2695-2709, 2010 www.biogeosciences.net/7/2695/2010/ doi: 10.5194/bg-7-2695-2010
@ Author(s) 2010. CC Attribution 3.0 License.
Biogeosciences
Biogeochemical controls and isotopic signatures of nitrous oxide
production by a marine ammonia-oxidizing bacterium
C. H. Frame12 and K. L. Casciotti1
1 Marine Chemistry and Geochemistry, Woods Hole Oceanographic Institution, Woods Hole, Massachusetts, USA
2
Joint Program in Chemical Oceanography, MIT Woods Hole Oceanographic Institution, Woods Hole, Massachusetts, USA Received: 2 April 2010 - Published in Biogeosciences Discuss.: 27 April 2010
Revised: 30 July 2010 -Accepted: 10 August 2010 - Published: 13 September 2010
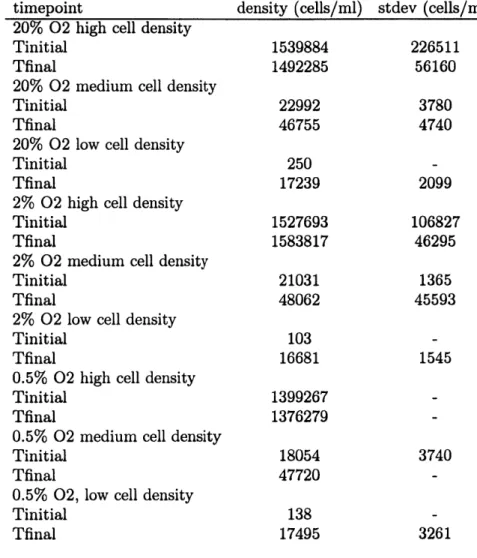
Abstract. Nitrous oxide (N20) is a trace gas that contributes to the greenhouse effect and stratospheric ozone depletion. The N20 yield from nitrification (moles N20-N produced per mole ammonium-N consumed) has been used to esti-mate marine N20 production rates from measured nitrifi-cation rates and global estimates of oceanic export produc-tion. However, the N20 yield from nitrification is not con-stant. Previous culture-based measurements indicate that N20 yield increases as oxygen (02) concentration decreases and as nitrite (N02 ) concentration increases. Here, we have measured yields of N20 from cultures of the marine 0-proteobacterium Nitrosomonas marina C- 11 3a as they grew on low-ammonium (50 pM) media. These yields, which were typically between 4 x 10⁻⁴ and 7x 10⁻⁴ for cultures with cell densities between 2x 10² and 2.1 x 10⁴ cells ml- , were lower than previous reports for ammonia-oxidizing bacte-ria. The observed impact of 02 concentration on yield was also smaller than previously reported under all conditions except at high starting cell densities (1.5 x 10⁶ cells ml- 1),
where 160-fold higher yields were observed at 0.5% 02 (5.1 pM dissolved 02) compared with 20% 02 (203pM dis-solved 02). At lower cell densities (2x 10² and 2.1 x 10⁴ cells ml 1), cultures grown under 0.5% 02 had yields that were only 1.25- to 1.73-fold higher than cultures grown un-der 20% 02. Thus, previously reported many-fold increases in N20 yield with dropping 02 could be reproduced only at cell densities that far exceeded those of ammonia oxidizers in the ocean. The presence of excess NO- (up to I mM) in the growth medium also increased N20 yields by an average of 70% to 87% depending on 02 concentration. We made stable
Correspondence to: C. H. Frame
(cframe@whoi.edu)
isotopic measurements on N20 from these cultures to iden-tify the biochemical mechanisms behind variations in N20 yield. Based on measurements of 615Nbulk, site preference
(SP =615N - 615NO), and 6180 of N20 (6180-N20), we esti-mate that nitrifier-denitrification produced between 11% and 26% of N20 from cultures grown under 20% 02 and 43% to 87% under 0.5% 02. We also demonstrate that a posi-tive correlation between SP and 6180-N20 is expected when nitrifying bacteria produce N20. A positive relationship be-tween SP and 6180-N20 has been observed in environmental N20 datasets, but until now, explanations for the observation invoked only denitrification. Such interpretations may over-estimate the role of heterotrophic denitrification and underes-timate the role of ammonia oxidation in environmental N20 production.
1 Introduction
The atmospheric concentration of the greenhouse gas nitrous oxide (N20) has risen steadily over the last century. Pro-cesses in the microbial nitrogen cycle are the largest source of atmospheric N20 and 20% of this source may come from the oceans (IPCC, 2007). Humans have greatly increased the amount of fixed nitrogen entering the oceans (Galloway et al., 1995), and the functioning of marine microbial ecosys-tems is shifting in response (Fulweiler et al., 2007; Beman et al., 2005; Naqvi et al., 2000). Understanding the impact of anthropogenic activity on the size of the marine N20 source requires knowledge of which microbes are involved in N20 production and how the production is controlled by chemical variables.
C. H. Frame and K. L. Casciotti: Biogeochemical controls and isotopic signatures of nitrous oxide production Nitrification, and in particular ammonia oxidation, is
thought to dominate N20 production in oxic water columns (Elkins et al., 1978; Cohen and Gordon, 1979; Goreau et al., 1980; Ostrom et al., 2000; Popp et al., 2002). Over-saturations of dissolved N20 (9 N20, nmol L-1) are of-ten positively correlated with apparent oxygen utilization (AOU, pmol L~ 1) (Yoshinari, 1976; Cohen and Gordon, 1978; Elkins et al., 1978). AOU is a tracer of organic matter remineralization. Therefore, the direct relationship between AOU and 0 N20 is taken as evidence that N20 is produced as nitrifying organisms convert regenerated NH3 to NO- and
NO-.
Stoichiometric relationships among N20 production, N03 regeneration, and AOU have been used to convert oceanographic nutrient and 02 data to estimates of N20 pro-duction (e.g., Codispoti and Christensen, 1985; Fuhrman and Capone, 1991; Jin and Gruber, 2003; Suntharalingam and Sarmiento, 2000) or to use N20 concentration data to calcu-late nitrification rates (e.g., Law and Ling, 2001), However, there is not a universal AOU:N20 ratio and linear AOU:N20 relationships break down unpredictably in low-02 environ-ments (Cohen and Gordon, 1979). Several different factors may contribute to this break-down: 1) at low 02 concentra-tions, ammonia-oxidizing bacteria produce higher yields of N20 per mole of NH3 oxidized (Goreau et al., 1980; Lip-schultz et al., 1981; Jorgensen et al., 1984), 2) heterotrophic denitrifying bacteria produce more N20 in low-02 condi-tions (Knowles et al., 1981; Payne et al., 1971), 3) in stably anoxic environments denitrifying bacteria are net consumers of N20, which they reduce to nitrogen gas (N2) (Cline et al., 1987), and 4) mixing between waters with different chemical properties influences the slopes of AOU:N20 linear regres-sions (Nevison et al., 2003). There is also potential niche overlap among nitrifiers and denitrifiers in low-02 environ-ments, making it especially difficult to distinguish between these two N20 sources. Ammonia-oxidizing bacteria are able to thrive at low 02 concentrations (Carlucci and Mc-Nally, 1969; Goreau et al., 1980; Codispoti and Christensen, 1985) and it has been suggested that denitrification occurs in oxic ocean waters in the anaerobic interiors of organic particles (Yoshida et al., 1989; Alldredge and Cohen, 1987). To understand how the N20 budget may respond to global change, we need methods for determining the individual con-tributions of nitrification and denitrification to the N20 bud-get.
Understanding the N20 source from ammonia-oxidizing bacteria is particularly complicated because these organisms contain two distinct N20-producing pathways that may
re-spond differently to geochemical controls. One pathway is the oxidative decomposition of hydroxylamine (NH2OH), or
one of its derivatives, during the conversion of NH3 to N02 (Hooper and Terry, 1979). The other mechanism, known as nitrifier-denitrification, is the sequential reduction of N02 to NO and then N20 by the action of the nitrite reductase (NIR, encoded by the gene nirK) and the nitric oxide
reduc-tase (NOR, encoded by the gene norB). All of the ammonia-oxidizing bacteria that have been screened to date contain the nirK and norB genes (Casciotti and Ward, 2001; Shaw et al., 2006; Casciotti and Ward, 2005; Cantera and Stein, 2007; Norton et al., 2008; Arp et al., 2007), and the conver-sion of 15NO to 15N20 has been demonstrated in several genera (Poth and Focht, 1985; Shaw et al., 2006). Archaeal ammonia oxidizers also appear to possess nirK and norB ho-mologs (Treusch et al., 2005; Hallam et al., 2006; Walker et al., 2010) but it is not known whether the proteins encoded by these genes are involved in N20 production.
The enzymes involved in nitrifier-denitrification are ho-mologous to those found in a subset of heterotrophic deni-trifying bacteria. However, unlike heterotrophic denitrifica-tion, nitrifier-denitrification may not be a strictly anaerobic process (Shaw et al., 2006). Ammonia-oxidizing bacteria express nirK in aerobic environments in response to N02 (Beaumont et al., 2004) and it has been hypothesized that NIR's main role is in detoxifying N0 (Poth and Focht, 1985; Beaumont et al., 2002). Nevertheless, a role for 02 is suggested by the fact that nirK expression increases in low-02 conditions (Beaumont et al., 2004), and yields of N20 from cultures of ammonia-oxidizing bacteria increase more than 40-fold when 02 concentrations drop below 5puM (Goreau et al., 1980).
N20 with biologically distinct origins can be identified using stable isotopic signatures. The oxygen isotopic sig-nature (6180-N20) has been used to distinguish nitrifica-tion and denitrificanitrifica-tion N20 sources (Ostrom et al., 2000; Toyoda et al., 2005; Wrage et al., 2005; Kool et al., 2007). The 6180 of N20 depends on the proportion of oxygen in N20 that is derived from 02 vs. H20, as well as any
frac-tionation factors associated with incorporation or loss of the oxygen atoms in the metabolic precursors of N20 (Fig. 1) (Casciotti et al., 2010). N20 derived from NH2OH con-tains only oxygen atoms from 02 whereas N20 produced by nitrifier-denitrification or heterotrophic denitrification de-pends on the 6180 of NO~ (and the 6180 of N0-, in the case of heterotrophic denitrification), which is derived from both 02 and H20 (Andersson et al., 1982; Casciotti et al.,
2010; Buchwald and Casciotti, 2010). Since the 6180 values of marine H20 are typically at least 20%o less than those of
dissolved 02 (Kroopnick and Craig, 1976), marine N20 pro-duced with different amounts of oxygen from H20 and 02
will reflect this in the 6180 signature. Indeed, positive corre-lations between oceanographic 6180-02 and 6180-N20 data have been interpreted as evidence that the N20 is a product of nitrification because oxygen from 02 is most directly in-corporated into N20 through NH2OH during NH3 oxidation (Ostrom et al., 2000; Andersson and Hooper, 1983).
However, there may be isotope effects associated with the incorporation of oxygen atoms from 02 and H20 into N20 (Casciotti et al., 2010). If these isotope effects are signif-icant and variable among different species of ammonia ox-idizers, it may prove difficult to extract source information www.biogeosciences.net/7/2695/2010/ Biogeosciences, 7, 2695-2709, 200 t
C. H. Frame and K. L. Casciotti: Biogeochemical controls and isotopic signatures of nitrous oxide production 2H20 H20 2 NH3 -- 2 NH2 OH - 2 NO2
(H
20*4 2 H20 SEND 2 NO 02 N20ENH2OH
\'..H 20
N20Fig. 1. During ammonia oxidation, the oxygen atoms incorporated into N20 come from either 02 or H20. The 6180-N20 depends upon the isotopic signatures of these two substrates as well as iso-tope effects (18 E) that may be associated with the individual forma-tion mechanisms, hydroxylamine (18ENH2OH) decomposiforma-tion and nitrifier-denitrification of nitrite
(18END)-based on oxygen isotopes alone. Furthermore, the 6180 of N20 produced by ammonia-oxidizing bacteria may change depending on what fraction of the oxygen atoms are de-rived from 02 (via NH2OH decomposition and nitrifier-denitrification) vs. H20 (via nitrifier-denitrification) (Fig. I).
The 15N site preference (SP) is another isotopic signa-ture used to interpret environmental N20 data (Toyoda et al., 2002; Sutka et al., 2003, 2004; Toyoda et al., 2005; Sutka et al., 2006; Koba et al., 2009). SP as defined by Toyoda and Yoshida (1999) is the difference in the isotopic enrichment of the internal (a) and external (@) nitrogen atoms in the linear N20 molecule:
Sp = 615Na - 6tSNO.
Unlike 6180 and 615Nbulk values, SP is thought to reflect the N20 production mechanism while remaining indepen-dent of the substrate's isotopic signature. This is because the reactions that produce N20 involve two identical precur-sor molecules (either NO or NH2OH) (Toyoda et al., 2002; Schmidt et al., 2004) that are presumably drawn simultane-ously from the same substrate pool. SP measurements made on N20 produced by ammonia-oxidizing bacteria and deni-trifying bacteria support this idea (Sutka et al., 2006). Cul-tures of ammonia-oxidizing bacteria produce N20 with a SP of about 33.5% via NH2OH decomposition. However, in the presence of N02 and low 02 concentrations, the same bac-teria make N20 with a SP that is closer to that of denitrifying bacteria (-0.8%c) (Sutka et al., 2003, 2004, 2006).
Previous workers have estimated the "end-member" SP signatures for the two different sources of N20 in ammonia oxidizer cultures by manipulating 02 concentrations in or-der to favor production via one process over the other (Sutka et al., 2003, 2004, 2006). However, since NH20H decompo-sition and nitrifier-denitrification can give rise to N20 simul-www.biogeosciences.net/7/2695/2010/
taneously, failure to account for this mixing may cause errors in these end-member SP estimates. If N20 from NH2OH decomposition has a SP that is much higher than the SP of N20 from nitrifier-denitrification, as proposed by Sutka et al. (2003, 2004, 2006), then source mixing would cause under-estimation of the SP of NH2OH decomposition and overesti-mation of the SP of nitrifier-denitrification.
Here we have used 6180-N20 and SP measurements to make mixing-corrected estimates of the end-member SP values for N20 produced by NH2OH decomposition and nitrifier-denitrification by the marine ammonia-oxidizing
bacterium Nitrosomonas marina C-Il3a. These end-member
values were then used to calculate the N20 yields from nitri-fication and nitrifier-denitrinitri-fication in different growth con-ditions, including a range of 02 headspace concentrations (20%, 2%, and 0.5%), excess N02 (0.2 to I mM), at different cell densities, and in the presence of nitrite-oxidizing bacte-ria. Each experiment was carried out with an eye towards simulating environmental conditions more closely than pre-vious studies by using growth medium that contains a frac-tion of the NH4 present in commonly used recipes for am-monia oxidizer media (50pM vs. 5 to 10mM NH+), and lower cell densities.
2 Materials and methods
2.1 Culture maintenance and experimental setup
Nitrosomonas marina C-113a cultures were maintained
semi-continuously in Watson medium containing 5mM NH+ (Watson, 1965). All maintenance cultures were kept in the dark at 22 C with shaking at 100 rpm. The cultures used to inoculate experiments were periodically tested for heterotrophic contamination as follows: I ml of each culture was added to 2 ml of a sterile 1:4 mixture of tryptic soy broth and artificial seawater and incubated 3 to 4 weeks in aerated culture tubes. Contamination was of particular concern dur-ing experiments on high density C-113a cultures because the abundance of cellular material was a potential source of or-ganic substrate for the growth of heterotrophic denitrifiers, which can also produce N20 at low 02 concentrations. For this reason, additional purity tests were done by inoculat-ing 5 ml of each high density culture (105 - 106cells ml- ') into 10 ml of the sterile tryptic soy/artificial seawater mix-ture amended with I mM NaNO2. These cultures were
in-cubated in closed, inverted 15 ml centrifuge tubes for 3 to 4 weeks. All tubes remained free of turbidity and showed no production of gas bubbles that would indicate heterotrophic denitrification.
Experiments were carried out in 545 ml glass serum bot-tles (Wheaton, 223952) that contained 100 ml sterile Wat-son medium with 50pM NH'. Parallel experiments in 18O-enriched water were set up by adding 1 ml of 5000%o 6180-H20 into each bottle. The headspace of each bottle
C. H. Frame and K. L. Casciotti: Biogeochemical controls and isotopic signatures of nitrous oxide production was sealed using 30 mm gray butyl rubber septa (Wheaton,
224100-331) and aluminum crimps (Wheaton, 224187-01). Atmospheric 02 and N20 were removed by purging for 3 h with N2 flowing at > 60 ml min~ I and appropriate amounts of high-purity 02 (61'0 = + 25.3%.) were injected back into each headspace to achieve 20%, 2%, or 0.5% 02 (v/v) (203, 20, or 5pM dissolved 02, respectively). Headspace 02 and N20 concentrations were checked before and after each ex-periment by electron capture gas chromatography (see be-low). The ratio of headspace to liquid volumes was such that complete NH3 oxidation consumed less than 10% of the total 02 in the lowest 02 headspaces.
Immediately before each experiment, 1-21 of late expo-nential or early stationary phase cultures were centrifuged at 10000g for 30min, washed to remove residual NH+ and N0 , and re-suspended in 30 ml sterile media without NH+. Experiments were initiated by the injection of 500pl of washed and resuspended cells into each bottle. In the co-culture experiments, ammonia oxidizers with cell den-sities of approximately 2 x 10⁵ cells ml 1 were added with washed and resuspended cells of the nitrite oxidizer
Nitro-coccus mobilis (106 cells ml- 1).
Initial and final cell densities were measured in samples preserved with 2% formalin (0.22-ym filtered) by making microscopic counts of DAPI-stained cells, or by using flu-orescence assisted flow cytometry (FACS) to count SYBR green-stained cells on a FACS Calibur flow cytometer (Bec-ton Dickinson). Uninoculated bottles served as a control for abiotic N20 production and were analyzed in parallel with experimental bottles. All bottles were incubated in the dark at room temperature with constant shaking. The progress of NH3 oxidation was monitored by measuring accumulation of NO~ and disappearance of NH from the medium (see be-low). Once NH3 oxidation was complete, experiments were terminated by injecting each bottle with I ml of 6 M NaOH, lysing the cells.
2.2 Chemical analyses
The concentrations of NH+ were determined colorimetri-cally by the phenol-hypochlorite method (Solorzano, 1969) and NO- concentrations were determined by the Griess-Ilosvay colorimetric method (Pai and Yang, 1990) using a 1 cm path-length flow cell. Headspace 02 concentrations were determined using a gas chromatograph with a 63Ni elec-tron capture detector (Shimadzu GC-8A). The 02 peaks from 20 to 250pt injections of sample headspace were recorded and integrated using Shimadzu EZStart software (v.7.2.1). Sample peak areas were calibrated with standard injections of air. Headspace N20 concentrations were also measured before and after each experiment using the GC-8A. Sample peak areas were calibrated against commercial N20 mix-tures (10, 1, and 0.1 ppm) and fresh atmospheric air (ap-proximately 320 ppb). When total headspace N20 was less than 20 nmol, N20 was quantified by analyzing the whole
bottle (by purging and trapping, see below) on a Finnigan DeltaPLUS Isotope ratio mass spectrometer (IRMS) and us-ing the linear relationship between peak area of m/z 44 and nanomoles of N20 to determine total N20. The average blank determined by analyzing bottles flushed with high-purity N2 was 0.08 ± 0.04 nmol N20.
2.3 Isotopic analyses
Isotopic analyses of N20 were conducted using a Finni-gan DeltaPLUS XP IRMS. Bottles were purged with He and N20 was cryo-trapped on-line with a custom-built purge and trap system (McIlvin and Casciotti, 2010) operated man-ually with 545 ml serum bottles. The following modifi-cations made large volume gas extraction possible: bot-tles were loaded manually, the helium flow rate was in-creased to 60 ml min~ 1, and the purge time was extended to 45min. As described in Mcllvin and Casciotti (2010), CO2 was largely removed from the gas stream by passage through a Carbosorb trap, then N20 was separated from residual CO2 using a capillary column (25 m x 0.32 mm) lined with Poraplot-Q before injection into the mass spec-trometer through an open split. Mass/charge (m/z) peak areas were automatically integrated using Isodat 2.0 soft-ware. Values for 6180-N20, 65Nbulk, 615N", and 61
5 NP were obtained from the 45/44, 46/44, and 31/30 peak area ratios and referenced to our laboratory's N20 tank as de-scribed in Appendix A. This reference tank has been cal-ibrated for 6180-N20 (% vs. VSMOW), 6l5Nbuik, 515Na, and 65NP (% vs. AIR) by S. Toyoda (Tokyo Institute of Technology). Furthermore, the isotopomer-specific NO+ fragment ion yields for our DeltaPLUS XP were determined for the ion source conditions used in these measurements (see Appendix B). For quality-control, two or three tropo-spheric N20 samples were analyzed between every 7 to 10 experimental samples to check the consistency of our iso-topomer analyses. These samples were created by allowing 100ml of artificial seawater to equilibrate with outside air in 545 mL serum bottles, sealing the bottles, and analyzing them as described above. Triplicate samples of tropospheric N20 from Woods Hole, MA analyzed during a typical run had 515Na = 15.0 ± 0.1%c, 615NP = - 1.9 ± 0.1%., 6180 =
44.4 ± 0.2%c, 6"Nbulk =6.5 ± 0.1%o, SP= 16.9 ± 0.1%o, and
ni/z 44 peak area= 15.6 ± 0.2 mV-s (7.8 ± 0.1 nmol).
We also measured the 6"'O and 615N of N0 that was pro-duced by cultures as NH3 oxidation progressed. NO- was converted to N20 using the azide method developed by Mcdl-vin and Altabet (2005). The conversion to N20 was carried out immediately after sampling to avoid shifts in the oxy-gen isotopic values by abiotic exchange with water (Casciotti et al., 2007) or continued biological production of N0 from residual NH3. Individual sample volumes were adjusted so that a consistent amount of N20 (5 or 10 nmol) was produced for each set of azide reactions. Each sample set included at least three sets of three different NO- standards (N-23, www.biogeosciences.net/7/2695/20 10/ B iogeosc iences, 7, 2695-2709, 20 10
C. H. Frame and K. L. Casciotti: Biogeochemical controls and isotopic signatures of nitrous oxide production N-7373, and N-10219; Casciotti et al., 2007) that were used
to calculate sample 615-NO (% vs. AIR) and 6SO-NO (%/ vs. VSMOW) values. These samples were analyzed in 20 ml headspace vials using the autosampler setup described by Casciotti et al. (2002), modified with the addition of an -60 'C ethanol trap and column backflush (Mcllvin and Cas-ciotti, 2010).
3 Results and discussion
Nitrifier-denitrification depends on the presence of NO- to produce N20 (Ritchie and Nicholas, 1972; Poth and Focht,
1985; Yoshida, 1988), and the accumulation of NO in
envi-ronments such as oxygen deficient zones (ODZs) could con-tribute to increased N20 production in these regions. To date, the roles of substrate concentration and cell density in de-termining N20 yield have not been systematically investi-gated. This study was designed to test the impact of 02 and NO- concentrations on the N20 yield of marine ammonia-oxidizing bacteria at a lower substrate (NH3) concentration, and at a broader and lower range of cell densities than any previous work. N20 yield data are presented in the same form used in oceanographic N20 studies so that yields are the fraction of N-atoms converted to N20 out of the total amount of NH3 that is oxidized (i.e. 2 x moles N20/moles
NH3). In other words, a yield of 5 x 10⁻⁴ indicates that I in every 2000 N-atoms from oxidized NH3 will go into an N20 molecule.
3.1 Cell density and 02 concentration
Cell density influenced the observed N20 yields in both low 02 (0.5% and 2%) and high 02 (20%) conditions. 02 con-centration had the greatest impact on N20 yield at the high-est starting cell density thigh-ested (1.5 x 10⁶ cells ml-1) (Fig. 2). At 20% 02, the high density cultures had the lowest aver-age yields observed, (1.3 ± 0.4 x 10--4) while at 0.5% 02 the high density cultures had the highest average yields observed (220 ± 40 x 10-4). In contrast, 02 had a much smaller im-pact on N20 yield in the medium density cultures (start-ing density=2.1 x 10⁴ cells ml1) and the low density cul-tures (starting density = 2 x 10² cells ml 1). In fact, the N20 yields of the medium density cultures were not significantly different among the high and low 02 treatments (at 20% 02, 5.1 ± 0.5 x 10⁻⁴, at 2% 02, 5.5 ± 0.8 x 10⁻⁴, and at 0.5% 02, 6.4 ± 1.4 x 10⁻⁴). Low density cultures produced aver-age yields of 3.9 ± 0.3x 10⁻⁴ at 20% 02, 4.7 ± 0.1 x 10⁻⁴ at 2% 02, and 6.7 ± 0.5 x 10⁻⁴ at 0.5% 02.
The average yields of the cultures at 20% 02 were compa-rable to the production yields (0.8- 5.4 x 10⁴) measured by Yoshida et al. (1989) in the oxic surface waters of the western North Pacific using i5NH+ tracer techniques. However, they are lower than previously reported yields for Nitrosomonas cultures at 20% 02 (26 - 30 x 10-4 in Goreau et al. (1980) and 10- 390 x 10-4 in Remde and Conrad, 1990).
S1.5 x 10 1.4 x l1 cell- miT c 2.1 x 10+/ 2.9 x 10 cells ml - -2x 10² Cells ml z z z < z z z - 20%02 - 2%02 - .5%02
Fig. 2. N20 yields vs. cell density. Each bar represents the average of 5 replicate cultures. Error bars are for one standard deviation among replicates.
In this study, low-02 conditions only resulted in substan-tial increases in N20 yield when cell densities were greater than 106 cells ml- 1. N20 yields were relatively low and less sensitive to 02 when cell densities were closer to those ob-served in the ocean (103-104 cells 1-1; Ward et al., 1982). This draws into question the oceanographic applicability of previous culture-based yield measurements, where a many-fold increase in N20 yield was observed as 02 dropped from 20% to 0.5% (Goreau et al., 1980). Goreau et al. (1980) worked with a marine Nitrosomonas strain at cell densities (I x 106 cells ml 1) comparable to our high density exper-iments and observed N20 yields of 800 - 1000 x 10-4 for cultures grown at 0.5% 02 on 24 mM NH+. The implication of the present study is that factors such as cell density can influence the relationship between N20 yield and 02 con-centration.
The mechanisms that explain the high N20 yields of high density cultures at low 02 could be chemical or biological. 02 has a major influence on the half-life of nitric oxide (NO), the gaseous precursor of N20 during nitrifier-denitrification. Therefore, concentration-dependent changes in the rate of N20-production could be related to 02 as a consequence of
the abiotic oxidation of NO: 2NO+ 02 - 2NO2
2NO2+ H20- HNO2+ HNO3, (Ritchie and Nicholas, 1972), where nitrous acid (HNO2), is the major decomposition product of the second reaction (Ignarro et al., 1993). In aerobic environments, 02 is the major reactant and any NO present reacts away soon after it is produced (Lewis and
C. H. Frame and K. L. Casciotti: Biogeochemical controls and isotopic signatures of nitrous oxide production Deen, 1994). However, in low-02 environments the
half-life of NO increases, so that during bacterial NH3 oxidation, it can accumulate to concentrations that are similar to N20 (Remde and Conrad, 1990; Lipschultz et al., 1981). This may allow the enzymes that carry out NO reduction to compete for NO with the above 02-dependent reaction. Studies of N.
europaea have also shown that the expression of nirK dur-ing nitrifier-denitrification is controlled by a repressor pro-tein (Beaumont et al., 2002, 2004) that belongs to a fam-ily of NO-sensitive transcription regulators (Rodionov et al., 2005). If NO induces nirK transcription, the abiotic reaction of 02 with NO could reduce NIR-dependent N20 production by consuming the inducer. Finally, high cell densities may be necessary for either of these effects to become important be-cause the ability of NO-reducing enzymes to compete with 02 for NO will depend on the diffusivities of 02 and NO relative to the average distance between cells.
It is unclear why cultures with the highest cell densities had significantly lower N20 yields at 20% 02 than cultures with lower densities (Fig. 2). Time, NO- (or NO), and in-creasing cell numbers could all enhance N20 production by nitrifier-denitrification. There were significant differences in the amount of time that it took cultures of each density to oxidize all the NH+ present. The low and medium density cultures took 14 and 3.5 d to oxidize 50pM NH+, respec-tively, while the high density cultures took only 7 h. Cell numbers also doubled approximately 7, 2, and 0 times, in the low, medium, and high density cultures, respectively. Thus, in the low and medium density cultures, N02 and cells ac-cumulated over longer periods of time than they did in the high density cultures. Further research is needed to deter-mine the behavioral and/or kinetic effects that influence the N20 yields from ammonia oxidizers.
3.2 NO- and 02 concentration
In pure batch cultures of ammonia oxidizers, NO- exposure is an unavoidable result of growth because NO- accumu-lates up to the initial NH' concentration. Excess NO- may increase N20 yields if ammonia oxidizers convert NO- to N20 to avoid the toxic effects of NO- (Poth and Focht, 1985; Beaumont et al., 2002, 2004). To test the impact of NO- on N20 yields, we increased NO- concentrations by adding 0.2 or 1 mM NO2 to some cultures, and decreased accumulated NO2 concentrations in others by adding the nitrite-oxidizing bacterium Nitrococcus mobilis to create a co-culture.
In the co-cultures, NO- concentrations remained below detection at 20% 02 and below 17pM at 0.5% 02. Although co-culturing kept NO2 concentrations lower than they were in the pure cultures, N20 yields were not significantly lower in the presence of the nitrite-oxidizing bacteria (Fig. 3a). The insignificant differences between the yields with and without nitrite oxidizers suggests that the 50pM NO- that accumu-lated in our pure cultures did not have a major impact on
the N20 yields measured for those cultures. However, we were unable to entirely eliminate N02 accumulation in the low-02 experiments. Future work should focus on
identify-ing the impact of N02 on N20 production by nitrifiers in low-02 environments.
The addition of 1 mM NO- had a greater impact on N20 yield than the differences in 02 concentration did (Fig. 3b). The increase due to the additional NO- was apparent in both low and high 02 conditions. Furthermore, the average N20 yields increased as the amount of added NO2 increased. Cultures under 20% 02 with no added N02 had an aver-age yield of 4.0± 0.03 x 10- 4 while those with 1 mM added NO- had an average yield of 7.6± 0.5 x 10⁻⁴. Cultures un-der 0.5% 02 with no added N02 had an average yield of 6.0 ± 0.5 x 10⁻⁴ and those with 1 mM added NO- had an average yield of 10.2± 0.3 x 10⁻⁴. N20 yields were calcu-lated as a fraction of the total N in NH+ consumed during the experiment (M 5 x 10⁻⁶ moles).
From this work, it is clear that increased N0 concen-trations enhance N20 production in cultures of ammonia-oxidizing bacteria. This is consistent with a detoxification role for nitrite reductase in nitrifying bacteria, as suggested by previous work (Beaumont et al., 2004). The relationship between N0 , nitrifier-denitrification, and N20 production is also complex. Aerobic nirK expression occurs in response to increasing NO- concentrations (Beaumont et al., 2004),
but nirK knock-out mutants actually produce more N20 than the wild-type strain. The authors suggest that the NH2 OH-dependent pathway has a role in this increase (Beaumont et al., 2002).
Oceanic 02 concentrations may influence a number of dif-ferent biogeochemical variables that enhance N20 produc-tion by ammonia oxidizers. For example, low dissolved 02 concentrations are often associated with elevated NO centrations (Codispoti et al., 200 1). When dissolved 02 con-centrations are low, the biological turnover time of NO also increases (Hashimoto et al., 1983) in part because the activity of nitrite-oxidizing bacteria ceases at a higher 02 concentra-tion than the activity of ammonia-oxidizing bacteria (Helder and de Vries, 1983). Charpentier et al. (2007) also suggest that high concentrations of organic particles found in cer-tain productive waters enhance N20 production by creating high-NO- , low-02 microenvironments necessary to support nitrifier-denitrification. Future oceanographic work should investigate how N20 production rates in oxygen deficient zones (ODZs) relate to these different biogeochemical vari-ables.
3.3 Pathway dependence of 6VsNbuIk-N20
Ammonia-oxidizing bacteria make N20 through two dif-ferent pathways, so that the observed isotopic signatures of N20 are a function of the pathways' mixing fractions, the isotopic signatures of their different substrate molecules, www.biogeosciences.net/7/2695/2010/ B iogeosciences, 7, 2695-2709, 20 10