Automotive Diagnostics as a Service: An Artificially
Intelligent Mobile Application for Tire Condition Assessment
The MIT Faculty has made this article openly available.
Please share
how this access benefits you. Your story matters.
Citation
Siegel, Joshua E. et al. "Automotive Diagnostics as a Service:
An Artificially Intelligent Mobile Application for Tire Condition
Assessment." International Conference on AI and Mobile Services,
June 2018, Seattle, WA, USA, Springer, June 2018 © 2018 Springer
As Published
http://dx.doi.org/10.1007/978-3-319-94361-9_13
Publisher
Springer International Publishing
Version
Author's final manuscript
Citable link
https://hdl.handle.net/1721.1/124000
Convolutional Neural Network for Tire
Condition Assessment
Joshua E. Siegel1[0000−0002−5540−7401], Yongbin Sun, and Sanjay Sarma
Department of Mechanical Engineering, Massachusetts Institute of Technology, Cambridge, MA 02139j siegel@mit.edu,
WWW home page:www.mit.edu/ j siegel/
Abstract. Automotive tires must be maintained to ensure vehicle per-formance, efficiency, and safety. Though vehicle owners know to monitor tread depth and air pressure, most are unaware that degrading rubber poses a safety risk. This paper explores the need for tire surface condi-tion monitoring and considers the development of a densely connected convolutional neural network to identify cracking based on smartphone images. This model attains an accuracy of 78.5% on cropped outsam-ple images, besting inexperienced humans’ 55% performance. Using this model, we develop a web service allowing mobile devices to upload images captured by their internal cameras for online classification, as the basis of an AI-backed “Diagnostics-as-a-Service” platform for vehicle condition assessment. By encoding knowledge of visual risk indicators into a neural network model operable from a user’s trusted smartphone, vehicle safety may be improved without requiring specialized operator training.
1
Motivation
Improperly maintained tires adversely impact vehicle acceleration, braking, steer-ing, comfort, and efficiency, with as many as 6, 000 deaths annually attributable to improperly maintained or defective tires [1,2]. As tires age and are exposed to harsh environments, rubber and other compounds lose compliance and become brittle, causing loss of grip and increasing the risk of catastrophic failure.
Despite tires’ importance, few drivers monitor their condition. Vehicle own-ers aware of the risks of improper inflation continue to operate vehicles with underinflated tires [3], and for less-well-known issues such as tire aging, oxida-tion, and cracking, drivers are unaware of the need for replacement[1,2], forgoing inspection entirely.
An easy-to-use system for visual tire inspection would raise awareness and improve compliance with regular tire replacement, reducing the risk of sudden material separation or a blowout. This paper examines the design and imple-mentation of such a system, using a mobile phone’s camera to capture pictures of a vehicle’s tires and a leveraging a web backend to classify tires into “normal” or “abnormal” states based on the presence of surface cracking.
2
Prior Art
Mobile phone sensors including accelerometers, GPS and microphones have been used to assess vehicle condition and to diagnose maintenance needs including wheel imbalance, tire pressure and air filter condition[4,5,6]. Such devices are pervasive, inexpensive, and effective, capable of emulating the human percep-tion of mopercep-tion and sound within a moving vehicle and applying machine learn-ing for reliable fault classification. However, not all diagnostic needs can be addressed with vibration and audio signals due to analytic complexity or poor signal strength. Additionally, static inspection is preferable when testing in mo-tion would heighten the risk of catastrophic failure, as is the case for cracked tires. Mechanics visually inspect tires on static vehicles; why can’t mobile phones?
There is precedent for visual condition assessment applications, with emerg-ing low-cost, low-power mobile processors makemerg-ing it possible to implement com-puter vision on portable devices[7].
Further, as deep learning becomes prevalent, it is finding use in visual condi-tion monitoring, where it is applied to capture insights from difficult-to-comprehend transformations, even transitioning from diagnostics to prognostics. Such ad-vances have been leveraged in conjunction with infrared imaging to detect wear and other issues within mechanical systems[8,9], to inspect vehicle component production[7], and to automate monitoring of rail surface defects where data volume prohibits manual inspection[10].
With advances in software toolkits and the ability to utilize graphics process-ing units to massively parallelize computation, along with pervasive connectivity to allow image data to be streamed to a server for classification, now is the op-timal time to explore the use of visual techniques for tire condition assessment.
3
Hypothesis
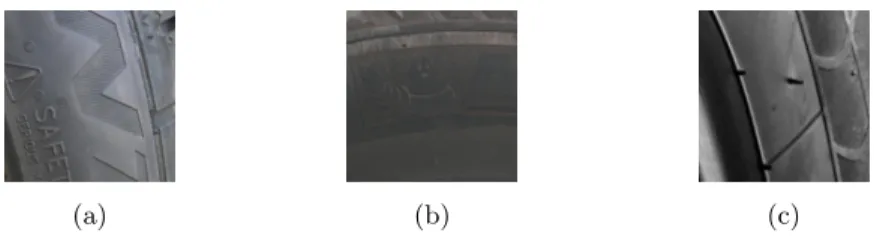
Unsafe, cracked tires can have a variety of appearances based on time compound, age, and exposure to sun and chemicals. Some tires form long, narrow cracks while others take on the appearance of a checkerboard. Others develop a “pilling” surface texture, while yet more develop deep, crisscrossed x’s on their surface. Some tires only crack around the edges of raised surfaces such as letters, or where two rubber compounds meet, such as at the interface between the tread and sidewall.Though all tires crack differently, there are common traits that well-trained AI and pattern matching can extract. Reference images showing the variety of cracked tires appear in Figure 1.
We believe it is possible for a Convolutional Neural Network (CNN) to de-velop a kernel capable of matching features based on the repeated patterns and edges present in tires with cracked sidewalls. These crack patterns’ jagged edges may appear similar to tire tread patterns, though a sufficiently optimized CNN classifier should be able to robustly identify cracked versus normal tires. The re-sulting model may then be optimized to run on a mobile device, or implemented as part of a Diagnostics-as-a-Service (DaaS) platform in which feature data are
(a) (b) (c)
Fig. 1: These images show three representative samples of cracked tires. (a) is a “pilling” tire, (b) shows a series of long, narrow cracks surrounding the bead of the tire and (c) shows deep, criss-crossed cracking.
(a) (b) (c)
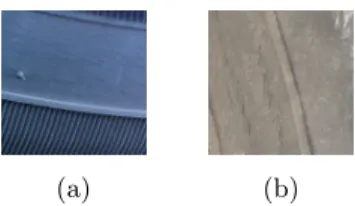
Fig. 2: These images show three representative samples of tires in good condition. Note that while some of the samples such as the tire shown in (b) show surface abrasions that these tires are still safe.
sent from a mobile device to a server, and the classification result is returned. Offloading intensive processing will reduce the classification time, while conserv-ing the mobile device’s battery. It also allows the central server to aggregate tire data, have a human supervise incoming images at regular intervals, and retrain the model to support continuous improvement as the training set grows.
4
Data Collection and Augmentation
Collecting images of tires is a time-consuming process. To accelerate data col-lection, we conducted an image search for new and old tires (using the keywords “weather-checked,” ‘weathering,” “oxidized,” “cracked,” and “dry-rotted”) on Google Images, Craigslist, and eBay. By selecting the images individuals chose to upload of their own tires, we ensured the training set featured entries from a variety of camera types, resolutions, noise characteristics represented. Further, the images were taken from different distances, angles, under varied lighting conditions and covered with different amounts of dirt. This ensured the training set was representative of the type of images an end-user might take with his or her mobile phone should the classifier be deployed to the public as a diagnostic service.
As we selected source images, we chose those best representing well-maintained tires and aged tires while avoiding incorporating images with brand-new, un-used or polished tires (fastidious drivers are more likely be able to monitor their
tires’ condition without requiring a dedicated classification application). We also sought to include a variety of tire classes, from low-profile high performance tires to knobby off-road tires. The only images we discarded were those that were sub-stantially over- or under-exposed and those under 224x224px to ensure sufficient resolution to capture the cracks’ details. Blurry images and angles from non-conventional angles were included in the training set.
To avoid background image data and wheel reflections, each of the images in the final set was segmented and coarsely cropped to capture only the rubber tire region, minimizing the environment’s contributions to the learned CNN. Fig-ures 1 and 2 show a random selection of representative images from both classes, formatted as described. Note that some cases were more difficult to distinguish than others; a trained mechanic was asked to identify the ground truth state in all cases, making judgment calls between acceptable wear and unsafe oxidation. While we used this mechanic’s judgement as ground truth when dividing and labeling the dataset, it should be noted that even the baseline accuracy is im-perfect (though a second trained individual matched the mechanic’s labels with 98% accuracy, helping validate the mechanic’s own labels).
As we built a folder of source images, we sought to keep classes balanced by quantity of unique input files, within a 10% tolerance. After exhausting our search terms and collecting several samples manually, there were 1, 028 unique images, with 537 representing the cracked/aged class and 491 representing nor-mal tires (a 52.2%/47.8% split).These sets were then split randomly to retain 70% as in-sample training and validation data and 30% as keep-out testing data. While this represents a reasonable sample size for testing and training, additional data were desired in order to maximize the classifier’s robustness to perturbations. Therefore, we augmented the training data in software.
Data augmentation has been shown to be an effective mechanism of im-proving classification accuracy when used to expand a limited dataset[11], so we used the ImgAug Python package1to apply a series of randomized modifications
(“augmentations”) to the source images, including flipping, cropping, rotation, skewing, adding noise, sharpening, pixel dropout, channel inversion, brightness and contrast adjustment, and edge highlighting. Each input image was used to generate 25 altered variants to be included with the training data set.
The final, augmented training set included 8, 502 images of cracked tires and 9, 776 images of normal tires, a 43.4%/56.6% class balance. The labeled, non-augmented image dataset will be contributed to the community.
5
Calculating Baseline Accuracy
To compare our model’s performance with that of the human it is designed to help, we had to determine a human baseline to identify how well our algorithms perform relative to people. Here again, we assume that trained users such as mechanics would not benefit from our application, and therefore selected indi-viduals like our target users who own cars but who have no prior knowledge
1
about vehicle maintenance. To gather performance data, we developed an ap-plication that drew sample images from the testing set and asked three people to evaluate each tire as either normal or cracked to determine a non-trained human’s accuracy.
We presented users with the same 352 testing images used to validate the classification model in a random order and asked them to classify the tires as being either safe or unsafe with no prior coaching about what unsafe tires might look like. These individuals provide a baseline against which we evaluate our algorithm’s target performance (since we must assume that the users who opt to use their phones for visual inspection will also be able to use their own eyes to assess tire condition).
After surveying three users, we found an average prediction accuracy of 74.2% relative to our trained mechanic’s labels. The evaluators had a false positive rate of 40.7% and a false negative rate of 0.5%. This is in part because the testers had a preconceived bias towards oversensitivity, as they knew we were conducting a study relating to tire safety.
Interestingly, we noted that as users gained familiarity with the test images, their accuracy improved. This is because users, having been exposed to over 350 images and with knowledge that we are looking for two-state classification (safe vs unsafe) began to identify common traits helping to bisect the results evenly. As a result, these untrained users likely classified tires with higher accuracy than uninformed drivers would in the real world.
We therefore segmented the human’s classification accuracy based on the user’s exposure to tire images. After seeing only 10% of the dataset (35 tires viewed), the average user accuracy was 55%, or slightly better than a coin toss. With this limited exposure, the testers had a false positive rate (identifying cracked tires when tires are actually safe) of 73.4% and a false negative rate of 0%.
At 25% exposure, users attained an accuracy of 60%. At 50%, users reached 64% accuracy while at 75% exposure, they reached 73% classification accuracy. Therefore, for our target demographic, any performance beating the performance of a simple coin toss is actually an improvement upon the status quo since such a model may embed knowledge about failed tires with which app users will not inherently be familiar.
6
Implementing a Convolutional Neural Network
Upon observing humans prove our hypothesis that unsafe tires have visually discernible patterns, we began to design Convolutional Neural Networks (CNN’s) for classification. We developed several using OpenCV, Python and TensorFlow, with each software component selected for its multi-platform support and active developer communities.
We implemented and trained several types of neural networks including con-ventional CNN’s, VGG-16, and DenseNets[12], testing each for approximately 100 epochs. Based on our results from testing, we found that DenseNets struck
a balance between computational efficiency and accuracy, and developed mod-els that were more robust to overfitting. The DenseNet model improves upon a conventional CNN’s performance by eliminating the vanishing-gradient problem, encouraging feature reuse, and strengthening feature propagation to reduce the number of feature parameters used.
To train the DenseNet, we tuned the hyperparameters no fewer than 10 times and observed validation loss and mean accuracy, stopping after 100 epochs or apparent convergence, whichever came first. From these trials, we developed an implementation of a densely-connected convolutional neural network with 4 blocks of 15 layers and a growth rate of k = 18. We started with a learning rate of 1e − 4 and a decay rate of 0.95 with 1, 500 steps on a batch size of 64, with images examined on all three channels (R, G and B) after being resized to a common size of 224x224 pixels. This model implemented a testing/validation split of 80%/20%, had a keep probability of 80%, a reduction of 0.5 and a weight decay of 1e − 5. The bottleneck coefficient was 4.
Running the designed model, our validation accuracy converged to approxi-mately 85.5% and a validation loss of 1.1 after 150 epochs. We then tested the optimized classifier on cropped, non-augmented outsample data to validate per-formance on the keep-out testing set. These were the same 352 images presented to the human testers.
From the cropped outsample data set, we obtained a 21.5% misclassification rate (78.5% accuracy), with a confusion appearing in Table 1.
Table 1: Confusion matrix for outsample, cropped and non-augmented tire im-ages. n=352.
Actual Cracked Actual Good
Predicted Cracked 164 46
Predicted Good 24 91
From this table, we saw that the true false positive rate (says cracked when normal, resulting in hassle inspection) was 21.9% while the false negative rate (drivers continue operating with dangerous tires) was 20.8%. This false positive rate substantially reduces unnecessary inspection relative to untrained human inspection, though the false negative rate will require improvement to maximize safety (users who do not visually inspect tires today but who are convinced to inspect tires using a mobile application will suffer from a false sense of security). We inspected the misclassified images to seek out possible causes, and found that many of the images were over- or under-exposed, and tended to feature extreme close-ups of the tire surface. Surface abrasions such as scuffs and flashing left over after manufacturing tended to cause misclassification as cracked when the tire condition was actually good, whereas blurrier photos caused cracked tires to be misclassified as safe. These are shown in Figures 3 and 4.
(a) (b)
Fig. 3: These pictures show cracked tires that were improperly identified as safe. The images are not crisp, taken close to the tire, and do not have a lot of contrast.
(a) (b)
Fig. 4: These pictures show normal tires that were classified as unsafe. Here, the scuffing and remnants from the manufacturing process (flashing) may have caused improper classification.
These faults could be easily addressed in future revisions by tracking image lightness to reject overexposed images, querying the camera’s focusing software to determine if an object is too close, and using motion sensors like gyroscopes and accelerometers to reject photographs taken by an unstable hand. Nonethe-less, we set out to determine how the DenseNet worked on these imperfect data.
7
Model Functionality
First, we visualized the learned filters to see if there were any discernible patterns. The first layer’s filters are shown in Figure 5.
Fig. 5: This image shows the first layer’s filters for a single color channel. While some filters do appear noisy, others show patterns that seem to match tires’ cracked edges.
While these filters may seem pseudo-random, they all serve a purpose. Some activate to highlight cracks in cracked tires, while others activate on normal, uncracked surfaces. We tested the filters on three baseline images from each class selected at random, and show their activation responses in Figure 6.
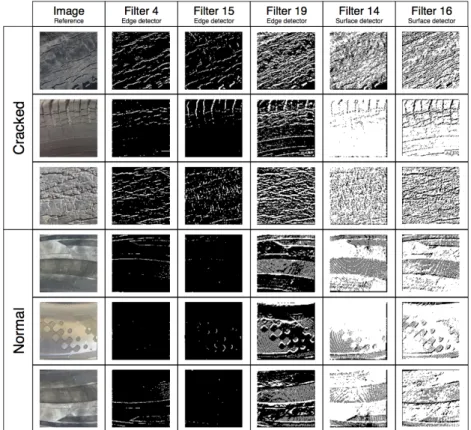
Fig. 6: The activation results of selected filters are represented as grayscale im-ages (brighter pixels for higher activation responses, and darker pixels for lower responses). In this table, it is possible to see each how several filters activate when presented with cracked and normal input images. These activations, which have stark differences between normal and cracked classes, inform the classification model.
In Figure 6, we show selected activation results of first-layer filters that present interpretable behaviors. For example, after training on the provided dataset, some filters learn to detect edges orientated in different directions, while other filters learn to detect flat surfaces. We can also observe that cracks have far more activation on edges, and surface detectors appear to benefit from higher activated on the smooth surface of a safe tire.
In aggregate, these filters and activation functions are used to differentiate the tires between the normal and cracked states.
8
Mobile Implementation
After developing an effective CNN classifier, we sought to implement the DenseNet as part of a mobile application. This way, drivers could take a picture of their tires and receive a condition assessment. By making the model operable on mobile devices, the application’s reach is significantly improved – such an application could be used to offer insurance incentives, for example.
In order to support running the CNN on a mobile device, we had to make an architectural decision: the network could be run on the mobile device itself, or the mobile device could send data to a remote server for classification. The implementation decision depends on a number of factors including mobile phone speed, core count, network bandwidth, and latency.
To run locally on a mobile device, the network would need to its graph to have its reduced, loaded to memory and optimized for realtime use. To run on a server, the mobile device would need to simply capture an image and send that file over a network to a remote server. However, there are security implications when sending data over a network that drivers may not feel comfortable with.
Ultimately, we made the decision to implement the service remotely and to transmit captured video information to a server for processing. This avoided potential memory and speed limitations in mobile GPUs, as well as conserves battery life by offloading intensive processing to scalable Cloud-computing plat-forms.
When implementing the mobile application and server architecture, we opted to build using web tools in order to maximize device compatibility and therefore reach. We implemented a file uploader using HTML5 and developed a server using Flask, a Python library. This simplified integration with TensorFlow as our classifier was originally implemented using Python, while the HTML5 webpage works across platforms including Windows, macOS, iOS and Android.
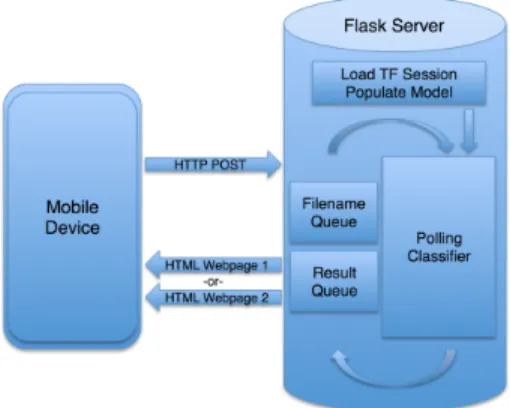
In the server code, the CNN graph is loaded to memory. The server launches a TensorFlow session in a thread to prevent blocking, and images are sent to the server as .jpg’s with unique filenames. When requests come in, each filename is passed to the classifier’s thread via a queue. The classifier enters the filename into a queue which will be identified as non-empty by the TensorFlow thread. This thread then opens the file and categorizes the tire’s state. The result is pushed to a second queue, which is read once it fills up. As images’ classification results are returned, the flask server renders one of two webpages based on the classifier’s result – one page notifies users that their tires are likely in good condition, while the other page suggests that a user’s tires may no longer be safe and instead suggests a list of tire vendors. This is roughly shown in Figure 7.
For low volume implementations, the Flask implementation works well, and the classifier is sufficiently fast to render the appropriate webpage without an apparent delay. In higher-throughput scenarios the queue must be monitored
Fig. 7: This figure shows how mobile devices query the state of a tire by sending images to a central server. The mobile device captures an image to POST through a form with the file input type, and the flask server has a classifier stored in memory. The classifier runs on the uploaded file, and an HTTP webpage is rendered to the client as a result.
to ensure that the returned classification matches that of the input filestream (that there are no concurrency issues). We have yet to determine this precise rate limit.
This code can be streamlined in the future by allowing images to be resized locally to the mobile device, conserving bandwidth (since the input images for the classifier are already reduced to 224x224px). We may make further changes to the webpage, including using WebRTC to ease media streaming and to sim-plify capturing video. WebRTC will allow us to live stream video and use the remote server to segment and classify images without requiring the user to fo-cus the image specifically on a tire’s rubber region. Through a series of canvas manipulations, we will auto-detect when the tire fills a significant portion of the camera’s frame and automatically capture the image or a series of video frames at the optimal time.
9
Future
Developing a mobile implementation of a visual tire condition monitor has the potential to change how people maintain their vehicles, helping drivers stay on the road longer and safer than today.
However, there are a number of improvements that can make this application even more useful to individuals and fleet managers. Our first improvement will be to consider classification probability based image rejection; photographs that yield a low classification confidence will return a third state to the mobile appli-cation asking the user to capture an image again. Additional next steps will look towards color- and contrast-based image segmentation to automatically extract
the rubber region of the tire from images, minimizing the need for users to ori-ent their mobile devices in a particular way. We will also extend the algorithm to classify tires surfaces by region, to highlight specific areas of concern such as gouges, scuffs, or localized cracking. This same image processing technology may find further application to automotive tire monitoring, by using visual data to measure tread depth or to check tire date codes or load and speed ratings.
To further improve accuracy, we intend to gather an order of magnitude more training data and extend the mobile application to take several frames of video data and send these to a server. By capturing multiple frames, we are able to classify each and take a majority vote for classification to improve model robustness. This will reduce the application’s sensitivity to lighting, angle, and focus changes by providing redundancies.
This work is the first step in a long line of applications that can leverage AI to improve vehicle performance, reliability, and efficiency and lays the framework for creating a “Diagnostics-as-a-Service” platform capable of turning mobiles phones into “tricorders” capable of diagnosing a range of mechanical systems.
10
Acknowledgements
The Titan Xp used for this research was donated by the NVIDIA Corporation.
References
1. Kalsher, M.J., Wogalter, M.S., Laughery, K.R., Lim, R.W.: Consumer knowledge of tire maintenance and aging hazard. In: Proceedings of the Human Factors and Ergonomics Society Annual Meeting. Volume 49., SAGE Publications Sage CA: Los Angeles, CA (2005) 1757–1757
2. Cowley, J.A., Kim, S., Wogalter, M.S.: People do not identify tire aging as a safety hazard. In: Proceedings of the Human Factors and Ergonomics Society Annual Meeting. Volume 50., Sage Publications Sage CA: Los Angeles, CA (2006) 860– 864
3. Sivinski, R.: Evaluation of the effectiveness of tpms in proper tire pressure main-tenance. Technical report, NHTSA (2012)
4. Siegel, J.E., Bhattacharyya, R., Sarma, S., Deshpande, A.: Smartphone-based wheel imbalance detection. In: ASME 2015 Dynamic Systems and Control Con-ference. American Society of Mechanical Engineers. (2015)
5. Siegel, J., Bhattacharyya, R., Sarma, S., Deshpande, A. In: Smartphone-Based Vehicular Tire Pressure and Condition Monitoring. Springer International Pub-lishing, Cham (2018) 805–824
6. Siegel, J.E., Bhattacharyya, R., Kumar, S., Sarma, S.E.: Air filter particulate loading detection using smartphone audio and optimized ensemble classification. Engineering Applications of Artificial Intelligence 66(Supplement C) (2017) 104 – 112
7. Liu, Z., Ukida, H., Niel, K., Ramuhalli, P. In: Industrial Inspection with Open Eyes: Advance with Machine Vision Technology. Springer London, London (2015) 1–37
8. Janssens, O., de Walle, R.V., Loccufier, M., Hoecke, S.V.: Deep learning for infrared thermal image based machine health monitoring. IEEE/ASME Transactions on Mechatronics PP(99) (2017) 1–1
9. Zhao, G., Zhang, G., Ge, Q., Liu, X.: Research advances in fault diagnosis and prognostic based on deep learning. In: 2016 Prognostics and System Health Man-agement Conference (PHM-Chengdu). (Oct 2016) 1–6
10. Faghih-Roohi, S., Hajizadeh, S., Nez, A., Babuska, R., Schutter, B.D.: Deep convo-lutional neural networks for detection of rail surface defects. In: 2016 International Joint Conference on Neural Networks (IJCNN). (July 2016) 2584–2589
11. Wang, J., Perez, L.: The effectiveness of data augmentation in image classification using deep learning
12. Huang, G., Liu, Z., Weinberger, K.Q., van der Maaten, L.: Densely connected convolutional networks. arXiv preprint arXiv:1608.06993 (2016)