Publisher’s version / Version de l'éditeur:
19th International Symposium on Ice [Proceedings], 2008
READ THESE TERMS AND CONDITIONS CAREFULLY BEFORE USING THIS WEBSITE. https://nrc-publications.canada.ca/eng/copyright
NRC Publications Archive Record / Notice des Archives des publications du CNRC :
https://nrc-publications.canada.ca/eng/view/object/?id=b714e9e3-85eb-4025-9aa5-681cbcfd7e6c https://publications-cnrc.canada.ca/fra/voir/objet/?id=b714e9e3-85eb-4025-9aa5-681cbcfd7e6c
NRC Publications Archive
Archives des publications du CNRC
This publication could be one of several versions: author’s original, accepted manuscript or the publisher’s version. / La version de cette publication peut être l’une des suivantes : la version prépublication de l’auteur, la version acceptée du manuscrit ou la version de l’éditeur.
Access and use of this website and the material on it are subject to the Terms and Conditions set forth at High-speed imaging of mechanisms responsible for sawtooth cyclic loading during ice-crushing
19
thIAHR International Symposium on Ice
“Using New Technology to Understand Water-Ice Interaction”
Vancouver, British Columbia, Canada, July 6 to 11, 2008
HIGH-SPEED IMAGING OF MECHANISMS RESPONSIBLE FOR
SAWTOOTH CYCLIC LOADING DURING ICE CRUSHING
R.E. Gagnon
Institute for Ocean Technology National Research Council of Canada
St. John's, NL, Canada, A1B 3T5 Robert.Gagnon@NRC.CA
Abstract
High-speed imaging (30,000 images/s) has been used to observe the behavior of mono-crystalline freshwater ice during crushing at –10oC. The ice contact zone consisted of an intact high-pressure central area surrounded by pulverized spall debris and partially refrozen melt. A sawtooth pattern was evident in the load record, similar to that observed in other ice crushing and indentation studies. The spalling behavior that is responsible for any particular load drop in the load record was found to be caused by the presence of small stable fractures in the high-pressure intact ice zone that were created during the preceding spall event and associated load drop. The small fractures are roughly centered in the intact ice region and this explains why the magnitude of the load drops is typically half the prior load value. The removal of ice from the intact ice zone by the viscous radial flow of a thin layer of melt has been described before (Gagnon, R.E. 1994. Melt Layer Thickness Measurements During Crushing Experiments on Freshwater Ice. Journal of Glaciology, 1994, Vol. 40, No. 134, 119-124). This process explains why the small fractures are roughly centered in the high-pressure contact zone. There the flow is stagnant and less ice has melted, relative to the non-central areas, and this leads to high non-uniform stresses in the ice that cause the fractures.
1. Introduction
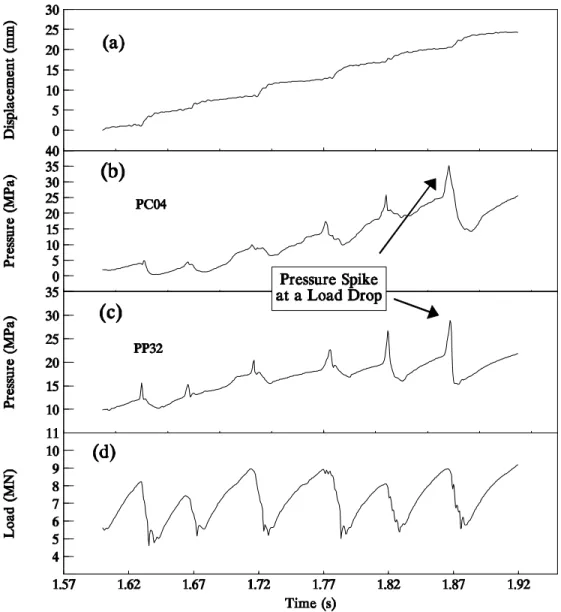
Ice crushing and indentation has been studied intensively over the past few decades. Some characteristics of the ice behavior recur during field and lab studies and at various scales (Gagnon, 1999). One intriguing aspect has been the apparent cyclic sawtooth pattern in load that has been described frequently and attributed to spalling behavior. Figures 1 and 2 show examples, from earlier studies, of the sawtooth load behavior, and associated pressure and displacement data, for lab and field experiments respectively. Aspects of the sawtooth patterns, such as their regularity, have not been addressed in any detail so far and no explanations for the size of spalls, and the associated magnitude of the load drops, have been offered. An explanation is provided here based on observations of ice crushing behavior from images acquired at very high speed (30,000 images per second).
Figure 2. Time series of displacement (a), piston/diaphragm pressure sensor output (b), PVDF pressure sensor output (c) and load (d) for a segment of test Tfr4. The displacement data has not been corrected to account for the ice compliance. The correction would make the gently sloping plateaus almost horizontal. (From Gagnon, 1998)
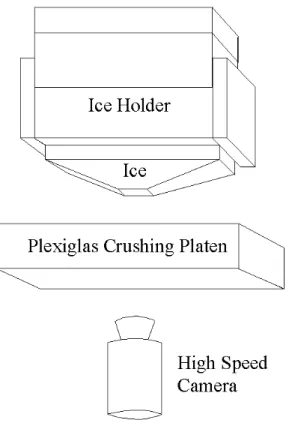
2. Apparatus and Test Parameters
Figure 3 shows the test setup, where the ice, confined in a rigid holder, is pressed against a transparent PlexiglasTM crushing plate (5 cm thickness) in a testing frame as high-speed images are acquired from the opposite side of the plate. The ice sample was mono-crystalline with the c-axis oriented vertically. The specimen was initially a block 13 cm x 13 cm x 10 cm with the top trimmed to the shape of a truncated pyramid with a slope of about 40o. Details of the procedure for preparing the ice specimen and mounting it in the ice holder are given by Gagnon (1994). A single crystal was used primarily to avoid intergranular cracking that would normally obscure visual observations. The ice holder has been described before and the method of growing large
Figure 3. Crushing apparatus with camera for viewing the contact zone during experiments.
single crystals (Gagnon, 1994). The test was carried out at –10oC and the actuator was moving at a nominal rate of 32 mm/s. The load data for the test were acquired at 20,000 samples per second.
3. Test Results and Discussion
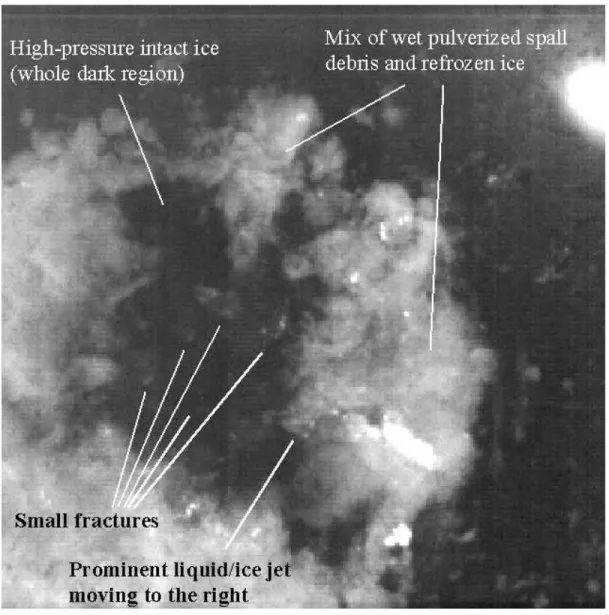
Figure 4 shows an image acquired during the crushing test. The figure is annotated to illustrate features of the ice behavior to assist the reader in understanding the discussion that follows. The region of the image showing white material surrounding a central dark region corresponds to the area of contact where the top of the pyramid-shaped ice sample is being crushed against the Plexiglas crushing plate.
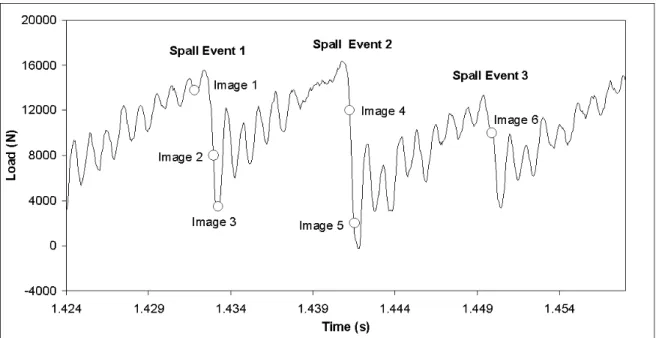
Figure 5 shows 6 images from a portion of the high-speed video record of the test. The camera (Fastcam-APX RS) was running at a capture rate of 30,000 images per second and each image was 256 x 256 pixels in size, the maximum allowable resolution for the camera at this image acquisition rate. The images run from the top left to the bottom right of the figure and are not
consecutive but rather were chosen to show relevant features of the ice behavior, particularly during load drop events that are caused by spalling. Image 2 in the figure is the same as that shown in Figure 4. The particular locations of the images in the time series of the load record of the test are shown in Figure 6. The oscillating pattern in the load record between the load drops is elastic resonance in the ice/apparatus system, primarily due to flexure of the Plexiglas crushing plate.
The first image shows the ice contact just prior to a spall event, (i.e. designated Spall Event 1). The dark irregular shape somewhat to the left of center shows the region of ice / crushing plate contact where the ice is essentially intact and where the pressure is high (roughly 70 MPa (Gagnon, 1994)). Surrounding this is white material that is a mix of pulverized spall debris and partially refrozen melt from earlier in the test. The melt was created in the high-pressure region
the
production of fresh white material around the periphery of the dark zone due to the rapid exit of refreezing liquid and pulverization of the new spalls. This behavior is much easier to see when viewing the actual high-speed video record of the test, such as the movie segments shown at the IAHR 2008 session (contact author for information). Figure 4 serves as an aid to identify these aspects. The rapid exit and refreezing of melt is particularly evident in the form of a liquid/ice jet indicated in the figure. In this case, the velocity of the thin layer of ice produced indicates a lower-limit estimate for the liquid flow rate that produced the ice of about 15 m/s during the load drop. The thin piece of ice moving to the right in Image 3 of Figure 5, that shows as the bright object in the liquid/ice jet region, was used for the velocity estimate. Later in the high-speed image record the flat piece of ice was observed to be extremely thin (on the order of one image pixel, corresponding to 0.17 mm) after it had rotated somewhat to give an edge-on view while moving to the right. At another instance in the high-speed image record an estimate for an even higher lower-limit of fluid flow speed (about 40 m/s) at load drops was made. These high fluid
Figure 4. Image from the high-speed video record indicating various aspects of the ice behavior. The image is 43 mm wide.
flow and freezing rates are extraordinary and can only be observed with a camera that has at least the speed and resolution of the one used here. The rapid melt and fluid flow stops at the
end of the spall event and bottom of the load drop. Further relatively slow melting and flow continues to occur during the ascending portion of the following load sawtooth, thereby expanding the intact ice contact area due to the melting, until the next spall event occurs. The next load drop is precipitated by the spall event (Spall Event 2) shown in Image 4. The spalling initiates at the small stable cracks that were created during the previous spall event and the spalling shape is somewhat determined by the distribution of
the small cracks. Three regions of remaining intact ice are present after Spall Event 2. From this sequence of events we can surmise that the seeds of a spalling event (i.e. the small cracks) are planted in the previous spalling event. Image 5 was taken a little later during Spall Event 2 and a small fracture has occurred in one portion of the intact ice, similar to the fractures that were evident in Images 2 and 3. Image 6 was acquired during the next spall event (Spall Event 3) and shows spalling that initiated in the vicinity of the small crack shown in Image 5. Hence, to summarize, the small cracks arising in the remaining intact ice during Spall Event 1 lead to Spall Event 2. And in turn the small crack that arose in the remaining intact ice during Spall Event 2 lead to Spall Event 3.
Figure 6. Load record for the test shown in Figure 5 with markers (open circles) corresponding to the six images. The oscillating pattern in the load record between the load drops is elastic resonance in the ice/apparatus system.
Figure 7. Schematic of the process of high-pressure viscous flow of melt that occurs when the ice moves against the crushing platen. The thickness of the liquid layer is highly exaggerated. (From Gagnon, 1994)
The nature of the small cracks is not entirely clear. They may all be cracks of the ordinary type, that is, where molecular bonds are broken in the ice resulting in a void between the wall faces of the crack. Intriguingly, there may also be instances when ‘compression fractures’ occur (Knight and Knight, 1972; Baumann et al., 1984; Gagnon et al., 1994). In this case internal melting creates melt figures (liquid-filled fractures) inside the ice when rapid adiabatic pressurization occurs, such as during load drops where the pressure on the remaining intact ice initially increases rapidly (as in Figures 1 and 2). This speculation requires more detailed experiments for verification. In either case the result is the same, the strength of the ice gets compromised due to the presence of the cracks, whatever their nature. The stress required to make these cracks propagate in order to precipitate a spall and a load drop determines the peak load on the load sawtooth.
The regularity of the sawtooth load pattern appears to stem from two effects associated with the small fractures: 1. The fractures are roughly the same size regardless of the size of the load sawtooth or load drop. That is, they seem to be regulated by the stress in the ice during the load drop when the cracks are created rather than by the total load. 2. The cracks occur in the approximate center of the remaining intact ice during a load drop because there is little or no liquid flow and melt there and consequently the ice experiences more compressive stress than in the peripheral regions where ice is removed by melting due to the viscous flow of the liquid layer. The small fractures are stable since they do not propagate very far during the load drop, probably because the stress is highly localized and non-uniform in the stagnant central zone of the intact ice. Hence, when a subsequent spall occurs its nucleation point and ultimate shape are determined from the position and distribution of the cracks created during the previous load drop, and the spalling roughly reduces the initial intact ice contact area by one half. The drop in load due to the spall is consequently half the peak load on the sawtooth just prior to the spall event. The spalling initiates when the stress in the area where the small fractures reside reaches a value to make the fractures propagate. The consequence is that the magnitude of the rise in load on a sawtooth following a spalling and load drop event is not arbitrary but determined by the stress required to start the small fractures propagating.
The observations in this study lead to the interpretation given above. For the present test results, at least, the interpretation is reasonable. In the present case a relatively small ice sample was used and it was mono-crystalline. It is noted, however, that similar crushing behaviors during tests using single crystals and polycrystalline samples have been observed (Gagnon and Bugden, 2007), and therefore the interpretation given here may be applicable to the polycrystalline case. Along the same lines, similar crushing behaviors of ice at different scales have been observed (Gagnon, 1999) and the present interpretation could again be applicable at various scales.
4. Conclusions
In situ observations of ice crushing processes obtained from a high-speed imaging camera has revealed processes that can explain the sawtooth cyclic load pattern that is often characteristic of ice crushing and indentation experiments. Small stable cracks that occur in the roughly central region of the high-pressure intact ice zone during spalling events serve as nucleation sites for the next spall event and associated load drop. The roughly central location of the small cracks, and their distribution, determines the size and shape of the next spall. While the present test was conducted on a large single crystal of ice at a relatively small scale in the laboratory the results are probably relevant to the case of polycrystalline ice at various scales. This type of study was made possible through the use of a very high speed imaging system with adequate resolution.
5. Acknowledgements
The author would like to thank the Program of Energy Research and Development (PERD) and IOT for their financial support of this research. The author is also grateful to Austin Bugden for technical assistance during the test program.
6. References
Baumann, K., Bilgram, J.H. and Känzig, W. 1984. Superheated ice. Z. Phys. B, 56(4), 315-325.
Gagnon, R.E. 1994. Melt Layer Thickness Measurements During Crushing Experiments on Freshwater Ice. Journal of Glaciology, 1994, Vol. 40, No. 134, 119-124.
Gagnon, R.E. 1998. Analysis of Visual Data from Medium Scale Indentation Experiments at Hobson’s Choice Ice Island. Cold Regions Science and Technology, Vol. 28, 45-58.
Gagnon, R. E. 1999. Consistent Observations of Ice Crushing in Laboratory Tests and Field Experiments Covering Three Orders of Magnitude in Scale. Proceedings of the 15th International Conference on Port and Ocean Engineering under Arctic Conditions, POAC-99, Helsinki, Finland, Vol. 2, 858-869.
Gagnon, R. E. and Bugden, A. 2007. Ice Crushing Tests Using a Modified Novel Apparatus. Proceedings of POAC-07, 235-244.
Gagnon, R.E., Tulk, C. and Kiefte, H. 1994. Internal Melt Figures in Ice by Rapid Adiabatic Compression. Journal of Glaciology, 1994, Vol. 40, No. 134, 132-134.
Knight, C.A. and Knight, N.C. 1972. Superheated ice: true compression fractures and fast internal melting. Science, 178(4061), 613-614.