Interstate Shifting of State and Local Taxes
by
F. RON JONES
B.A., University of Florida
(1965)
M.P.A., Golden Gate University
(1973)
M.C.P., Univefsity of California at Berkeley
(1975)
SUBMITTED IN PARTIAL FULFILLMENT OF THE REQUIREMENTS OF THE
DEGREE OF
DOCTOR OF PHILOSOPHY at the
MASSACHUSETTS INSTITUTE OF TECHNOLOGY
June 1981
F. Ron Jones 1981
The author hereby grants to M.I.T. permission to
repro-duce and to distribute copies of this dissertation
doc-ument in whole or in part.
Signature of Author
Certified by_
Accepted by U/ ''SACHLSETTS INSTiTTE OF TECHNOLOGYAUG
11
1981
Depar ment f Urban Studies and Planning March 12, 1981
Karen R. nske Dis dtatkn S per isor
Lawrence Susskind Department Head
INTERSTATE SHIFTING OF STATE AND LOCAL TAXES
by
F. RON JONES
Submitted to the Department of Urban Studies and Planning
on March 12, 1981 in partial fulfillment of the
requirements for the Degree of Doctor of Philosophy in
Urban Studies and Planning
ABSTRACT
A inultiregional input-output model was modified to
allow the tracing of each state and local tax from the
states of initial
incidence to the states of final
in-cidence.
This modified model is
capable of determining
the interstate incidence of state and local taxes using
any set of assumptions about the extent to which each
state and local tax is borne by labor, capital, or
con-sumers.
The modified multiregional input-output model was
used to determine the 1962 interstate incidence of state
and local taxes, using the assumption that all taxes on
business are shifted 100 percent to consumers. The
re-sults suggest that 40 percent'of total state and local
taxes is borne by nonresidents of the taxing states and
that the interstate shifting of state and local taxes
re-sults
in substantial redistribution of wealth among the
states.
This shifting of state and local taxes to
non-residents reduces the non-residents' cost of state and local
public-sector goods and services below the true cost (to
the extent that exported taxes exceed exported benefits)
and, consequently, creates an incentive for the residents
to expand the state and local public sectors beyond what
is economically efficient from a national perspective.
The result may be a substantial transfer of resources
from the private sector to the public sector.
Dissertation Supervisor:
Dr. Karen R. Polenske
Title:
Associate Professor of Urban
and Regional Studies
My greatest debt is to Karen R. Polenske for the en-couragement and the financial and emotional support that are essential for the completion of such an undertaking. Professor Polenske devoted far more time to guiding me during my research and to suggesting improvements in the numerous drafts of the dissertation than could reasonably have been expected. She has my sincerest gratitude.
I also am indebted to Professor Polenske for the use of her multiregional input-output model and for giving me access to the documentation of its construction, which made it possible to modify the model for the purposes of
this study.
Very speacial thanks go to the University of Illinois at Chicago and, particularly, to its School of Urban Sci-ences for granting to me especially generous use of their computer facilities and other support services. The re-latively unrestricted use of the University's computer fa-cilities made possible a far more sophisticated analysis than otherwise, would have been possible. I also thank the School of Urban Sciences for allowing me to carry a lighter than average teaching load during the period of my research.
Special thanks also are due William C. Wheaton for his role in the genesis of my research and for suggesting several important modifications and additional factors to be considered along the way. When I was searching for a dissertation topic, Professor Wheaton suggested that addi-tional research was needed in the area of interstate tax shifting, and I thank him for getting me started and for keeping me on course. I hope he finds that the final pro-duct justifies his entrusting me with his idea.
David Kresge read drafts of the dissertation and sug-gested changes that brought me back on course when I
strayed toward conclusions not substantiated by the data. The final product is much improved because of his efforts, and I thank him for that.
Willam Crown gave generously of his time when I needed help with computer programming and with the
modi-fication of the input-output model, and I thank him for his expert assistance.
of Technology.
Finally, and most important of all, a very personal thank you to Marilyn Shulman. She made it possible. She made it enjoyable. Thank you Marilyn!
PAGE
Abstract... ii
Acknowledgments... iii
List of Tables.. Vii List of Figures... x
Key to Abbreviations... xii
Chapter I Introduction... 1
Chapter II Methodology ... 18
McLure's Methodology..., ... .. 20
Short Run Versus Long Run... 20
Tax Incidence Analysis...-... 21
Economic Sector ...--- 23
Structure of Economic Sectors ... 24
Tax Shifting--- -... 27
Summary--- ---... 35
Methodology Used in This Study-... 37
Economic Sectors- -... 45
Tax Categories- ---... 67
Importing- -... 104
Chapter III Results... 110
Chapter IV Conclusions... 153
Appendix A Adjustment of the MRIO Model... .. A-1
Appendix B Calculation of the Percentage of Output
Produced by Unincorporated Business... B-l Appendix C Composition of Sectors Used in This Study... C-1
Appendix D Computer Programs... D-l
Appendix E Sources of Distributional Vectors and
Matrices... E-l
PAGE
Appendix F
Appendix G Appendix H
Calculation of the Percentage of Life-Insurance Premiums Paid by
Individuals and by Business... Commutation Rates... Percentage Distribution of Individual
SLG Taxes... Bibliography
...
... BIB-1 vi F-1 G-1 H-1Table Page
2-1 Federal-Offset Rates 41
2-2 Distribution of Taxes Shifted to
Commuters 106
3-1 Percentage Distribution of Total
State and Local Taxes 113
3-2 Distribution of Total State and
Local Taxes 129
3-3 Origin of Imported Taxes in Percentages 137
3-4 Contribution of Each SLG Tax to Tax
Exportation 145
3-5 Residuals 150
A-l Distribution of Twenty-One Construction
Categories Among Four Purchasing Sectors A-4
A-2 Distribution of Twenty-One Construction
Categories Among Ten Purchasing Sectors A-7
B-1 Output of the Agriculture Sector
Produced by Unincorporated Business B-4 B-2 Output of the Mining Sector Produced by
Unincorporated Business B-5
B-3 Output of the Construction Sector Produced
by Unincorporated Business B-6
B-4 Output of the Manufacturing Sector
Produced by Unincorporated Business B-7
B-5 Output of the Commercial Sector Produced
by Unincorporated Business B-8
E-1 Distributional Vectors E-2
Table Page
E-2 Matrices (51x51) Showing the Percentage Distribution of Each Sector's Output
Among Consuming States E-13
E-3 Matrices (llx51) Showing the Percentage
Distribution of Each Sector's Output E-14 Among Consuming Sectors
E-4 Matrices (51x51) Showing the Percentage Distribution Among the States of
Importers of Exported Taxes E~16
F-i 1962 Life-Insurance-Premium Rates F-2
F-2 Purchasers of Group Life Insurance in
1968 F-3
F-3 Life-Insurance Premiums Paid by
Individuals and by Business in 1962 F-4 F-4 Nonlife-Insurance Premiums Paid by F-7
Individuals
H-1 General-Sales and Gross-Receipts Taxes H-2
H-2 Corporation-Income and -Franchise Taxes H-3 Motor-Fuel Tax H-22 H-4 Motor-Vehicle Licenses H-32 H-5 Property Tax H-42 H-6 Insurance-Premium Tax H-52 H-7 Public-Utility Tax H-62
H-8 Tobacco and Alcoholic-Beverage Taxes H-72
H-9 Individual-Income Tax H-82
H-10 Death and Gift Taxes H-92
H-102
H-11 Severance Tax
H-12 Amusement and Parimutuel Taxes H-112
Table Page
H-13 Miscellaneous Taxes H-122
H-14 Hunting and Fishing Licenses H-132
H-15 Kentucky Distilled-Spirits Property Tax H-142
H-16 Delaware Corporation-Franchise Tax H-152
Figure Page 2-1 Distribution of Taxes Borne by
the Agriculture Sector 48
2-2 Distribution of Taxes Borne by
the Mining Sector 50
2-3 Distribution of Taxes Borne by
the Construction Sector 54
2-4 Distribution of Taxes Borne by
the Manufacturing Sector 55
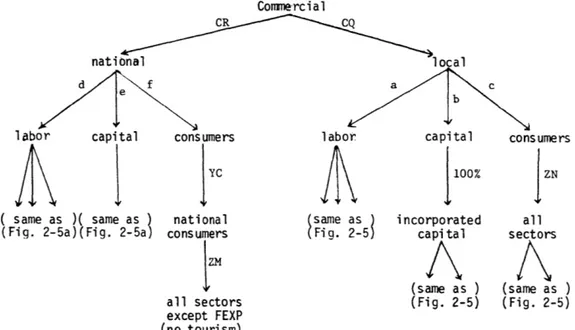
2-5 Distribution of Taxes Borne by
the Commercial Sector 59
2-6 Distribution of Taxes Borne by
the FG-Enterprise Sector 62
2-7 Distribution of Taxes Borne by
the SLG-Enterprise Sector 63
2-8 Distribution of General-Sales and
Gross-Receipts Taxes 69
2-9 Distribution of Corporation-Income
and -Franchise Taxes 76
2-10 Distribution of Motor-Fuel Taxes 80
2-11 Distribution of Motor-Vehicle Licenses 83
2-12 Distribution of Property Taxes 84
2-13 Distribution of Insurance-Premium Taxes 89
2-14 Distribution of Public-Utility Taxes 93
2-15 Distribution of Tobacco and
Alcoholic-Beverage Taxes 94
2-16 Distribution of Individual-Income Taxes 96
2-17 Distribution of Death and Gift Taxes 98
Figure Page
2-18 Distribution of Severance Taxes 98
2-19 Distribution of Amusement and
Parimutuel Taxes 99
2-20 Distribution of Miscellaneous Taxes 100 2-21 Distribution of Hunting and Fishing
100
Licenses
2-22 Distribution of Kentucky Distilled- 102 Spirits Property Tax
2-23 Distribution of Delaware Corporation- 103
Franchise Tax
CPU Central processing unit
D.C. District of Columbia
FEXP Foreign exports
FG Federal government
FG-FD Federal government final demand
GPCF Gross private capital formation
GPO Government printing office
MRIO Multiregional input-output
NINV Net inventory change
OPEC Organization of petroleum
exporting countries
PCE Personal consumption expenditures
pt. part
SIC Standard industrial classification
SLG State and local government
SLG-FD State and local government final
demand
Introduction
Fiscal federalism in the United States suggests a certain fiscal independence among the states and between the states and the federal government. The theory of fiscal federalism is, in part, that each state is free to raise as much revenue through its tax system as it desires and to provide with that revenue whatever bundle of public goods and services it
chooses. Fiscal federalism is generally viewed as a means
by which the differing desires of persons for publicly
provided goods and services can be efficiently met. That is, those persons desiring the same bundle of public goods and services are free to group geographically and to agree to tax themselves the amounts needed to pay for the public goods and services they desire. They may spend their money in the way that provides them with the greatest utility. They are not, in theory, forced to share in the cost of something desired
by another member of the community but not desired by them,
because all members of the community desire the same things. In practice, of course, there are not an infinite number of communities offering infinitely different bundles of public goods and services. But there are a number of different
communities, and those communities do provide differing types and levels of public goods and services. All that is required by an economic efficiency criterion is, ceteris paribus, that individuals join the community whose bundle of public goods and services most closely approximates the bundle desired by the individuals, and that those individuals pay for what they receive.
This view of fiscal federalism is a view of an efficient market for publicly provided goods and services. That is,
those persons receiving the public goods and services enjoy the full benefit of them and, at the same time, pay the full cost of them, and decide on the mix of publicly and privately provided goods and services that results in the total bundle of goods and services being provided in the most efficient manner, that is, at the lowest total opportunity cost.
However, the interstate shifting of state and local government (SLG) taxes suggests that the view of fiscal federalism as a mechanism for the efficient allocation of resources may be seriously flawed. If the incidence of SLG taxes is not confined to residents of the taxing jurisdictions, the economic efficiency of the interstate allocation of
resources and, perhaps, the equity of the interstate
distribution of income may be adversely affected. When the burden of a tax levied in one state falls partially upon the
residents of another state, the cost of government services to residents of the first state is reduced below the true
cost (to the extent the exported tax exceeds exported benefits) and the income of the residents of the other state is reduced
by the amount of the imported tax (minus imported benefits).
The most obvious way in which tax exportation occurs is through taxes on tourists, such as the tax on gambling in Nevada and the tax on hotel rooms in Florida. Less obvious,
but much more significant, are taxes on business. These taxes are shifted forward to consumers in the form of higher prices and/or shifted backward to -labor and/or owners of capital. When the consumers, laborers, or owners of capital are non-residents of the taxing jurisdiction, tax exportation occurs. Perhaps even less obvious is the exportation of SLG taxes to
the federal government (FG). Most SLG taxes may be deducted from income subject to the federal income tax; thus, most SLG taxes are borne in part by the FG and, in turn, by residents of all fifty states.
To the extent that SLG taxes are exported, the reality of fiscal federalism is that residents of one state provide
themselves with their desired bundle of public goods and services by taxing not themselves, but rather the residents of other states. In other words, the benefits and costs of
these goods and services are not experienced by the same persons. The resulting economic inefficiency is obvious: resources are diverted from the private sector to the public sector even though the total cost of the goods and services provided by the public sector with these resources,.is greater
than if they were provided by the private sector (assuming an efficient equilibrium prior to the shifting of any taxes). The reason the residents of a state divert the resources is, of course, that they do not bear the full cost. They receive all of the benefits, but shift some of the cost to nonresidents
by exporting SLG taxes. In other words, tax exportation
results in an economically inefficient expansion of the SLG public sector due to a change in relative prices. That is,
the provision of a good by the public sector appears to a buyer in state "g" to be cheaper than the provision of the
same good by the private sector, because the buyer pays,
ceteris paribus, the full cost of the private-sector good and
only part of the cost of the publid-sector good., The 'rerhainder of the cost of the public-sector good is paid by residents of the
states that import taxes from state "g."
The extent to which tax exportation results in expansion of the SLG public-sector is dependent upon both the price elasticity of demand for SLG public-sector goods and services
and the change in relative prices between the public sector and the private sector. A reduction in public-sector cost
relative to private-sector cost creates an incentive for the public sector to provide.certain goods and services that currently are provided by the private sector. In addition, a reduction in cost creates an incentive to increase the provision levels of those goods and services that are transferred from the private sector to the public sector, as well as the provision levels of those goods and services that already are provided by the public sector. This increase in provision levels is a function of the price elasticity
of demand.
Thus far, the research on public-sector price elasticities provides no satisfactory answer of what the public's response
is to a change in prices, although the work that has been done suggests that an elasticity on the order of 0.5 may be in the ballpark. To apply such an elasticity to the results of
this study, it must be recognized that the elasticity is based upon current prices, that is, upon the prices of public-sector goods and services after tax exportation occurred. Therefore, to estimate the extent of the increase in provision levels
that is due to tax exportation, it is necessary to work backward. In other words, the elasticity of 0.5 was computed on the
that taxes are exported. (This, of course, assumes that
SLG goods and services are financed entirely by SLG taxes.)
For example, if 40 percent, say, of SLG taxes are exported and if tax exportation were eliminated, public-sector prices would rise from 60 percent of true cost to 100 percent of true
cost, an increase of 67 percent. Consequently, an elasticity of 0.5 would suggest that the provision level of public-sector goods and services is 33 percent higher than it would be if tax exportation did not exist. However, it must be pointed out that the elasticity of 0.5 is a point elasticity and that
an arc elasticity, especially one that would cover a range of
67 percent, may be significantly different, either higher or
lower. In the absence of research on such arc elasticities and on the public's response to changes in relative prices, no quantitative estimate can be made of the change in the size of the SLG public sector that is due to tax exportation.
It should be noted that there is no balancing of exported taxes by imported taxes. Exported taxes create the price
effect that results in the substitution of public-sector goods for private-sector goods. Imported taxes, on the other hand, create an income effect, that is, they reduce disposable
income and, thus, cause a reduction in demand for all goods. and services, both public and private.
The interstate shifting of SLG taxes also may influence location decisions. If all states export the same percentage of their taxes and import the same percentage of other states'
taxes, there results, ceteris paribus, no advantage in being
located in one state rather than another. But if the exportation or importation rates differ - as they do - there is an economic incentive to locate in the states with the higher exportation and lower importation rates. * Such an incentive tends to result in inefficient location decisions, that is, location decisions that do not weigh the full social costs and benefits
of the actions.
There also may result inefficiencies in the selection of the means of financing public goods and services. For instance, a state may decide to institute a sales tax instead of an
individual-income tax, solely because the sales tax is more
exportable, even though it may be a more costly tax to administer. Note too, that the question of equity arises here. A
progressive individual-income tax is usually considered to be a more equitable tax than a sales tax, which often is a
regressive tax. But the low exportability of individual-income taxes encourages the use by SLG of more inequitable taxes.
* It should be noted that firms' location decisions may not be responsive to interstate tax differentials 2 and that, if exported taxes are offset by increased SLG expenditures, households can relocate to obtain increased services but not to obtain lower taxes.
This study attempts to shed some light on the reality of fiscal federalism by examining the interstate shifting of SLG taxes. This shifting has been the subject of only one
other study of national scope. That study, by Charles E. McLure, Jr., constitutes for all practical purposes the
literature in the field and is reviewed in detail in Chapter II. This study, building upon McLure's analysis, calculates for
each of the 51 states (including the District of Columbia) the percentage of each SLG tax that is shifted to each of the other states. The differences between the two studies, as well as the modifications and refinements made in McLure's
figures for the purposes of this study, are discussed in Chapter II.
To calculate the amount of exported taxes imported by each state from all other states, this study uses the multiregional
input-output (MRIO) model developed by Karen R. Polenske. This MRIO model comprises two basic sets of data: a
79-industry input-output table for each state showing the sales of each industry's output to each of the 79 industries and to the six components of final demand * and a trade-flow table
* They are: personal consumption expenditures (PCE), gross private capital formation (GPCF), net inventory change (NINV),
foreign exports (FEXP), federal government final demand (FG-FD), and state and local government final demand (SLG-FD).
for each of the 79 industries showing the flows of goods and services among all 51 states (see Appendix C for a
3
listing of the 79 industries). The adaptation (as discussed in Appendix A) of the MRIO model for the purposes of this
study provides a powerful new tool for the analysi,s of
interstate tax incidence. The lack of such a tool required previous studies to make very gross assumptions about the
final interstate distribution of private-sector goods and services and, consequently, the SLG tax component of their cost, and to ignore the intermediate sales that occurred prior to the sales to the ultimat-e consumers, which meant that any shifting of SLG taxes to intermediate consumers had to be
omitted. The MRIO model eliminates the need for many of these rather questionable assumptions and provides a means for
including the shifting of SLG taxes to intermediate consumers. The result should be a much more precise view of the interstate
incidence of SLG taxes.
Both McLure's study and this one ignore the patterns of government expenditures and the incidence of their benefits in order to concentrate upon the exporting and, in the case of this study, the importing of SLG taxes. However, if exported
(imported) taxes reflect exported (imported) benefits of
of publicly and privately provided goods and services occurs. An economically efficient distribution of resources is
maintained as long as those persons experiencing the benefits of public-sector goods and services pay the full cost of
those goods and services regardless of which states provide the goods and services and in which states the beneficiaries live. The ignoring of benefit exportation is due to the need to restrict the scope of the research reported here and does not imply that such exportation does not exist or is not significant. It could be argued, for instance, that the SLG taxes paid by interstate tourists and commuters are just
compensation for the benefits they receive from SLG
expenditures in the states they visit. It also could be
argued that SLG expendit'ures in any given state have beneficial spillover effects on other states. For example, some of the benefits of educational expenditures are exported through
migration, and it is often argued that educational expenditures in one state benefit persons in all other states because an educated public contributes to everyone's welfare through
national economic growth and through more enlightened involvement in the nation's social and political institutions. The
determination of the extent to which the amount and interstate distribution of exported taxes reflect the amount and
interstate distribution of exported benefits must await further research. The research reported here addresses only the tax side of the question.
Discussed in this report are the procedures to be
followed in tracing SLG taxes to the final bearerso.using any set of assumptions about the extent to which such taxes are shifted to labor, capital or consumers. However, due to the
limited resources available for this study and the large amounts of computer time required for the calculations under
each set of assumptions, * the actual calculations in this study have been limited to one set of assumptions.
This limitation required the determination of what set of tax-shifting assumptions would prove most useful from a
public-policy standpoint. Partly for the reasons discussed below and partly because the MRIO model's unique contribution to this type of analysis is its ability to trace taxes shifted
to consumers from the initial consumers through all intermediate consumers to the final consumers, it was decided to assume
that all SLG taxes on business are shifted 100 percent to
* For example, computer programs Dl through D4 and D6 and
D7, referenced in Appendix D, require approximately 70 minutes
of CPU time each, and computer program D5 uses 84 minutes of
consumers, thereby making full use of the model's potential. This assumption cannot, of course, be justified by economic
theory, which suggests that the burden of most such taxes is shared by labor, capital and consumers or, in the case of the corporation-income tax, is borne entirely by capital. However, as a practical matter, there exists no consensus about the
relative sizes of the burdens borne by labor, capital and consumers and, in the case of the corporation-income tax, Musgrave offers evidence that, contrary to theory, the tax
4
may be shifted entirely to consumers. In fact, throughout econimic literature much support is given to the notion that
SLG taxes on business are shifted entirely to consumers. But
more important, from a public-policy viewpoint what an analyst usually wishes to do is 'determine what the best possible or
worst possible case is, given that the exact case is unknowable. In other words, a policy analyst wishes to know the boundaries or extremes of a situation in order to determine, first, if there is or is not a potential problem and, second, what the orders of magnitude are. This report not only presents one of the extremes, but presents the extreme that is most likely to
approximate the true case.
A case in point is the current controversy over increases
particularly coal. The United States Congress has expressed concern that such states are beginning to take advantage of their monopolistic positions to become "mini-OPEC's." The
debate on this issue has assumed, whether accurate or not, that 100 percent of severance taxes is passed forward to consumers, and whatever public policy may evolve from this
debate undoubtedly will be made on the basis of that assumption. Given the nature of the political process, it is reasonable
to expect this assumption to be, if not ubiquitous, certainly more prevalent than any other. Consumers generally believe that businesses pass all taxes forward, and to policymakers in the political arena the public's perception often is more important than the reality-especially when the reality is unknown.
- This study's results, presented in Chapter III, suggest that 40 percent of total SLG taxes is exported and that the rate of exportation ranges from 27 percent in California to
57 percent in Wyoming and is 42 percent in the average state.
McLure's study, on the other hand, concludes that states export from 15 percent (Maine) to 35 percent (Delaware and Nevada) of their SLG taxes and that 20 percent of total SLG
5
taxes is exported. This study also suggests that the
a family of four in Mississippi to a high of $593 in Nevada. Applying to these figures a straight percentage increase of
423 percent in SLG taxes from 1962 to 1977 (as will later be evident, the results obtained by applying 1962 exportation
and importation percentages to current tax dollars are suggestive only of the orders of magnitude involved), the total amount of SLG taxes exported in 1977 would be $90.1 billion, and the amounts imported would vary from $983 for a family of four in Mississippi to $3,101 in Nevada. In other words, not only are significant amounts of SLG taxes being exported, the amounts of taxes imported vary greatly among
the states.
The results presented in Chapter III are for the total of all SLG taxes. The underlying detail, that is, the exportation and importation rates for each individual SLG tax, is presented in Appendix H. Included in that Appendix is a table for each
SLG tax, showing the percentage of that tax that is shifted
from each of the taxing states to residents of each of the
51 states. These tables make it possible to calculate the
economic impact a change in tax rates in one state will have on any other state. For instance, the results of this study permit policymakers to determine the initial economic impact the recent 30 percent increase in Montana's severance tax
on coal will have on each of the other states. Given this knowledge, policies to restrict the use of the severance tax, or to subsidize those states hardest hit, can be more
rationally and precisely.designed.
It must be noted that the input-output model used in this study was constructed on the basis of the technology in use
in 1963 and on the basis of the trade flows among states at that time. These, of course, change over time, weakening the predictive power of such models. Models of this type are
generally considered to be quite accurate for five to ten years and to approach the limit of their usefulness after about
twenty years. The quickness of these changes will vary from industry to industry, though. For instance, the location of the coal industry is quite stable over time, as is the location of its major consumers, such as the steel industry. And the technology of steel production is relatively unchanged from
1963. Therefore, the analysis of the distribution of severance
taxes presented in Table H-11 is relatively useful for current policymaking purposes. But in most cases, the results should be viewed as describing the situations that existed in 1962,
and their use in current policy analysis should be tempered
by an examination and understanding of relevant changes in
technology and trade flows that have occurred since 1963 (the MRIO model base year).
In addition to changes affecting the model itself, there have occurred other changes since 1962 that reduce the
applicability of the results to today's distribution of
SLG taxes. For example, SLG taxes on alcoholic beverages
no longer are deductible from federal-individual-income-tax liability, which means that a smaller percentage of these taxes is exported today.
It would have been possible to adjust for some of the changes that have occurred since 1962 and thereby to have presented a somewhat more accurate picture of the current
situation. However, since it was impossible with the resources available to update either the MRIO model or McLure's figures, a "true" picture of the distribution of today's taxes would still have been impossible. In the interest of future
research, it was decided that a true picture of some year, albeit 1962 (the fact that the MRIO data are for 1963 should cause no noticeable distortion), and the methodological
framework for future analysis of more current years was more important than a slightly more accurate but still faulty description of today's situation.
The previous research in the field of tax exportation is reviewed in the next Chapter. The methodology used in this. study also is discussed in detail in Chapter II and is compared with the methodology of the previous research. The results
obtained by this study are presented in Chapter III, and the
NOTES FOR CHAPTER I
Helen F. Ladd, "Local Education Expenditures, Fiscal Capacity, and the Composition of the Property Tax Base,"
National Tax Journal, Vol. 28, No. 2 (June 1975), pp. 145-158.
E. M. Gramlich and H. Galper, "State and Local Fiscal Behavior
and Federal Grant Policy," Brookings Paper on Economic Activity, Vol. 1 (1973), pp. 15-58.
R. P. Inman, "Towards an Econometric Model of Local Budgeting," National Tax Association Papers and Proceedings (1971),.
pp. 699-719.
R. P. Nathan, A. D. Manuel, and S. E. Calkins, Monitoring
Revenue Sharing (Washington: The Brookings Institution, 1975).
J. C. Weicher, "Aid, Expenditures, and Local Government
Structure," National Tax Journal, Vol. 25 (1972), pp. 573-584.
2
John F. Due, "Studies in State-Local Tax Influences on
Location of Industry," National Tax Journal, Vol. 14 (June 1961.).
3
For a complete description of the MRIO model and data, see Karen R. Polenske, ed., Multiregional Input-Output Analysis
(5 vols.; Lexington, Ma.: Lexington Books, D. C. Heath and
Company, various publication dates).
4
Marian Krzyzaniak and Richard A. Musgrave, The Shifting of the Corporate Income Tax (Baltimore: Johns Hopkins Press, 1963).
5
Charles E. McLure, Jr., "An Analysis of Regional Tax Incidence, with Estimation of Interstate Incidence of State and Local Taxes" (unpublished Ph.D. dissertation, Princeton University, 1965), pp. 15, 317, 319.
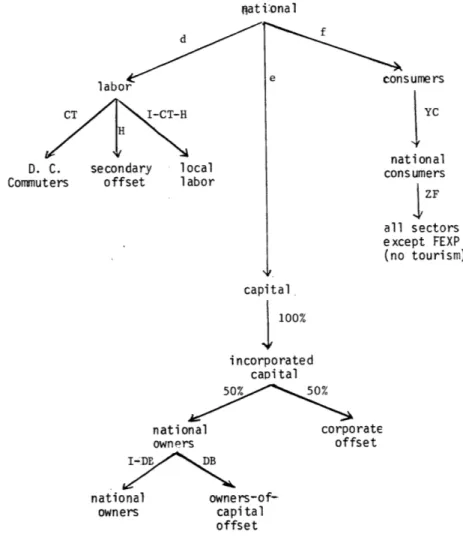
Methodology
The calculation of the amounts of SLG taxes that are
exported and imported by each state requires, first, the
determination of how each SLG tax is distributed among
the various economic sectors, such as manufacturing and
mining, second, the determination of how the taxes on each
of these sectors is distributed among labor, capital, and
consumers (except as otherwise noted, land is considered
part of capital), and, third, the determination of how
these tax bearers are distributed among the states.
The
means of calculating these distributions and, hence, the
amounts and interstate distribution of exported SLG taxes
are discussed in this chapter.
The methodology described in this chapter may be
used with any set of assumptions about the distribution
among labor, capital, and consumers of taxes on business.
(As will be discussed later, the amounts and interstate
distribution of exported taxes are significantly affected
by different assumptions about the distribution of taxes
among labor, capital, and consumers.)
For instance, if an
allocation of taxes between only two of these tax bearers
or to only one of them were desired, the same methodology
would be followed except that the steps involving the,
omitted bearer would be skipped. The results reported in Chapter III were obtained by following the methodology described in this chapter after omitting all references
to labor and capital.
Although the methodology used in this study to calculate tax exportation rates is largely the same as that used by McLure in his study of tax exportation, the methodology discussion presented here is divided into two sections. The first section, titled McLure's Methodology, describes and critiques the methodology used by McLure. That section
includes a discussion of (1) the impact of alternate assumptions about the mobility of capital in response to
tax differentials, (2) the impact of alternate methods of tax-incidence analysis, (3) the economic sectors
(manufacturing and commercial for example) used by McLure, (4) the division of those sectors into their "local" and "national" components, and (5) McLure's assumptions about the extent to which taxes are shifted to labor, capital, and consumers.
The second section of this chapter includes a discussion of the methodology unique to this study as well as a discussion of the differences between the economic sectors used by
McLure and those used in this study, and a discussion of the different approach used in this study to divide the sectors
into their local and national components. Included in this section are separate discussions of the methodology used for each SLG tax and the presentation of the methodology used to calculate tax-importation figures.
McLure's Methodology* SHORT RUN VERSUS LONG RUN
McLure takes the twenty tax categories given in the
1962 Census of Governments, does some selected aggregating
and disaggregating of these categories, and then calculates both short-run and long-run exportation by each state of each tax category. The difference between the short-run and long-run estimates is due to McLure's assumption that in the short run capital bears much of the tax burden while in the long run the less mobile facts of production--land and labor--bear the bulk of the tax burden.** The result is McLure's estimate that in the long run tax exportation is about twenty percent less than it is in the short run. Although McLure's
assumption about the mobility of capital was a common one at the time, the currently prevailing opinion is that capital flows among states are not affected by state and local taxes because the differentials among states in such taxes are insignificant when compared with the differentials in other costs and factors influencing capital investment. In other words, the more accepted assumption today would be that the long-run results are no different from the short-run results.
*There are numerous exceptions to the general descrip-tions in this section of the procedures followed by McLure. Those persons interested in a more precise exposition of McLure's research should refer to McLure, "Regional Tax
Incidence".
**McLure actually assumes that only the capital used in manufacturing is mobile in response to tax differentials and that all other capital is immobile.
Consequently, even though the concern of the research reported
here is with the continuing relationship among the states
rather than the initial impact of a new tax, McLure's
short-run exportation results are used in this study to
calculate long-run importation estimates.*
TAX-INCIDENCE ANALYSIS
The first question addressed by McLure is the method of
tax-incidence analysis to use. His choice of differential analysis seems to be the obvious one and is difficult.to fault if traditional incidence analysis is accepted.** (Differential analysis assumes that, for any given tax increase, firms will increase their prices by the amount of the tax increasethat is common to all competing firms. The amount of the tax increase that is not common, that is, the differential, must be absorbed by the factors of production.) However, -within differential analysis there are two reasonable
ways to estimate the amount of tax shifting--and the choice between them is not obvious. They are identified by McLure as the "Michigan approach" and the "Wisconsin approach" (based upon their use in tax-exportation studies in the respective states).
*Except as otherwise noted, al'l references to McLure's
results and supporting assumptions are to his short-run results and assumptions.
**For a discussion of the various methods of tax-incidence analysis, see any good general public-finance textbook. It
should be noted that there is great difference of opinion as to how taxes are shifted and that the accuracy of current theories and methods of incidence analysis is problematic.
Under the Michigan approach, each state is studied in isolation, and the state under study is assumed to be -the only
state levying the tax in question. In other words, the tax differential between the taxing state and all other states
is the entire amount of the tax.* McLure concludes that this means that a firm in the taxing state in a nationally competitive industry would be unable to shift to consumers any of the tax, due to competition from the untaxed firms in all other states.
Under the Wisconsin approach, the tax in question is examined in all states at the same time because it is assumed
that the tax differential between one state and all other states is only that portion of the tax in excess of the level of
taxation common to all states. This means, according to
McLure, that firms in a nationally competitive industry would be able to shift to consumers all of the tax except for
the differential--which of course is also true of the Michigan approach, but there the entire tax is the differential.
The practical distinction between these two approaches, as used by McLure, is that under the Michigan approach
taxes are more likely to be -capitalized, while under the Wisconsin approach they are more likely to be shifted
to consumers. Since for firms in nationally competitive
*McLure assumes that the local taxes in each state are uniform throughout the state and, thus, that there are no differentials among local jurisdictions within the
industries--the only industries whose tax treatment would be
affected by the choice of approaches--McLure uses almost
iden-tical export rates for both capitalized taxes and taxes
shifted to consumers, the choice of approaches has little or
no impact upon McLure's results.
ECONOMIC SECTORS
Using a variety of methods, McLure calculates for each
state the percentage of each tax initially
borne by various
economic sectors. For instance, he assumes that in each
state
"if more than 97.5 percent of all state and
local property taxes are local property taxes
or state general property taxes the entire
amount may be allocated [to the various economic
sectors] on the basis of valuations for local
taxation. But where more than 2.5 per cent
of all property taxes in a state are special
state levies [he] examine[s] the state taxes in
detail to determine the pattern of their
incident."1
Apparently to simplify his calculations and
presenta-tion, McLure generally distinguishes between only the
commercial and manufacturing sectors. For some of the taxes
he does calculate the percentages borne by the agriculture,
mining, and personal consumption sectors and by various
components of the commercial sector, such as trucking and
public utilities, but nowhere does he make reference to the
construction, government, or foreign-export sectors.
It
appears he omits the foreign-export sector, which would cause
a slight understatement of tax exportation, but it is not
clear if he omits the construction and government sectors
or just includes them within his other sectors.
If they are
omitted, it presumably is due to the relatively insignifi-cant amount of taxes borne by these sectors and their even
smaller contribution to tax exportation. Although McLure does not indicate what the composition of his sectors is, it is
assumed that his industrial aggregation is the usual one and, thus, that each of his sectors includes the,,exact same industries as the sectors used in this study (see Appendix C for the sector compositions used in this study).
STRUCTURE OF ECONOMIC SECTORS
As previously indicated, McLure assumes that the amount and direction of tax shifting is largely a function of the nature of the competition within each sector. To describe the nature of the competition, McLure classifies each of his sec-tors in each state as local or national to indicate the extent of spatial competition and, in the case of national subsectors, as dominant or nondominant to indicate the amount of market concentration.
An industry is considered local by McLure when all of the competitors face the same taxes, which for all practical purposes would occur only when all sellers and buyers are
located within the same state. McLure considers an industry to be national when firms in one state are in competition with firms in other states.* Dry cleaning, for example, is a local
*McLure uses four-digit SIC codes to divide the manu-facturing sector into its local and national components. Specific divisions of the other sectors either are not made or are made only for selected states through an analysis of the markets for specific commodities. (See McLure,
industry, while aircraft manufacturing is a national industry,
according to McLure's definition. McLure also assumes that
local industries are locally owned (that is, that the owners
live within the state in which the industry is located) and
sell only to local consumers (that is, that all sales are made
within the state in which the industry is located).
He
simi-larly assumes that national industries are nationally owned
(that is, that the owners are stockholders in general in the
United States and are distributed among the states in
propor-tion to each state's share of dividends paid in the napropor-tion)
and sell only to national consumers (that is, that the
con-sumers are distributed among the states in proportion to
each state's share of retail sales in the United States).
If a state accounts for 40 percent or more of national
value added in an industry or, in the case of an
oligopolis-tic industry, 25 percent, that industry in that state is
considered dominant by McLure.
He considers all other
indus-try to be nondominant.
McLure makes several exceptions to the above
classifica-tion scheme, however. He considers the agriculture sector
to be partly a local sector and partly a national
non-dominant sector, but assumes that it is locally owned.
Ob-viously, this assumption is not entirely accurate, because
a significant amount of agriculture output is produced
by nationally owned agribusinesses.
It
also might be argued
that some components of the agriculture sector often
operate in a oligololistic manner and, therefore, that in some states those components should be considered dominant.
McLure divides the mining sector into a dominant national component and a combined local and nondominant national
component. The manufacturing sector, on the other hand, he divides into local, dominant national, and nondoininant
national subsectors in each state as suggested by the above classification description. He considers the commercial sector to be local except in the cases of the corporation-income tax (when he considers 32.5 percent of the commercial sector in each state to be national) and the Kentucky
distilled-spirits property tax (when he considers the commercial sector to be national).3 The long-distance for-hire
trucking component of the commercial sector is also considered by McLure to be national in the cases of the motor-fuel and motor-vehicle-license taxes, as is the
railroad component in the case of the property tax. However, even allowing for these exceptions, the commercial sector is not a local sector to the extent McLure assumes. Many supermarkets and department stores, for example, are parts of national chains, and insurance companies and many other commercial businesses derive a significant portion of their revenue from interstate sales. McLure's assumption in this case apparently is due to the difficulty of dividing the
commercial sector into its local and national components. Note that when McLure does split the commercial sector
into local and national components for the corporation-income tax, he uses a constant percentage for every state rather than
calculating a separate percentage for each state as he does for the ranufacturing sector. As will be seen later, this difficulty can be overcome through use of the MRIO model.
TAX SHIFTING
McLure next makes some assumptions about the- ability of the various sectors to shift taxes backward to land and labor and forward to consumers, and the extent to which taxes remain on capital. All taxes, other than profit taxes (that is, corporation-income and -franchise taxes), on local sectors are assumed by McLure to be shifted to
local consumers, although McLure does acknowledge that nonprofits taxes on local manufacturing might be more properly treated as though borne by capital.*4 McLure
assumes that profits taxes on local sectors, other than the public-utilities component of the commercial sector, are borne
by capital. All taxes, including profits taxes, on
public utilities are assumed by McLure to be shifted to local consumers. In the short run McLure assumes, if the state dominates the industry, that taxes on national
manufacturing are borne 40 percent by capital and 60 percent
by national consumers and, if not, that the taxes are borne
100 percent by capital.5 McLure's long-run assumption is
*The shifting of 100 percent of the taxes to local consumers requires that demand be completely inelastic. To the extent demand is not inelastic and, as a result, some of the tax is borne by capital, McLure's results are understated, because capital exports a greater percentage of the tax
shifted to it than do local consumers (see discussion later in this section).
that these taxes are borne 60 percent by land and labor, with the remaining 40 percent being borne by national
consumers if the state dominates the industry and by capital if it does not.6 McLure's assumption about the shifting of taxes on agriculture is.not clear, but it appears, at least in the case of the property tax, that he assumes that 100 percent of the tax on agriculture is borne by capital. In the case of mining he makes no distinction at all as to who bears the tax. He simply assumes that states export 25, 50, or 75 percent of the tax depending upon the market structure.7
Shifting to Consumers
The consumers of the output of the various sectors can of course be: other sectors; federal, state, or local
government; final individual consumers (personal consumption); and foreign countries. Personal consumption can be tourists -and commuters, in addition to local residents in the case of
local sectors and individuals in all states in the case of national sectors. However, McLure omits government, foreign countries, and commuters as possible consumers, thereby
understating to a slight degree the extent of tax exportation. He mentions in passing that other sectors can be consumers, but skips that intermediate-demand step by suggesting that
all of the output of each of his sectors goes directly to personal consumption. This is understandable, because to trace output through intermediate demand to final demand
requires an MRIO model, and none was in existence at the time of McLure's work. However, the omission of intermediate demand may cause serious distortions in McLure's results.
A simple and rather common example of this would be the case
in which the output of industry i
in
state g is
shipped to
industry
j
in state h for intermediate processing and then is
shipped back to state g for final processing. According to
McLure, if both industries i and
j
are dominant, approximately
60 percent of the taxes borne by industry
j
would have been
exported by the above transaction (that is, 60 percent of the
taxes are shifted to consumers).
However, still using McLure's
assumptions, industry
j
would have sent 60 percent of the tax
back to state g, so that the actual exporting by state g would
be 24 percent instead of 60 percent. In other words, McLure's
exportation rates are gross rates, that is, his rates represent
the amount of tax exported to all.states (51) rather than to
all other states (50).
As will be seen later, this problem
can be avoided by using the MRIO model to trace output through
numerous transformations to the final users. To recap, McLure
assumes that the consumers of local sectors are tourists and
local residents (which means that persons do not cross state
lines for the purpose of buying less-taxed goods and services)
and that the consumers of national sectors are individuals
who are distributed among the states in the same proportions
as retail sales.
Taxes are passed on to local consumers either as add-ons,
as with sales taxes, or in the form of higher prices.
In the
case of tax add-ons, consumers are able to "export" some of
the tax to the federal government by deducting the tax from
their federal income-tax liability.* (This deduction is hereafter.referred to as the "federal offset.") In the case of higher prices, the only means of exportation is sales to out-of-state tourists. To determine the amount of taxes ex-ported to the federal government by consumers through the
federal offset, McLure computes for each state a.-weighted average of the marginal tax rates of those taxpayers who itemize deductions. These rates range from 15.3 percent to
23.2 percent, with most of them around 18 percent.** (Note
that if McLure had included other sectors---which for the most part are incorporated--as consumers, the amount of exporting through the federal offset would be much greater, because he uses a marginal tax rate of 50 percent for corporations.) To determine the amount of taxes exported through tourism, McLure assumes that, of all taxes borne by local consumers, tourists pay fifteen percent of the taxes in Nevada, Hawaii, and the
*This of course applies to tourists as well as local residents. McLure is able to ignore the federal offset of tourists because it has little impact upon tax exportation. As will be seen later, however, it does affect the distribu-tion of imported taxes.
Offset rates vary across tax categories because not all of each tax is deductible. For example, McLure includes
motor-fuel taxes on buses in with motor-fuel taxes on personal vehicles; consequently, a smaller percentage of the motor-fuel
tax on personal vehicles is paid by individuals (that is,
part of the tax on personal vehicles is paid by bus companies according to McLure) and deducted from federal income-tax liability than is the case with the property tax on owner-occupied property, which is paid entirely by individuals.
District of Columbia; ten percent in Florida; six percent in California, New York, and Illinois; and three percent in all other states.9 Taxes are passed on to national consumers only in the form of higher prices because sales taxes are not charged on interstate sales, and the commodities upon which other add-on taxes are levied--motor fuel, tobacto products, and alcoholic beverages--are generally not sold in interstate commerce.
In addition to distorting McLure's results, the skipping of intermediate demand also apparently causes some confusion in McLure's analysis. He assumes that all taxes on manufac-turing and mining become a cost of production and therefore are passed on only in the form of higher prices, not as add-ons (taxes on agriculture are not shifted to cadd-onsumers accord-ing to McLure). This assumption requires that retail-sales taxes not be levied upon these sectors, which of course could be the case only if they make no retail sales. And that is
not an unreasonable assumption. The vast majority of the out-put of those two sectors is sold wholesale to the commercial
sector, which in turn sells it retail. (This issue is treated in detail in the discussion of the MRIO model in Appendix A.) However, McLure then states that the consumers of local manu-facturing are tourists and local residents, but, in the case of the retail-sales tax, he makes no allowance for the federal offset for tourists and local residents. If manufacturing makes no retail sales, tourists and local residents cannot be
its customers--at least not to the extent that McLure indi-cates they are--but if, in fact, they are the consumers of the
output of local manufacturing being sold by the commercial sector and McLure just skips that intermediate step--as
appears to be the case--they must be treated the same as other commercial-sector consumers, that is, an allowance for the
federal offset must be made. By overlooking this, McLure
significantly understates the amount of tax exported to the federal government.
McLure also ignores the consumption by tourists of the output of national sectors. Output that is shipped from
state g to state h, for instance, may be purchased by tourists in state h. To the extent that these tourists are from state g
and that taxes are shifted to consumers, McLure overstates the amount of tax exportation. Admittedly, the amounts involved are quite small. However, in those states having high tourism rates, the redistribution of the exported tax could be very significant and must be taken- into account when the taxes imported by each state are calculated.
Shifting to Land and Labor
Taxes are shifted to land and labor in the form of
reduced--or not as greatly increased--rents and wages. This reduction in rents and wages means less federal income tax
is paid and, therefore, some of the taxes shifted to land and labor are exported to the federal government. This form of exportation is referred to by McLure as a "secondary offset."
Since McLure assumes that labor is immobile in response to taxes (that is, that persons do not change states of residence because of tax differentials), the taxes shifted to labor and
not exported to the federal government through the secondary
offset remain on labor in the state in which they are levied.
Of course, to the extent that labor commutes from out of
state, the taxes borne by labor are exported to other states.
But such commutation is significant in only six states and a
major factor in only one, the District of Columbia.10 Except
in the case of state individual-income taxes, McLure limits
his consideration of commutation to the District of Columbia.
That consideration is
further limited by the fact that,
according to McLure, there is no agriculture, mining, or
dominant national manufacturing in the District of Columbia,
and that some of the taxes under consideration
(corporation-income taxes for example) are not levied in that jurisdiction.
McLure assumes that land is locally owned by individuals
rather than corporations, so the secondary-offset rate for
reduced rents is the same as for reduced wages.
Shifting to Capital
Taxes are shifted to capital in the form of reduced
profits. As in previous cases, this means that less federal
income tax is paid and, therefore, that some of the taxes
shifted to capital are exported to the federal government
through the federal offset. The extent of this exportation
depends upon whether the capital is owned by a corporation, in
which case an export rate of 50 percent is assumed by McLure,
or is owned by individuals, in which case the
individual-offset rates of approximately 18 percent are used by McLure.
McLure assumes that all sectors are incorporated except
agri-culture, which he assumes is owned entirely by unincorporated
individuals. This obviously is not exactly the case. In
1962, corporations produced 14.6 percent of the output of the
agriculture sector, 87.7 percent of the output of the mining sector, 64.6 percent of the output of the construction sec-tor, 96.8 percent of the output of the manufacturing secsec-tor, and 71.1 percent of the output of the commercial-sector (see Appendix B), a total of 78.2 percent of all output compared
to McLure's assumptions of 96.2 percent. McLure's assump-tions therefore overstate the amount of exporting through the federal offset; although it of course could be argued that partnerships and sole proprietorships--which produce the rest of the output--probably have higher marginal tax rates than individuals and, therefore, that overall, McLure's 96.2 per-cent provides a reasonable estimate. (The handling of this point for the present study is discussed in the next section.)
All capital is assumed by McLure to be. owned by
indivi-duals who, in the case of local sectors and the agriculture sector, live locally and, in the case of national sectors other than agriculture, are distributed among the states in proportion to each state's share of dividends paid in the nation. To the extent reduced profits take the form of
reduced dividends, the owners of capital are able to shift some of the burden to the federal government through the secondary offset. (This is the mirror image of double taxa-tion of corporate profits.) McLure is aware of this, but because this additional step has an insignificant effect on the amount of tax exportation, he chooses to ignore it. As